| Param | Original file | Final file |
|---|---|---|
| Filename | modeM0/AS1T03_280T01_9000004222_29382cztM0_level2.evt | modeM0/AS1T03_280T01_9000004222_29382cztM0_level2_quad_clean.evt |
| Size (bytes) | 663,359,040 | 110,831,040 |
| Size | 632.6 MB | 105.7 MB |
| Events in quadrant A | 3,506,120 | 762,101 |
| Events in quadrant B | 3,708,623 | 781,219 |
| Events in quadrant C | 3,879,813 | 760,275 |
| Events in quadrant D | 8,538,982 | 582,224 |
| Mode M9 | |||
|---|---|---|---|
| Quadrant | BADHDUFLAG | Total packets | Discarded packets |
| A | 0 | 17 | 0 |
| B | 0 | 18 | 0 |
| C | 0 | 18 | 0 |
| D | 0 | 18 | 0 |
| Mode M0 | |||
|---|---|---|---|
| Quadrant | BADHDUFLAG | Total packets | Discarded packets |
| A | 0 | 14518 | 2 |
| B | 0 | 15209 | 2 |
| C | 0 | 15814 | 2 |
| D | 0 | 29905 | 2 |
| Mode SS | |||
|---|---|---|---|
| Quadrant | BADHDUFLAG | Total packets | Discarded packets |
| A | 0 | 138 | 0 |
| B | 0 | 138 | 0 |
| C | 0 | 138 | 0 |
| D | 0 | 138 | 0 |
| Quadrant | Total seconds | Saturated seconds | Saturation percentage |
|---|---|---|---|
| A | 6741 | 33 | 0.489542% |
| B | 6741 | 60 | 0.890076% |
| C | 6741 | 101 | 1.498294% |
| D | 6741 | 1815 | 26.924789% |
Noise dominated data is calculated using 1-second bins in cleaned event files. If a bin has >2000 counts, and if more than 50% of those come from <1% of pixels, then it is considered to be noise-dominated and hence unusable.
| Quadrant | # 1 sec bins | Bins with >0 counts | Bins with >2000 counts | High rate bins dominated by noise | Noise dominated (total time) | Noise dominated (detector-on time) | Marked lightcurve |
|---|---|---|---|---|---|---|---|
| A | 7966 | 6742 | 12 | 12 | 0.15% | 0.18% | 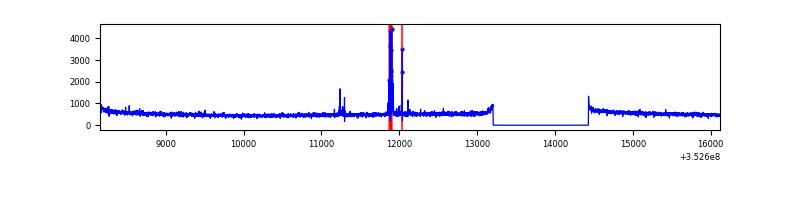 |
| B | 7966 | 6742 | 18 | 18 | 0.23% | 0.27% | 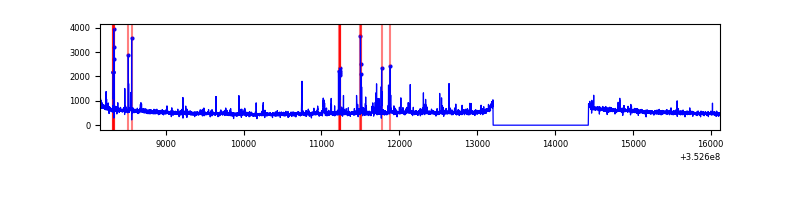 |
| C | 7966 | 6742 | 1 | 1 | 0.01% | 0.01% | 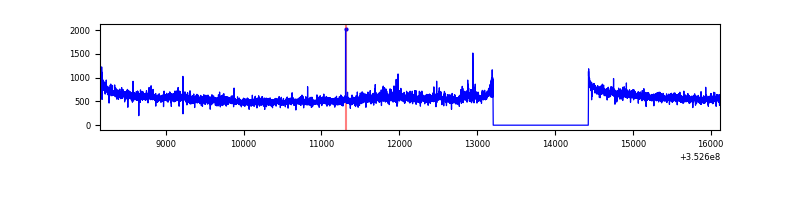 |
| D | 7966 | 6742 | 1672 | 1672 | 20.99% | 24.80% | 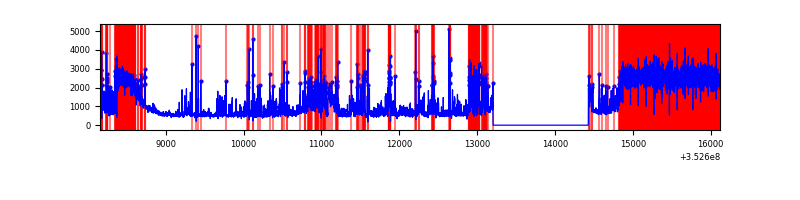 |
Top three noisy pixels from each quadrant. If the there are fewer than three noisy pixels in the level2.evt file, extra rows are filled as -1
| Pixel properties | Quadrant properties | ||||||
|---|---|---|---|---|---|---|---|
| Quadrant | DetID | PixID | Counts | Sigma | Mean | Median | Sigma |
| A | 15 | 174 | 87109 | 494.33 | 885 | 872 | 174.5 |
| A | 13 | 254 | 13203 | 70.68 | 885 | 872 | 174.5 |
| A | 3 | 137 | 7738 | 39.35 | 885 | 872 | 174.5 |
| B | 0 | 229 | 79282 | 477.04 | 889 | 869 | 164.4 |
| B | 5 | 255 | 69672 | 418.57 | 889 | 869 | 164.4 |
| B | 0 | 156 | 22984 | 134.54 | 889 | 869 | 164.4 |
| C | 3 | 233 | 282269 | 1374.88 | 878 | 889 | 204.7 |
| C | 14 | 238 | 141596 | 687.52 | 878 | 889 | 204.7 |
| C | 2 | 114 | 16140 | 74.52 | 878 | 889 | 204.7 |
| D | 12 | 33 | 3983732 | 22216.35 | 767 | 749 | 179.3 |
| D | 1 | 52 | 1149445 | 6407.21 | 767 | 749 | 179.3 |
| D | 13 | 153 | 123179 | 682.89 | 767 | 749 | 179.3 |
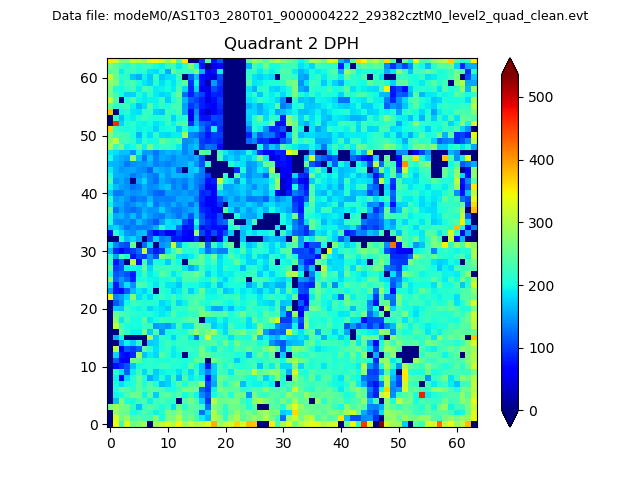
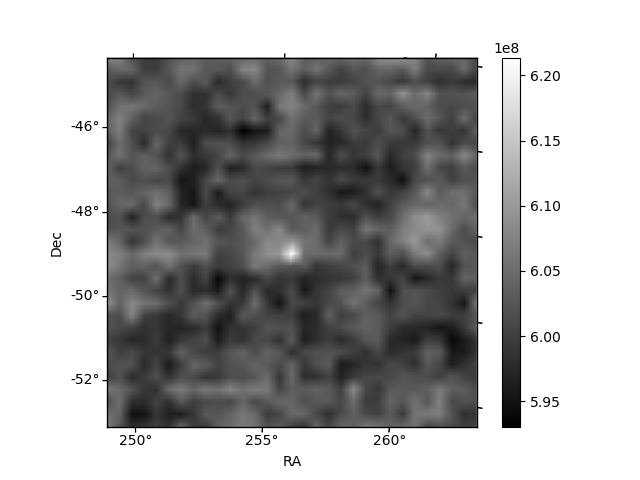
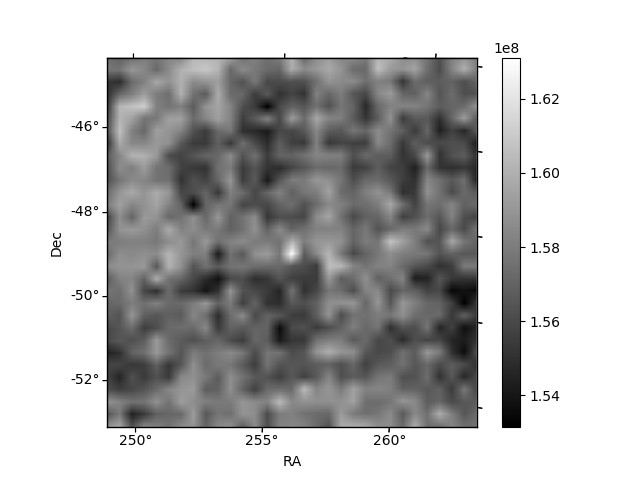
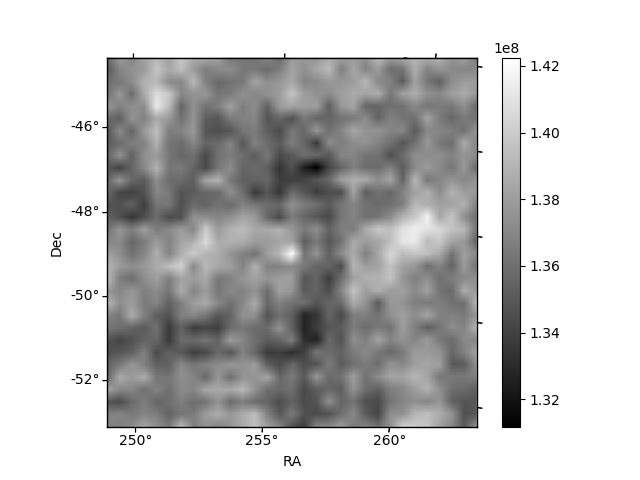
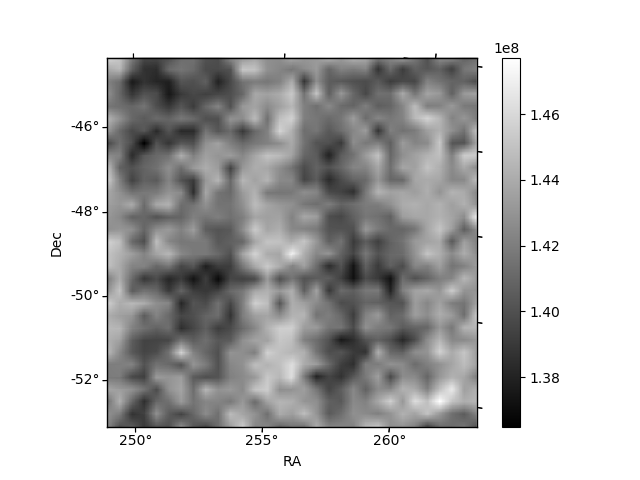
Histogram calculated using DETX and DETY for each event in the final _common_clean file
| Quadrant A | 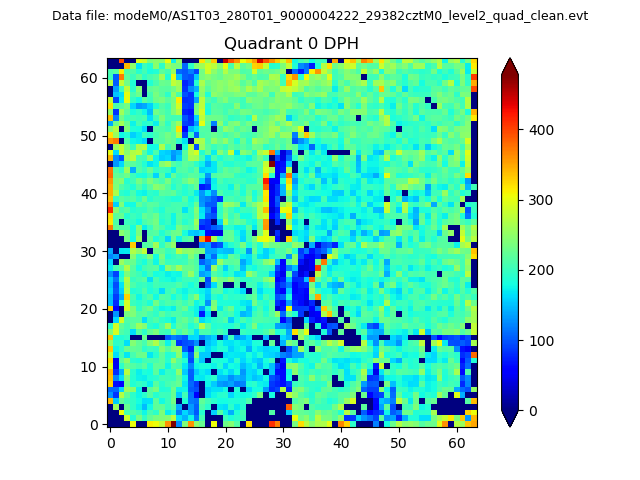 |
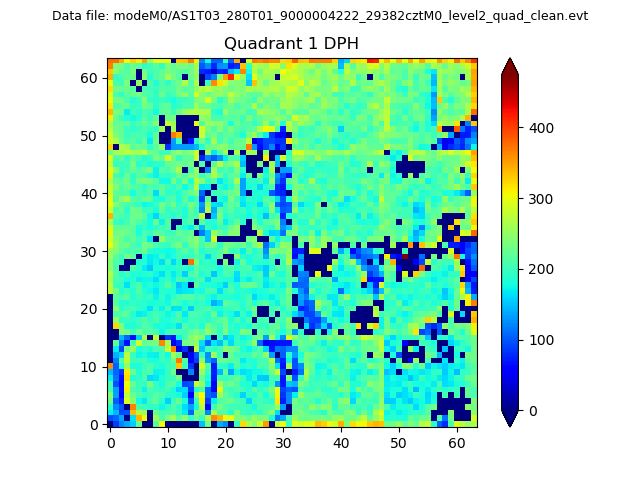 |
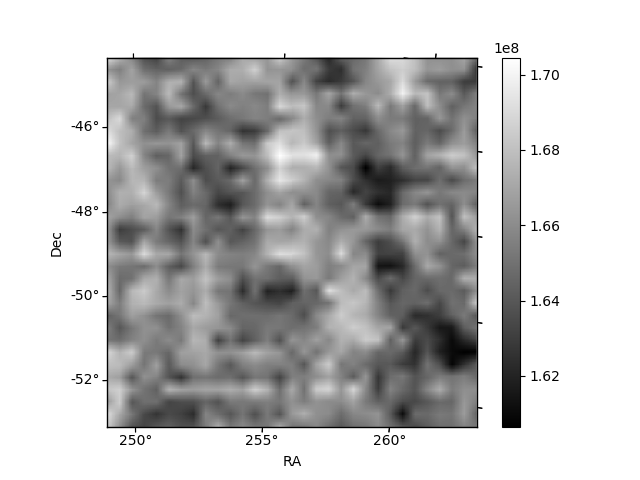
Quadrant B |
|---|---|---|---|
| Quadrant D | 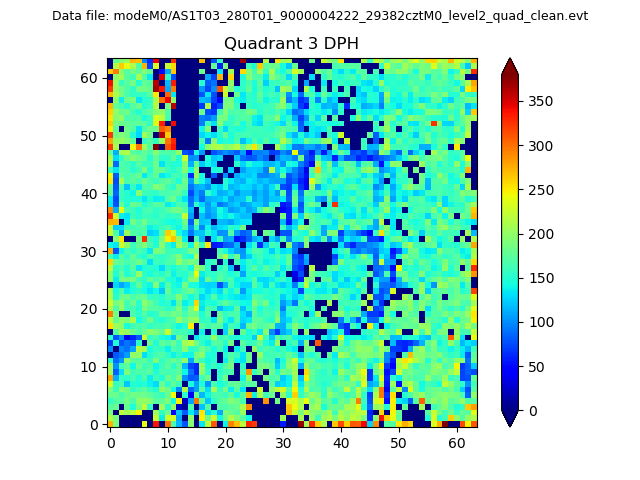 |
 |
Quadrant C |
| Plot type | Count rate plots | Images |
|---|---|---|
| Comparison with Poisson distribution Blue bars denote a histogram of data divided into 1 sec bins. Red curve is a Poisson curve with rate = median count rate of data. |
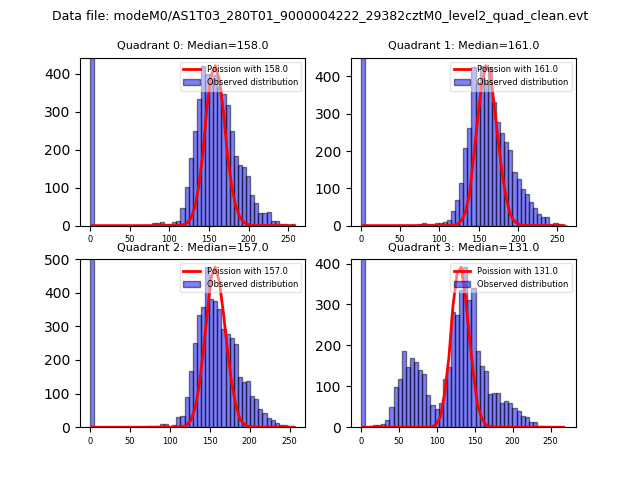 |
 |
| Quadrant-wise count rates Data is divided into 100 sec bins |
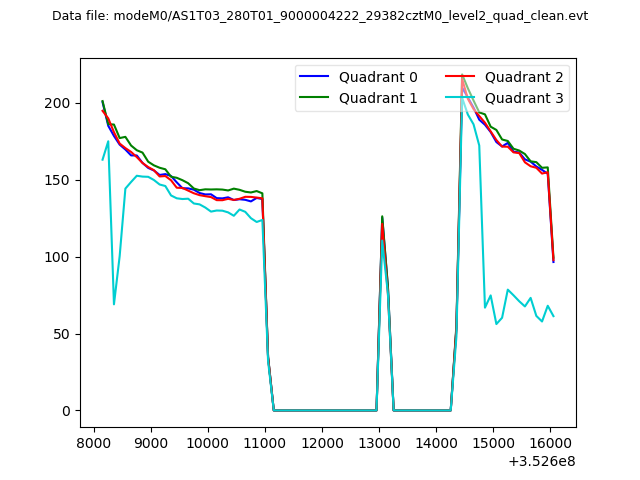 |
|
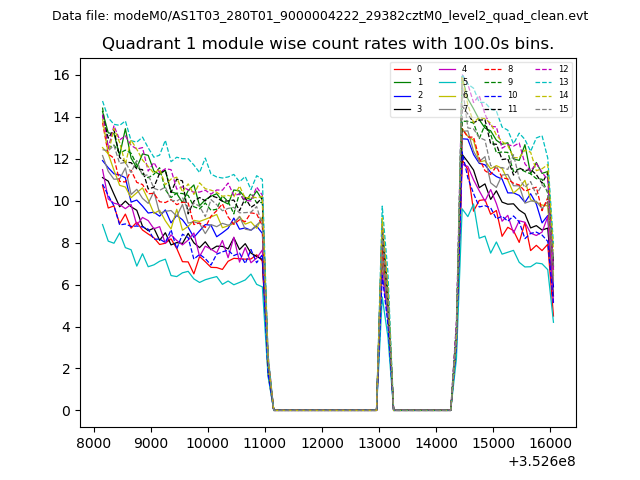
| Module-wise count rates for Quadrant A Data is divided into 100 sec bins |
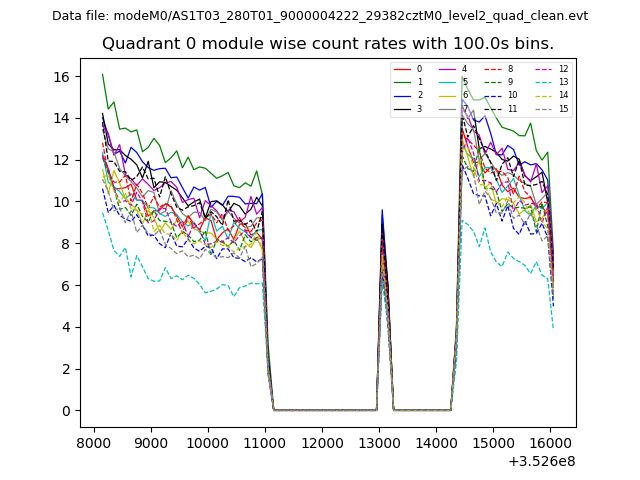 |
 |
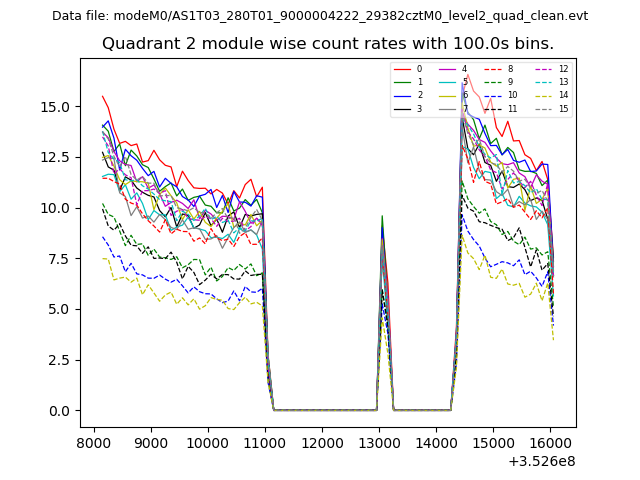
| Module-wise count rates for Quadrant B Data is divided into 100 sec bins |
 |
 |
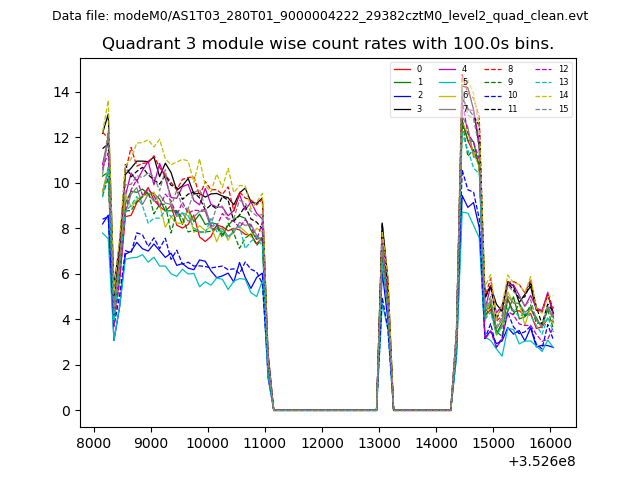
| Module-wise count rates for Quadrant C Data is divided into 100 sec bins |
 |
 |
| Module-wise count rates for Quadrant D Data is divided into 100 sec bins |
 |
 |
| Parameter | Plot |
|---|---|
| CZT HV Monitor | 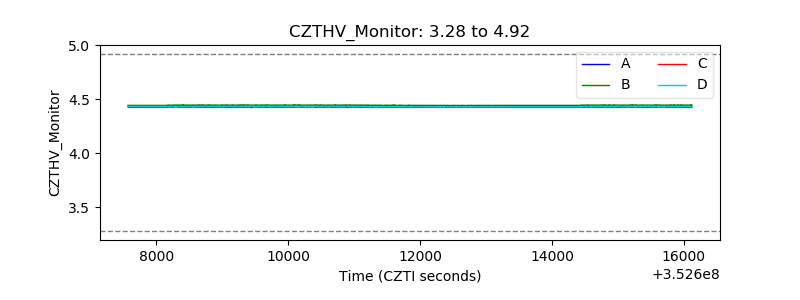 |
| D_VDD | 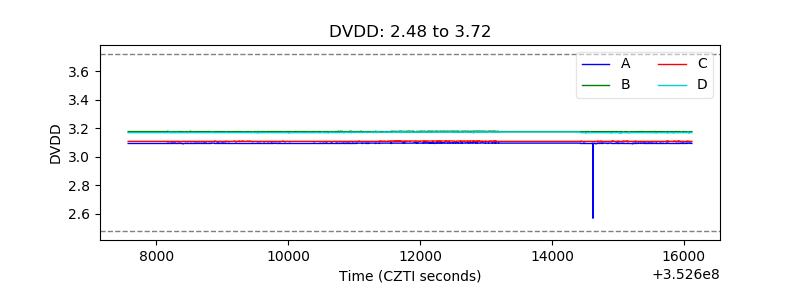 |
| Temperature 1 | 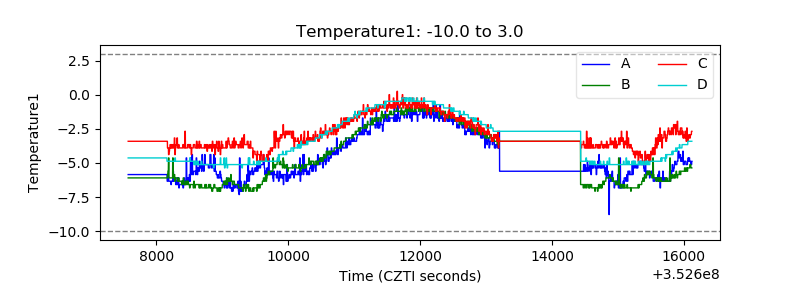 |
| Veto HV Monitor | 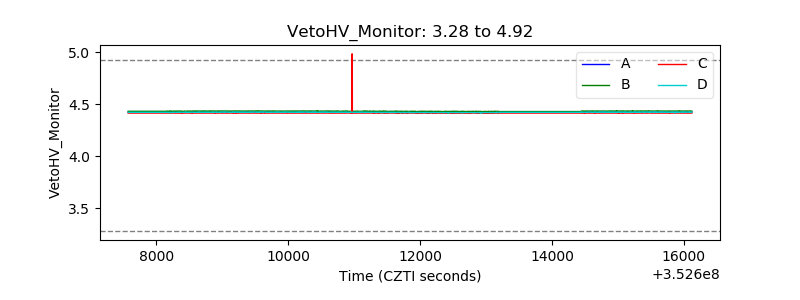 |
| Veto LLD | 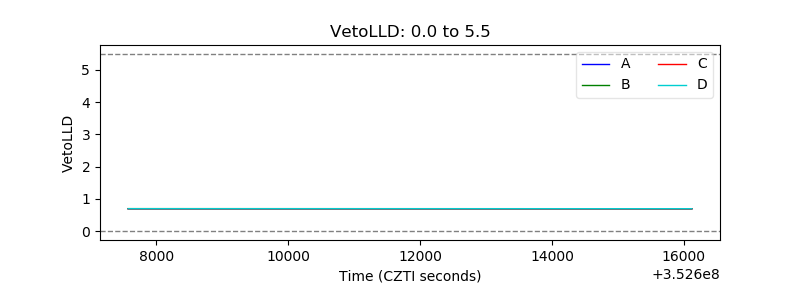 |
| Alpha Counter | 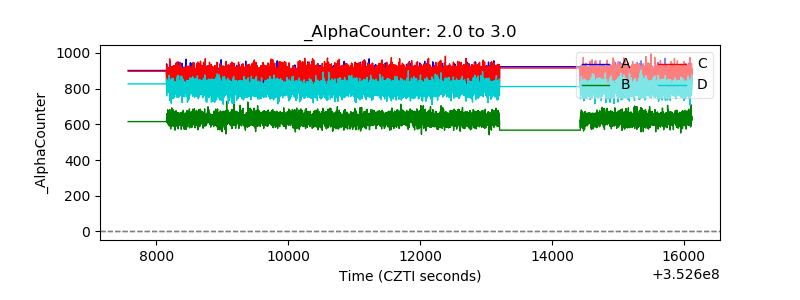 |
| _CPM_Rate | 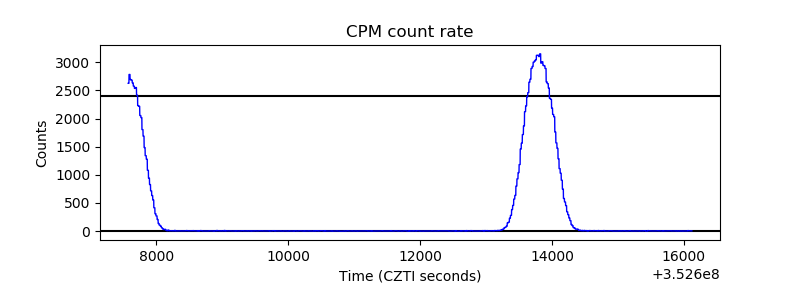 |
| CZT Counter | 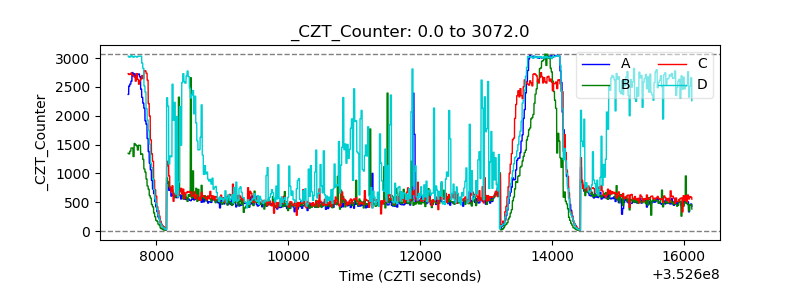 |
| +2.5 Volts monitor | 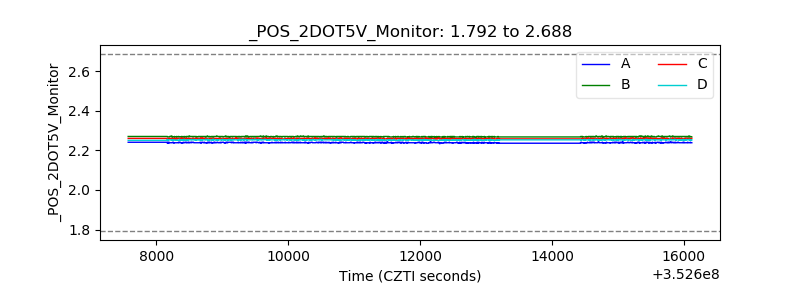 |
| +5 Volts monitor | 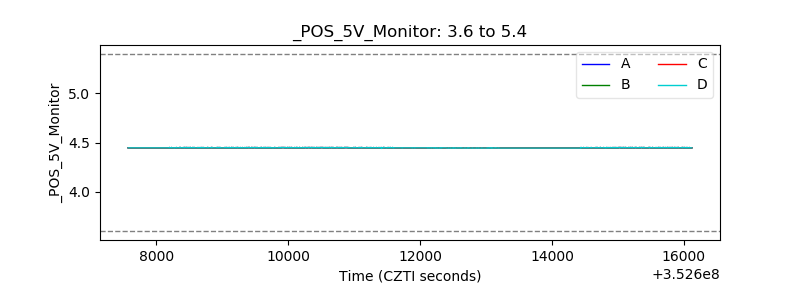 |
| _ROLL_ROT | 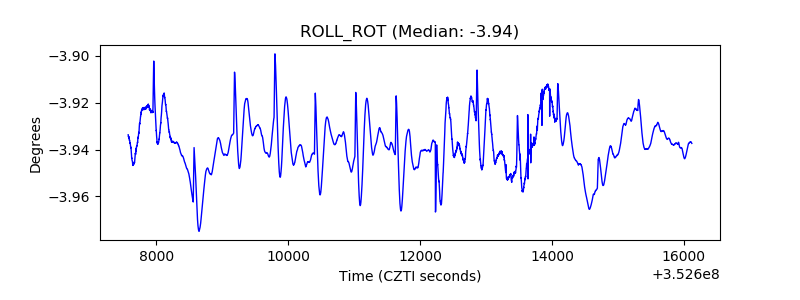 |
| _Roll_DEC | 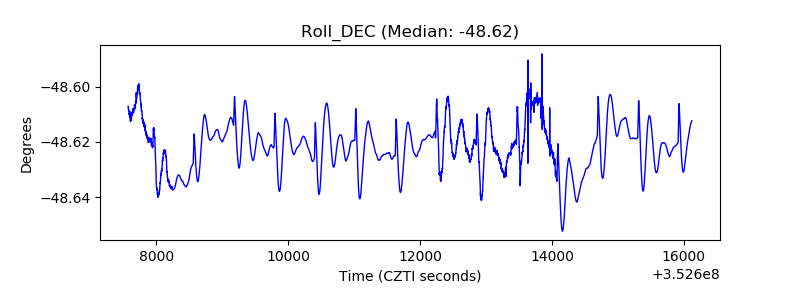 |
| _Roll_RA | 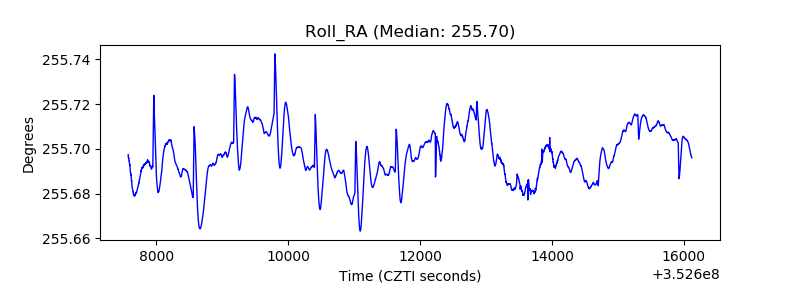 |
| Veto Counter | 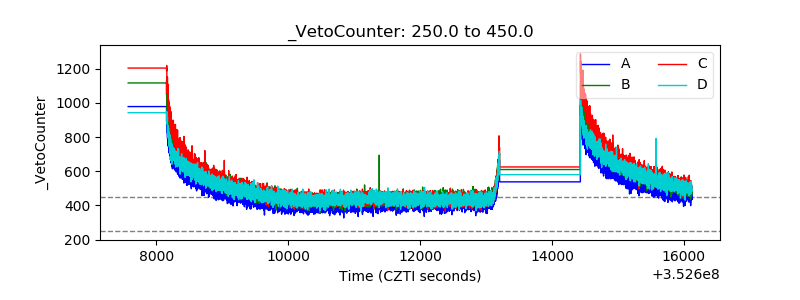 |