| Param | Original file | Final file |
|---|---|---|
| Filename | modeM0/AS1T03_280T01_9000004222_29384cztM0_level2.evt | modeM0/AS1T03_280T01_9000004222_29384cztM0_level2_quad_clean.evt |
| Size (bytes) | 608,785,920 | 94,366,080 |
| Size | 580.6 MB | 90.0 MB |
| Events in quadrant A | 3,068,563 | 642,062 |
| Events in quadrant B | 3,210,600 | 649,897 |
| Events in quadrant C | 3,620,209 | 621,422 |
| Events in quadrant D | 8,149,701 | 543,038 |
| Mode M9 | |||
|---|---|---|---|
| Quadrant | BADHDUFLAG | Total packets | Discarded packets |
| A | 0 | 13 | 0 |
| B | 0 | 13 | 0 |
| C | 0 | 13 | 0 |
| D | 0 | 13 | 0 |
| Mode M0 | |||
|---|---|---|---|
| Quadrant | BADHDUFLAG | Total packets | Discarded packets |
| A | 0 | 12325 | 1 |
| B | 0 | 12889 | 1 |
| C | 0 | 14832 | 1 |
| D | 0 | 28249 | 3 |
| Mode SS | |||
|---|---|---|---|
| Quadrant | BADHDUFLAG | Total packets | Discarded packets |
| A | 0 | 118 | 0 |
| B | 0 | 118 | 0 |
| C | 0 | 118 | 0 |
| D | 0 | 118 | 0 |
| Quadrant | Total seconds | Saturated seconds | Saturation percentage |
|---|---|---|---|
| A | 5732 | 41 | 0.715283% |
| B | 5733 | 75 | 1.308216% |
| C | 5733 | 139 | 2.424560% |
| D | 5732 | 1637 | 28.558967% |
Noise dominated data is calculated using 1-second bins in cleaned event files. If a bin has >2000 counts, and if more than 50% of those come from <1% of pixels, then it is considered to be noise-dominated and hence unusable.
| Quadrant | # 1 sec bins | Bins with >0 counts | Bins with >2000 counts | High rate bins dominated by noise | Noise dominated (total time) | Noise dominated (detector-on time) | Marked lightcurve |
|---|---|---|---|---|---|---|---|
| A | 7037 | 5733 | 0 | 0 | 0.00% | 0.00% | 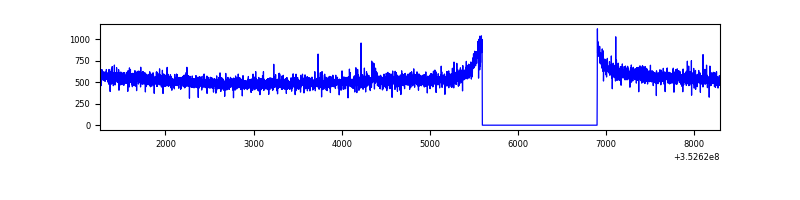 |
| B | 7038 | 5734 | 5 | 5 | 0.07% | 0.09% | 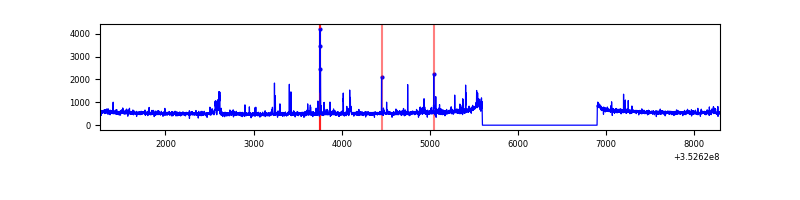 |
| C | 7038 | 5734 | 0 | 0 | 0.00% | 0.00% | 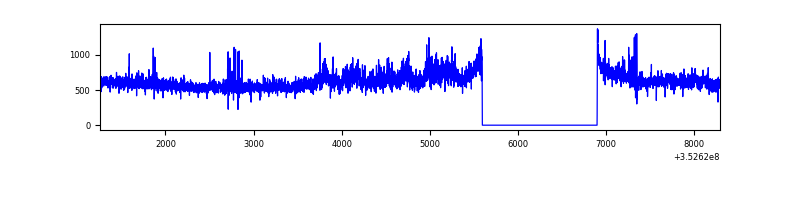 |
| D | 7037 | 5733 | 1351 | 1351 | 19.20% | 23.57% | 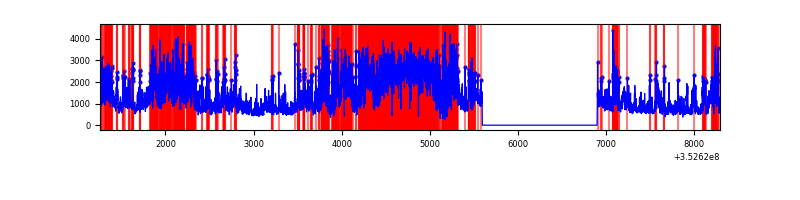 |
Top three noisy pixels from each quadrant. If the there are fewer than three noisy pixels in the level2.evt file, extra rows are filled as -1
| Pixel properties | Quadrant properties | ||||||
|---|---|---|---|---|---|---|---|
| Quadrant | DetID | PixID | Counts | Sigma | Mean | Median | Sigma |
| A | 13 | 254 | 11343 | 68.2 | 793 | 781 | 154.9 |
| A | 1 | 113 | 7702 | 44.69 | 793 | 781 | 154.9 |
| A | 0 | 226 | 6899 | 39.5 | 793 | 781 | 154.9 |
| B | 0 | 229 | 53703 | 367.7 | 778 | 760 | 144.0 |
| B | 0 | 190 | 45821 | 312.96 | 778 | 760 | 144.0 |
| B | 5 | 255 | 32721 | 221.98 | 778 | 760 | 144.0 |
| C | 3 | 233 | 415818 | 2320.98 | 769 | 780 | 178.8 |
| C | 14 | 238 | 141859 | 788.94 | 769 | 780 | 178.8 |
| C | 14 | 254 | 23896 | 129.27 | 769 | 780 | 178.8 |
| D | 12 | 33 | 2619063 | 15913.95 | 697 | 681 | 164.5 |
| D | 1 | 52 | 1840670 | 11183.05 | 697 | 681 | 164.5 |
| D | 8 | 195 | 465317 | 2823.96 | 697 | 681 | 164.5 |
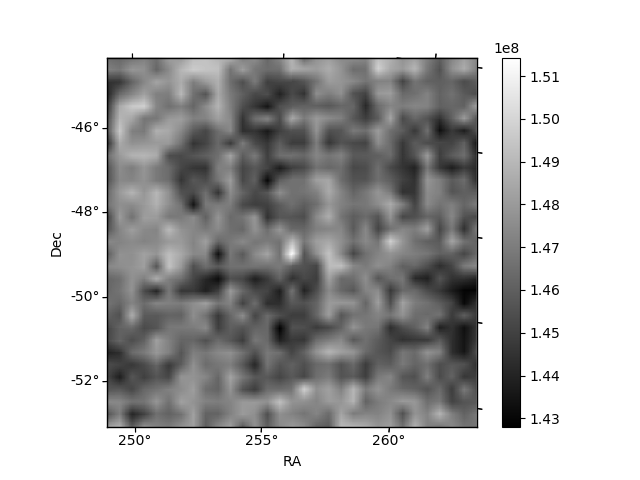
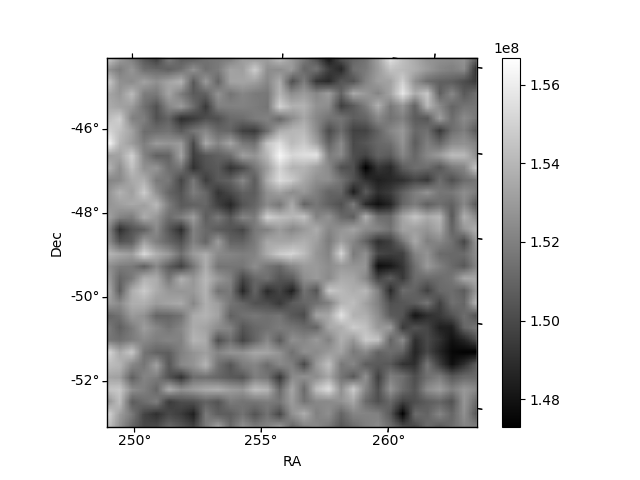
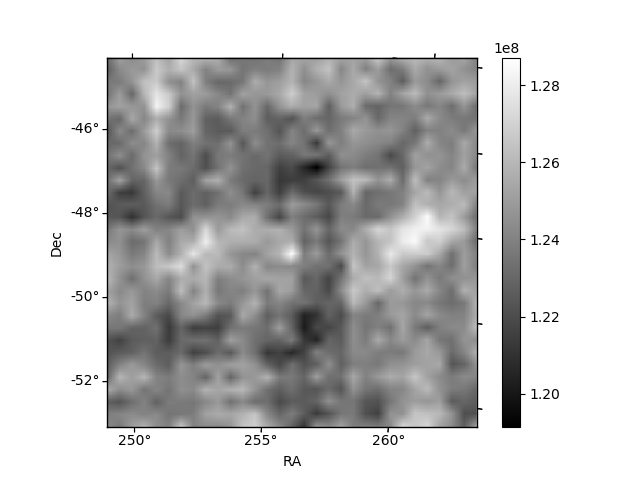
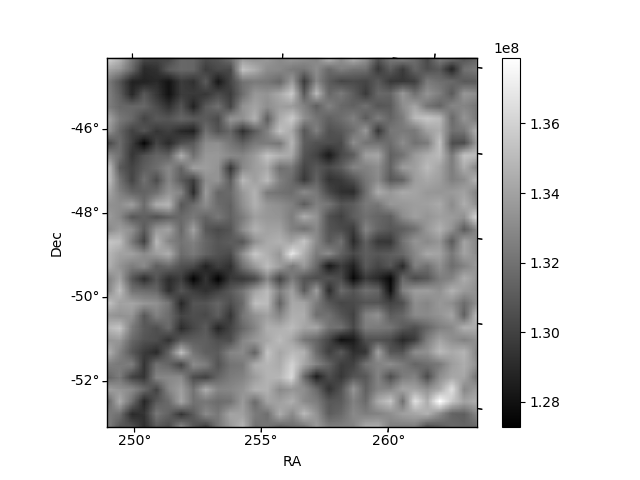
Histogram calculated using DETX and DETY for each event in the final _common_clean file
| Quadrant A | 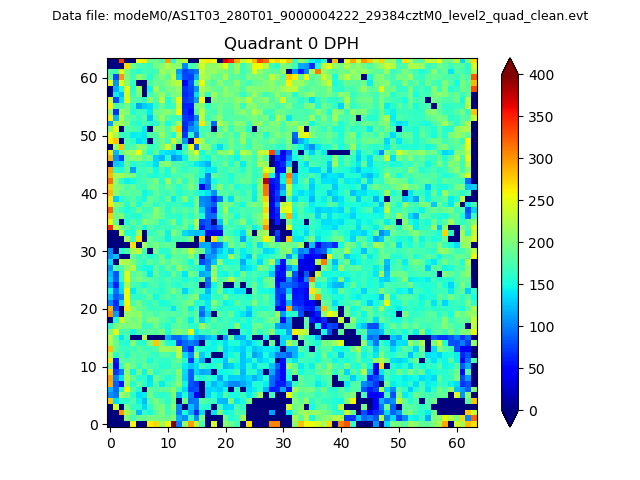 |
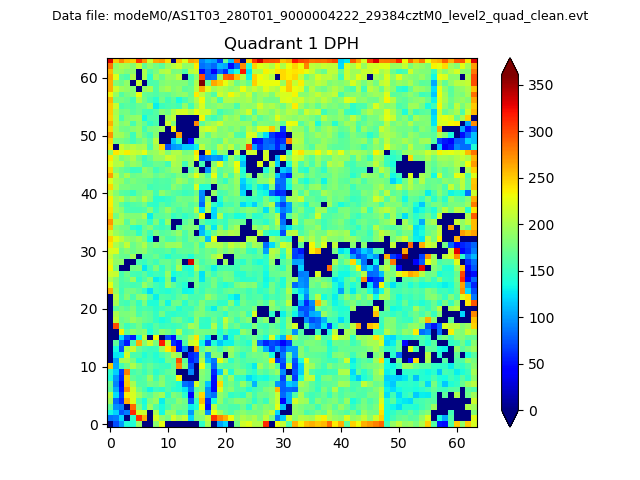 |
Quadrant B |
|---|---|---|---|
| Quadrant D | 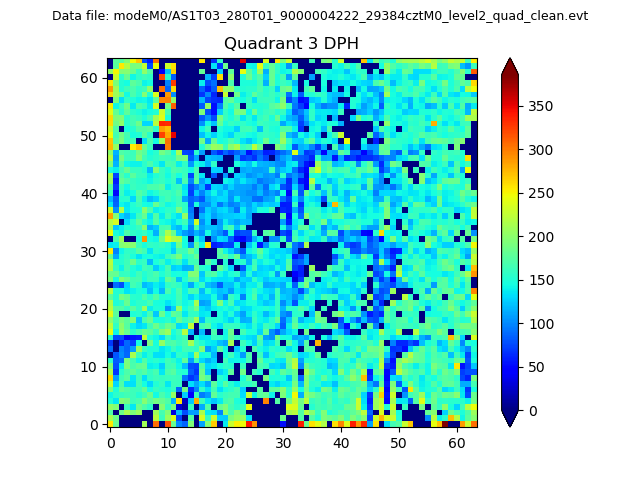 |
 |
Quadrant C |
| Plot type | Count rate plots | Images |
|---|---|---|
| Comparison with Poisson distribution Blue bars denote a histogram of data divided into 1 sec bins. Red curve is a Poisson curve with rate = median count rate of data. |
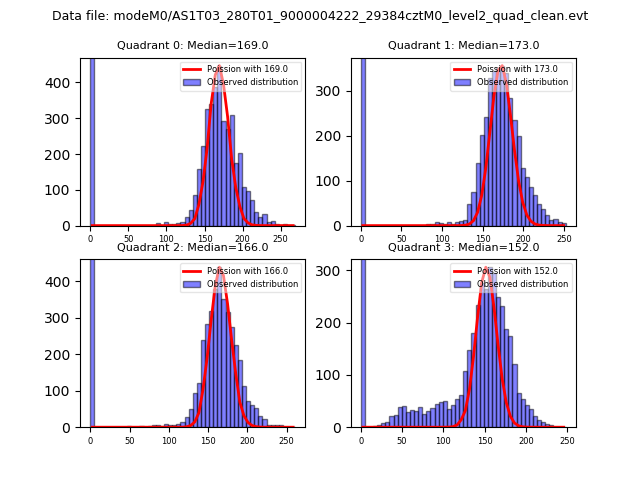 |
 |
| Quadrant-wise count rates Data is divided into 100 sec bins |
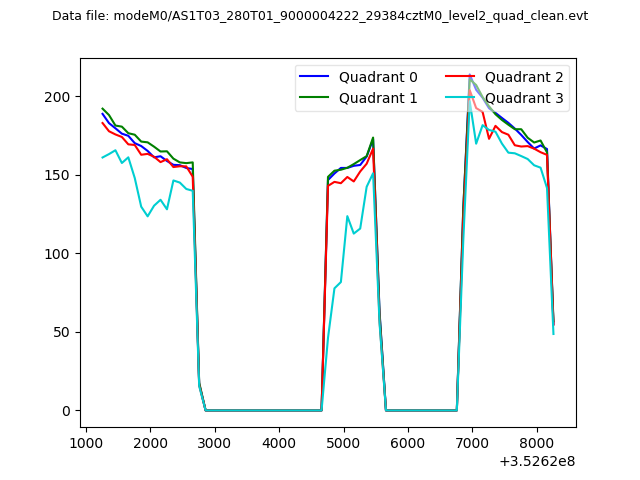 |
|
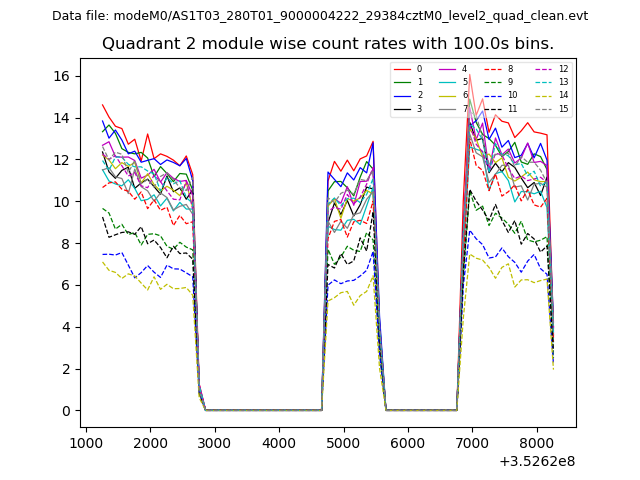
| Module-wise count rates for Quadrant A Data is divided into 100 sec bins |
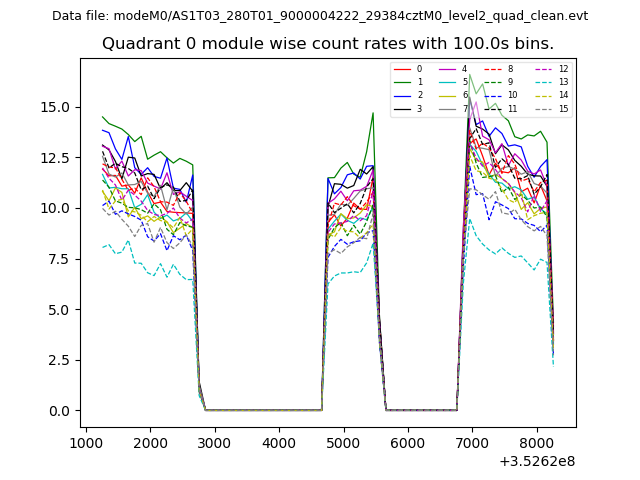 |
 |
| Module-wise count rates for Quadrant B Data is divided into 100 sec bins |
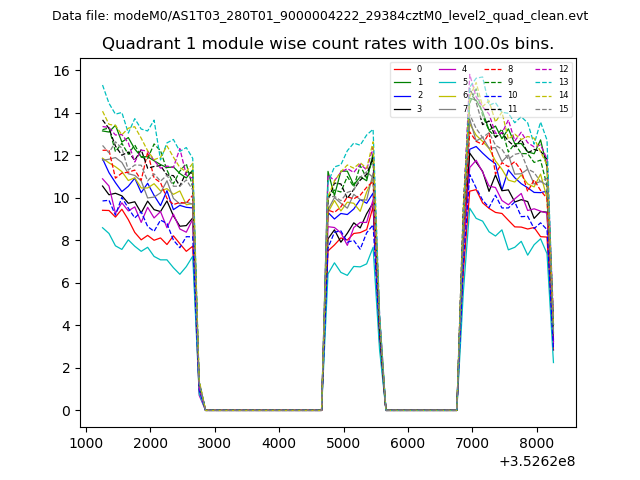 |
 |
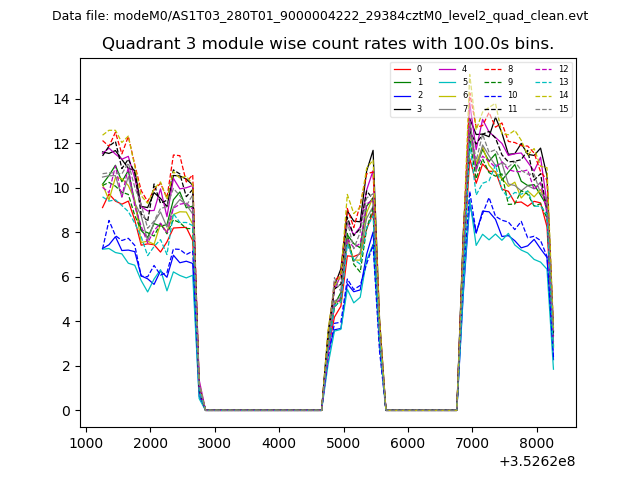
| Module-wise count rates for Quadrant C Data is divided into 100 sec bins |
 |
 |
| Module-wise count rates for Quadrant D Data is divided into 100 sec bins |
 |
 |
| Parameter | Plot |
|---|---|
| CZT HV Monitor | 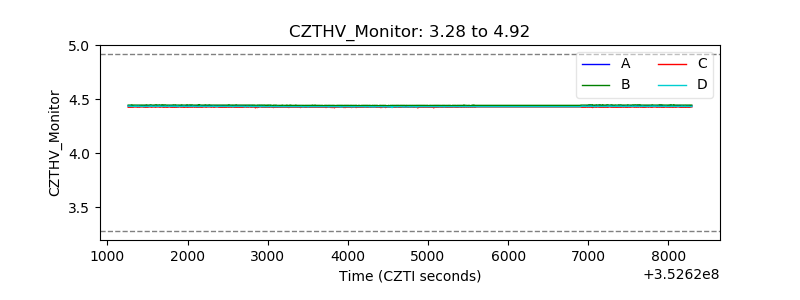 |
| D_VDD | 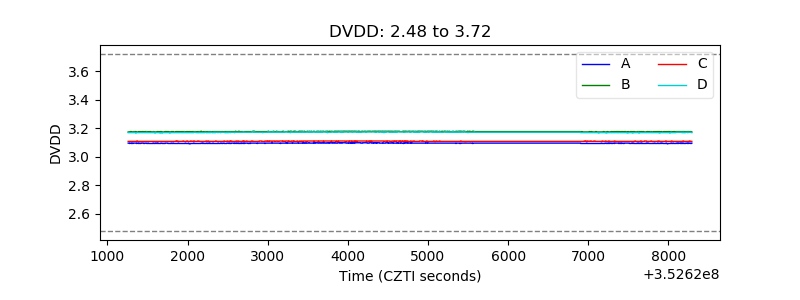 |
| Temperature 1 | 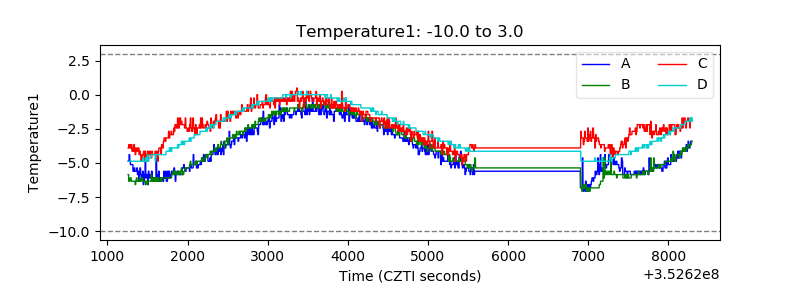 |
| Veto HV Monitor | 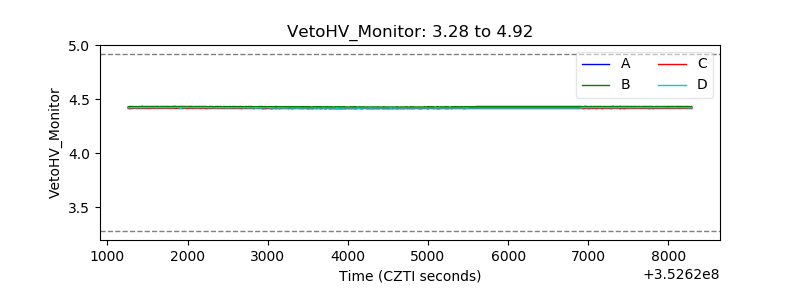 |
| Veto LLD | 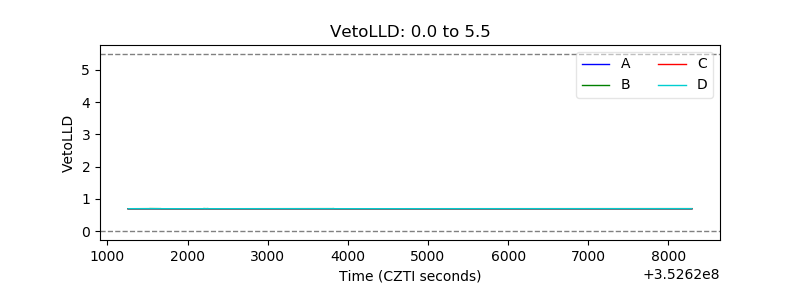 |
| Alpha Counter | 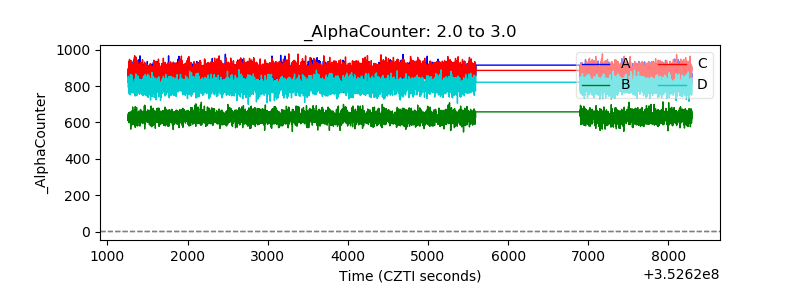 |
| _CPM_Rate | 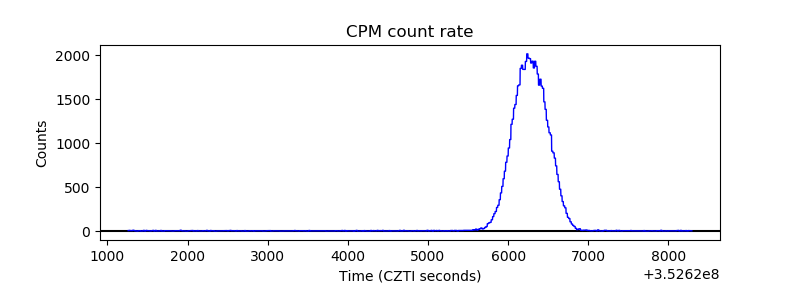 |
| CZT Counter |  |
| +2.5 Volts monitor |  |
| +5 Volts monitor | 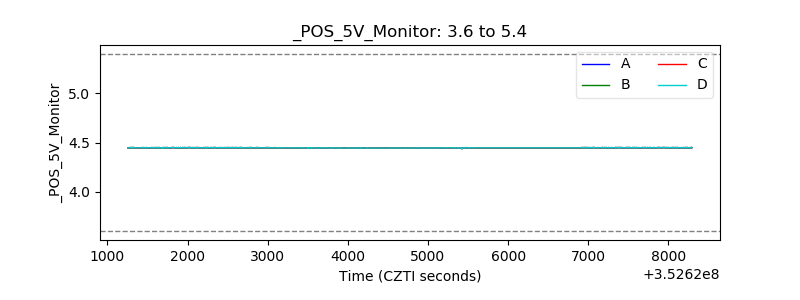 |
| _ROLL_ROT | 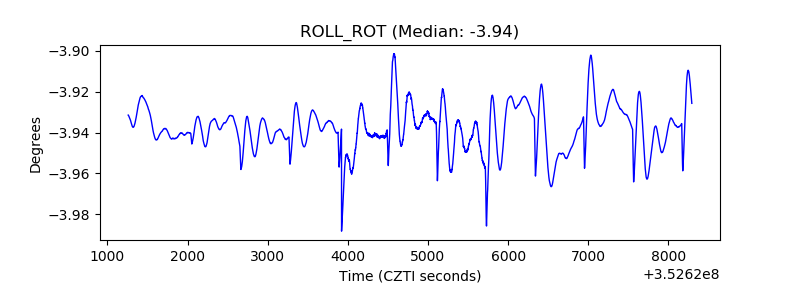 |
| _Roll_DEC | 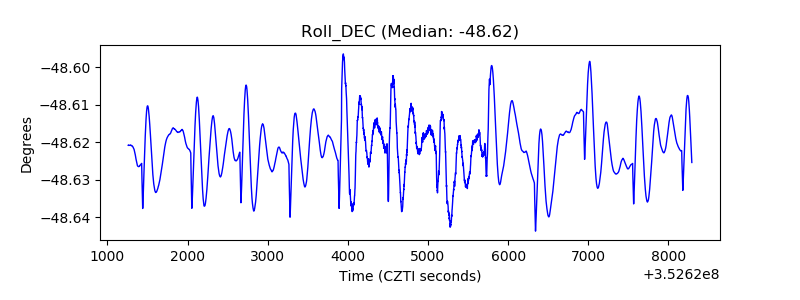 |
| _Roll_RA |  |
| Veto Counter | 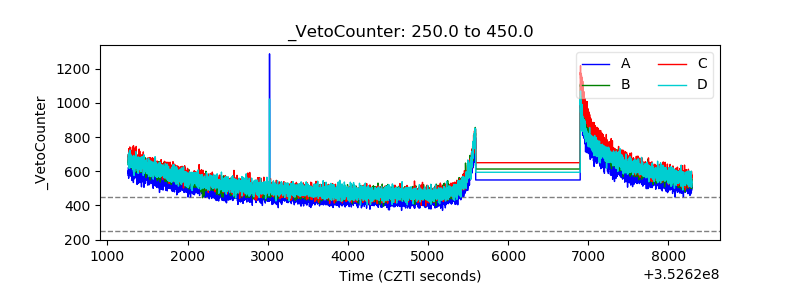 |