| Param | Original file | Final file |
|---|---|---|
| Filename | modeM0/AS1T03_280T01_9000004222_29385cztM0_level2.evt | modeM0/AS1T03_280T01_9000004222_29385cztM0_level2_quad_clean.evt |
| Size (bytes) | 368,645,760 | 39,896,640 |
| Size | 351.6 MB | 38.0 MB |
| Events in quadrant A | 1,786,484 | 252,929 |
| Events in quadrant B | 1,891,690 | 254,319 |
| Events in quadrant C | 2,389,091 | 239,975 |
| Events in quadrant D | 4,856,356 | 209,541 |
| Mode M0 | |||
|---|---|---|---|
| Quadrant | BADHDUFLAG | Total packets | Discarded packets |
| A | 0 | 7208 | 0 |
| B | 0 | 7596 | 0 |
| C | 0 | 9728 | 0 |
| D | 0 | 16910 | 0 |
| Mode SS | |||
|---|---|---|---|
| Quadrant | BADHDUFLAG | Total packets | Discarded packets |
| A | 0 | 70 | 0 |
| B | 0 | 70 | 0 |
| C | 0 | 70 | 0 |
| D | 0 | 70 | 0 |
| Quadrant | Total seconds | Saturated seconds | Saturation percentage |
|---|---|---|---|
| A | 3541 | 2 | 0.056481% |
| B | 3542 | 15 | 0.423490% |
| C | 3542 | 148 | 4.178430% |
| D | 3542 | 747 | 21.089780% |
Noise dominated data is calculated using 1-second bins in cleaned event files. If a bin has >2000 counts, and if more than 50% of those come from <1% of pixels, then it is considered to be noise-dominated and hence unusable.
| Quadrant | # 1 sec bins | Bins with >0 counts | Bins with >2000 counts | High rate bins dominated by noise | Noise dominated (total time) | Noise dominated (detector-on time) | Marked lightcurve |
|---|---|---|---|---|---|---|---|
| A | 3541 | 3541 | 0 | 0 | 0.00% | 0.00% |  |
| B | 3542 | 3542 | 3 | 3 | 0.08% | 0.08% |  |
| C | 3542 | 3542 | 1 | 1 | 0.03% | 0.03% |  |
| D | 3542 | 3542 | 727 | 727 | 20.53% | 20.53% | 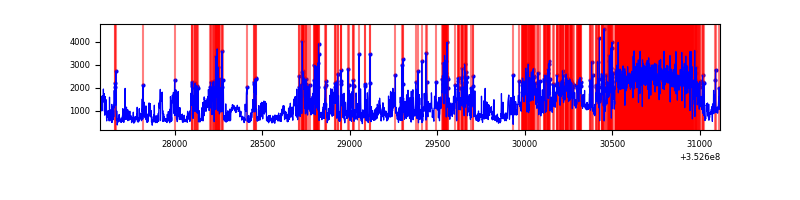 |
Top three noisy pixels from each quadrant. If the there are fewer than three noisy pixels in the level2.evt file, extra rows are filled as -1
| Pixel properties | Quadrant properties | ||||||
|---|---|---|---|---|---|---|---|
| Quadrant | DetID | PixID | Counts | Sigma | Mean | Median | Sigma |
| A | 13 | 254 | 7737 | 79.38 | 462 | 454 | 91.7 |
| A | 0 | 226 | 3991 | 38.55 | 462 | 454 | 91.7 |
| A | 3 | 137 | 3804 | 36.51 | 462 | 454 | 91.7 |
| B | 5 | 255 | 60251 | 708.26 | 450 | 441 | 84.4 |
| B | 0 | 229 | 32148 | 375.47 | 450 | 441 | 84.4 |
| B | 12 | 111 | 9228 | 104.05 | 450 | 441 | 84.4 |
| C | 3 | 233 | 461617 | 4561.58 | 433 | 437 | 101.1 |
| C | 14 | 238 | 113250 | 1115.85 | 433 | 437 | 101.1 |
| C | 14 | 254 | 61173 | 600.75 | 433 | 437 | 101.1 |
| D | 12 | 33 | 1422048 | 14429.73 | 417 | 408 | 98.5 |
| D | 1 | 52 | 1357484 | 13774.4 | 417 | 408 | 98.5 |
| D | 8 | 195 | 155982 | 1579.08 | 417 | 408 | 98.5 |
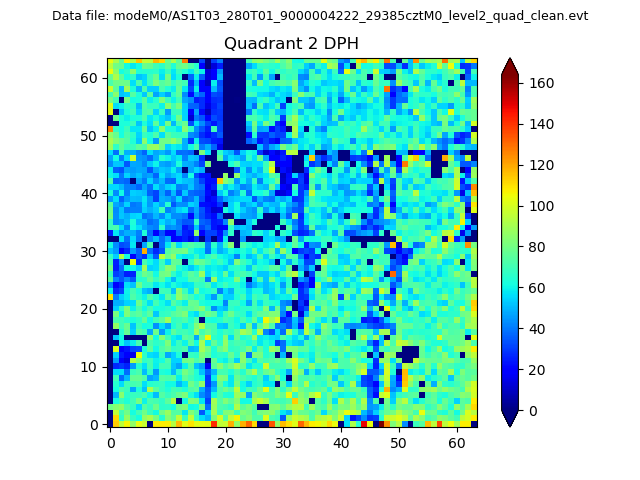
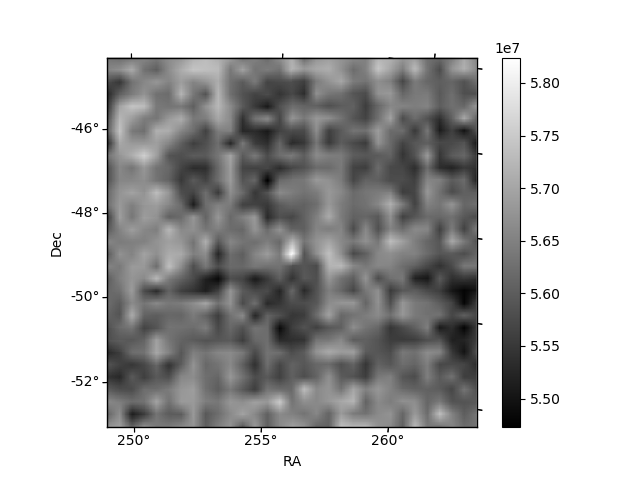
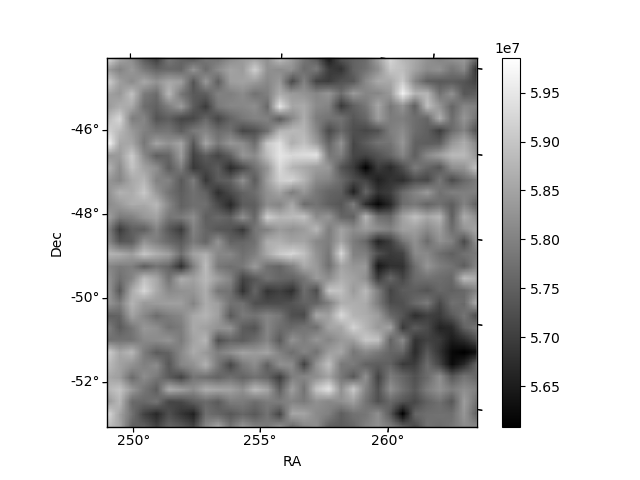
Histogram calculated using DETX and DETY for each event in the final _common_clean file
| Quadrant A |  |
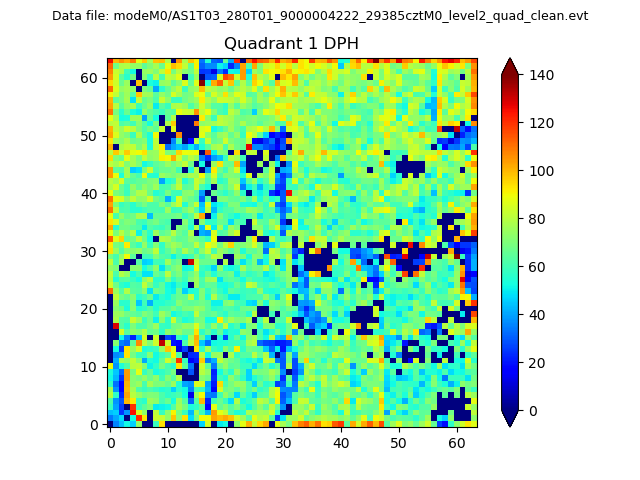 |
Quadrant B |
|---|---|---|---|
| Quadrant D |  |
 |
Quadrant C |
| Plot type | Count rate plots | Images |
|---|---|---|
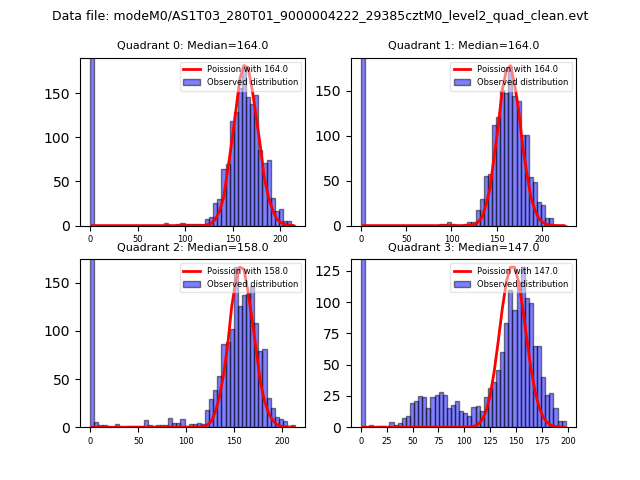
| Comparison with Poisson distribution Blue bars denote a histogram of data divided into 1 sec bins. Red curve is a Poisson curve with rate = median count rate of data. |
 |
 |
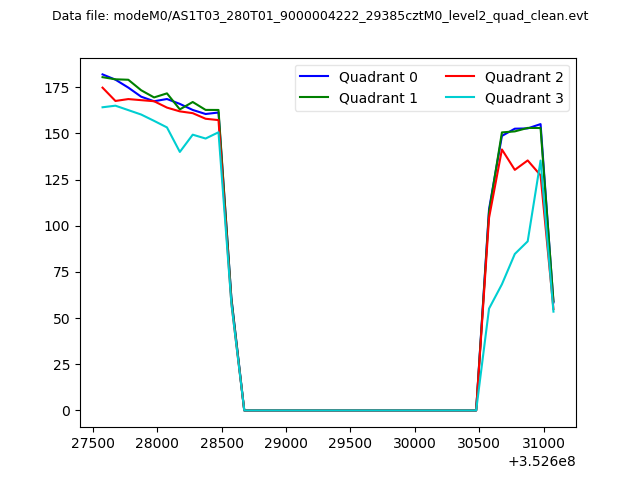
| Quadrant-wise count rates Data is divided into 100 sec bins |
 |
|
| Module-wise count rates for Quadrant A Data is divided into 100 sec bins |
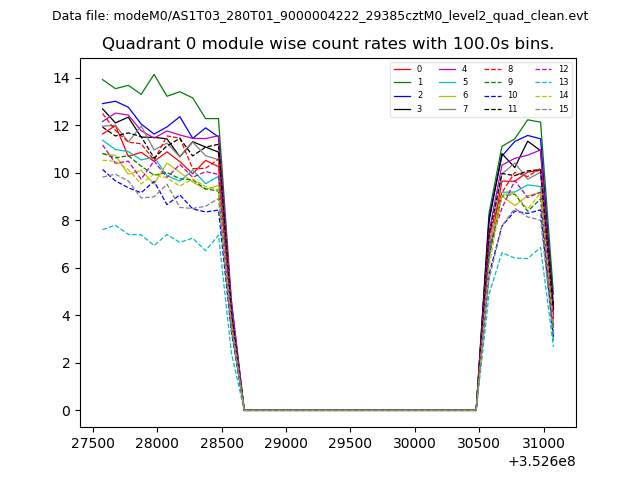 |
 |
| Module-wise count rates for Quadrant B Data is divided into 100 sec bins |
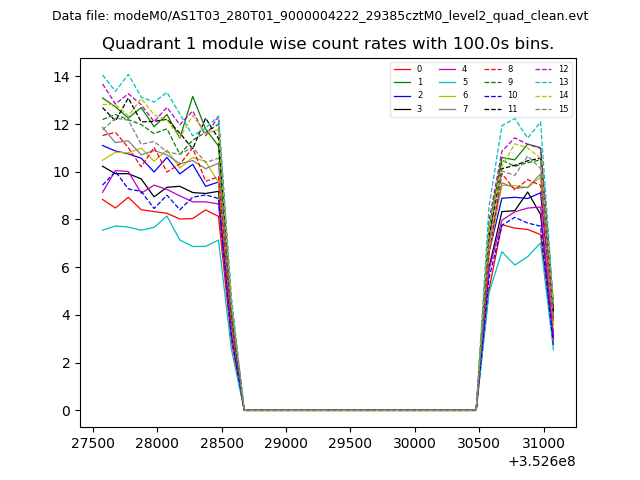 |
 |
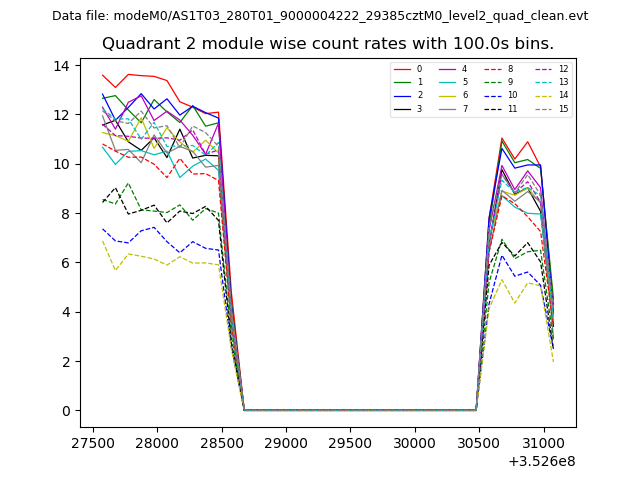
| Module-wise count rates for Quadrant C Data is divided into 100 sec bins |
 |
 |
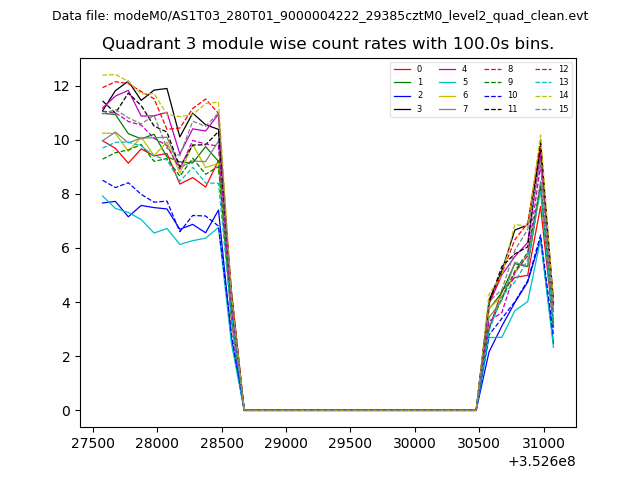
| Module-wise count rates for Quadrant D Data is divided into 100 sec bins |
 |
 |
| Parameter | Plot |
|---|---|
| CZT HV Monitor | 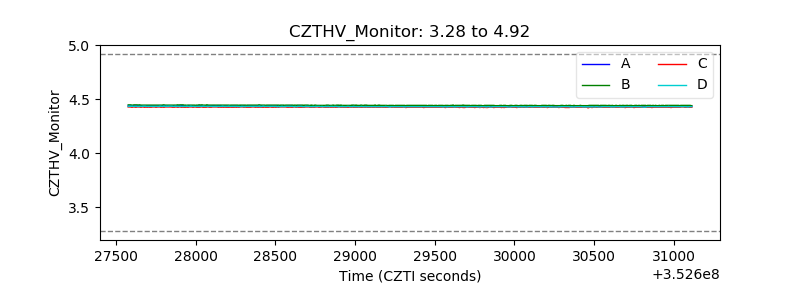 |
| D_VDD | 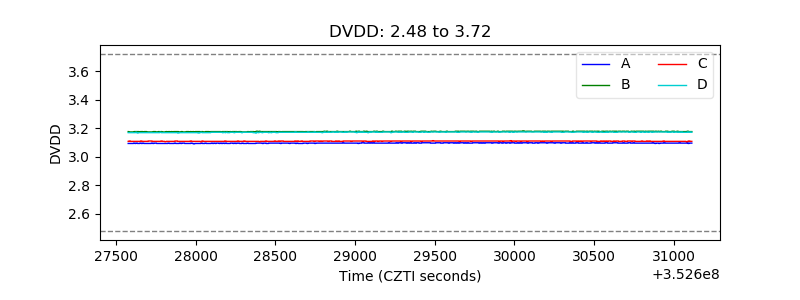 |
| Temperature 1 | 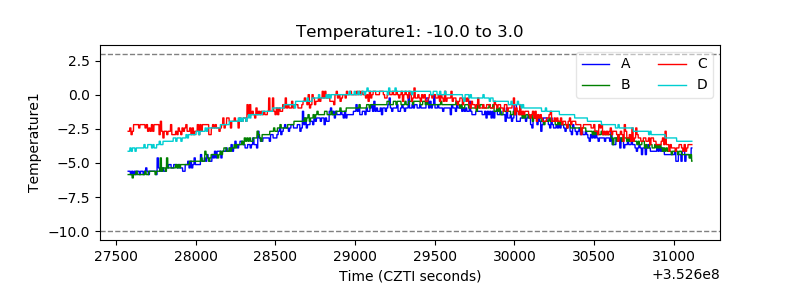 |
| Veto HV Monitor | 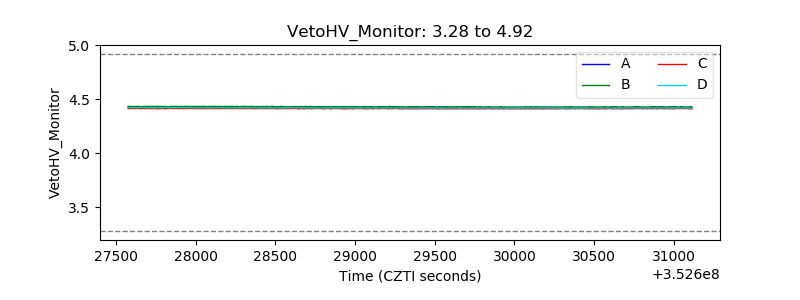 |
| Veto LLD | 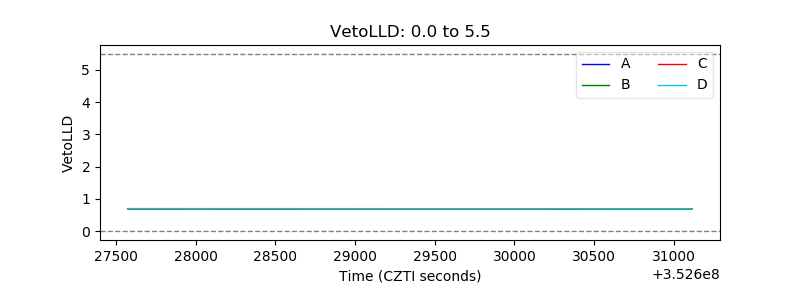 |
| Alpha Counter | 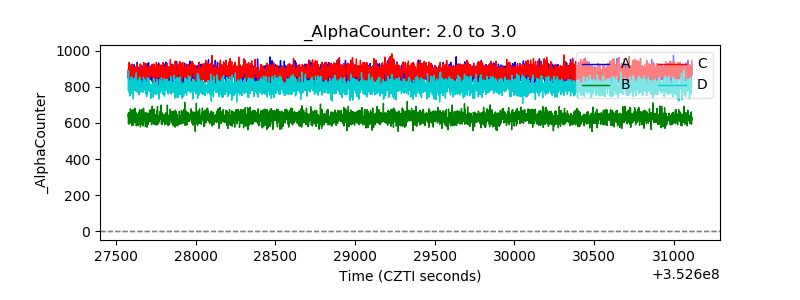 |
| _CPM_Rate | 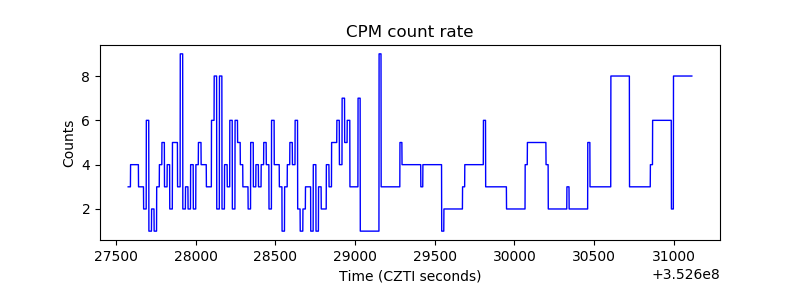 |
| CZT Counter |  |
| +2.5 Volts monitor |  |
| +5 Volts monitor | 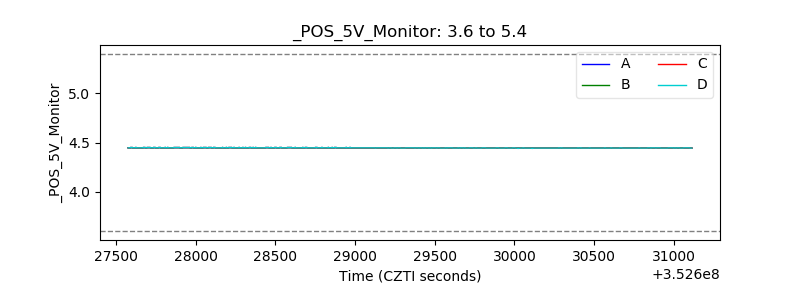 |
| _ROLL_ROT | 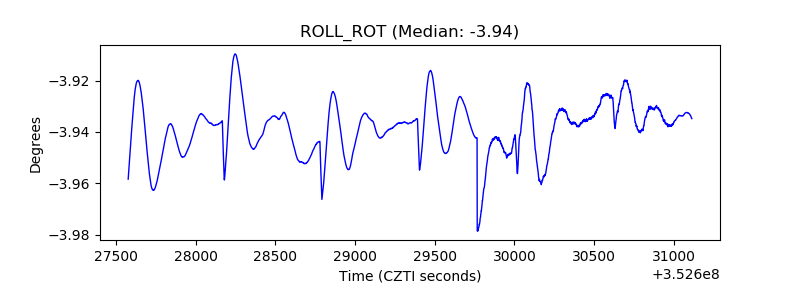 |
| _Roll_DEC | 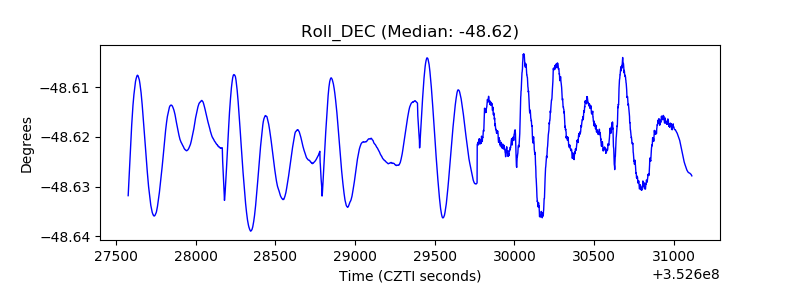 |
| _Roll_RA |  |
| Veto Counter | 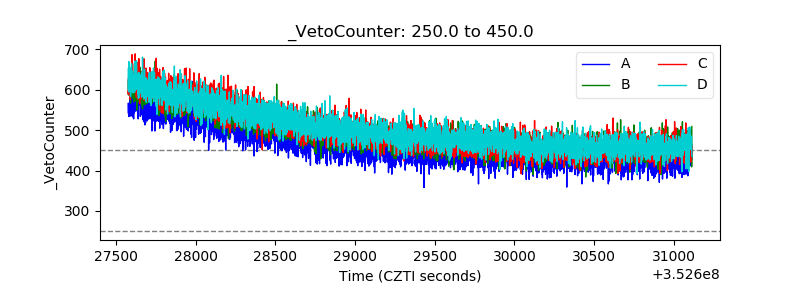 |