| Param | Original file | Final file |
|---|---|---|
| Filename | modeM0/AS1T03_281T01_9000004224_29385cztM0_level2.evt | modeM0/AS1T03_281T01_9000004224_29385cztM0_level2_quad_clean.evt |
| Size (bytes) | 171,734,400 | 42,462,720 |
| Size | 163.8 MB | 40.5 MB |
| Events in quadrant A | 1,061,412 | 298,608 |
| Events in quadrant B | 1,144,064 | 301,068 |
| Events in quadrant C | 1,125,914 | 284,152 |
| Events in quadrant D | 1,742,015 | 267,135 |
| Mode M9 | |||
|---|---|---|---|
| Quadrant | BADHDUFLAG | Total packets | Discarded packets |
| A | 0 | 12 | 0 |
| B | 0 | 12 | 0 |
| C | 0 | 12 | 0 |
| D | 0 | 12 | 0 |
| Mode SS | |||
|---|---|---|---|
| Quadrant | BADHDUFLAG | Total packets | Discarded packets |
| A | 0 | 40 | 0 |
| B | 0 | 40 | 0 |
| C | 0 | 40 | 0 |
| D | 0 | 40 | 0 |
| Mode M0 | |||
|---|---|---|---|
| Quadrant | BADHDUFLAG | Total packets | Discarded packets |
| A | 0 | 4179 | 1 |
| B | 0 | 4514 | 1 |
| C | 0 | 4500 | 1 |
| D | 0 | 6479 | 1 |
| Quadrant | Total seconds | Saturated seconds | Saturation percentage |
|---|---|---|---|
| A | 1840 | 69 | 3.750000% |
| B | 1840 | 84 | 4.565217% |
| C | 1840 | 139 | 7.554348% |
| D | 1840 | 208 | 11.304348% |
Noise dominated data is calculated using 1-second bins in cleaned event files. If a bin has >2000 counts, and if more than 50% of those come from <1% of pixels, then it is considered to be noise-dominated and hence unusable.
| Quadrant | # 1 sec bins | Bins with >0 counts | Bins with >2000 counts | High rate bins dominated by noise | Noise dominated (total time) | Noise dominated (detector-on time) | Marked lightcurve |
|---|---|---|---|---|---|---|---|
| A | 3090 | 1841 | 0 | 0 | 0.00% | 0.00% | 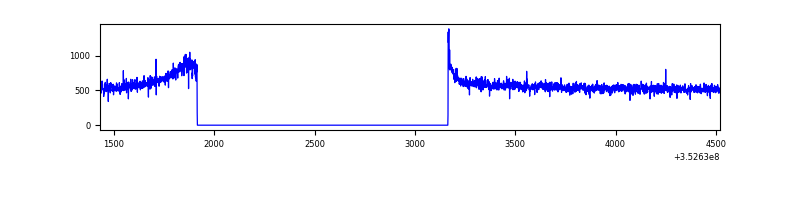 |
| B | 3090 | 1841 | 5 | 5 | 0.16% | 0.27% | 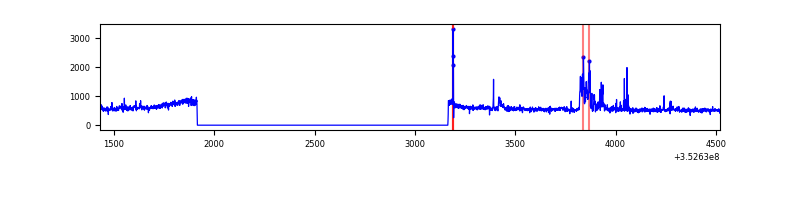 |
| C | 3090 | 1840 | 0 | 0 | 0.00% | 0.00% | 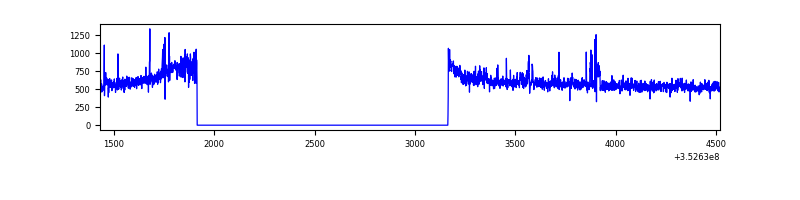 |
| D | 3090 | 1841 | 100 | 100 | 3.24% | 5.43% | 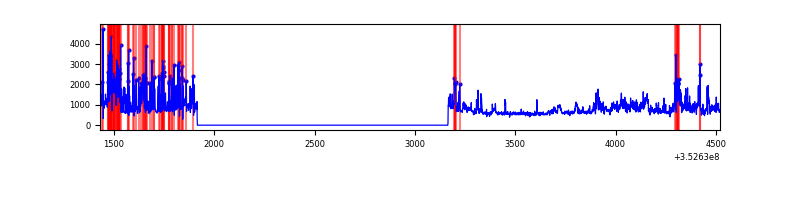 |
Top three noisy pixels from each quadrant. If the there are fewer than three noisy pixels in the level2.evt file, extra rows are filled as -1
| Pixel properties | Quadrant properties | ||||||
|---|---|---|---|---|---|---|---|
| Quadrant | DetID | PixID | Counts | Sigma | Mean | Median | Sigma |
| A | 8 | 192 | 4817 | 80.62 | 274 | 268 | 56.4 |
| A | 13 | 254 | 3573 | 58.57 | 274 | 268 | 56.4 |
| A | 3 | 137 | 2450 | 38.67 | 274 | 268 | 56.4 |
| B | 0 | 229 | 92297 | 1762.84 | 267 | 261 | 52.2 |
| B | 12 | 111 | 5941 | 108.79 | 267 | 261 | 52.2 |
| B | 11 | 111 | 5405 | 98.53 | 267 | 261 | 52.2 |
| C | 14 | 238 | 55355 | 874.98 | 263 | 265 | 63.0 |
| C | 14 | 254 | 19053 | 298.4 | 263 | 265 | 63.0 |
| C | 3 | 233 | 13009 | 202.41 | 263 | 265 | 63.0 |
| D | 7 | 80 | 299774 | 4707.88 | 260 | 254 | 63.6 |
| D | 1 | 52 | 214233 | 3363.34 | 260 | 254 | 63.6 |
| D | 12 | 33 | 170028 | 2668.52 | 260 | 254 | 63.6 |
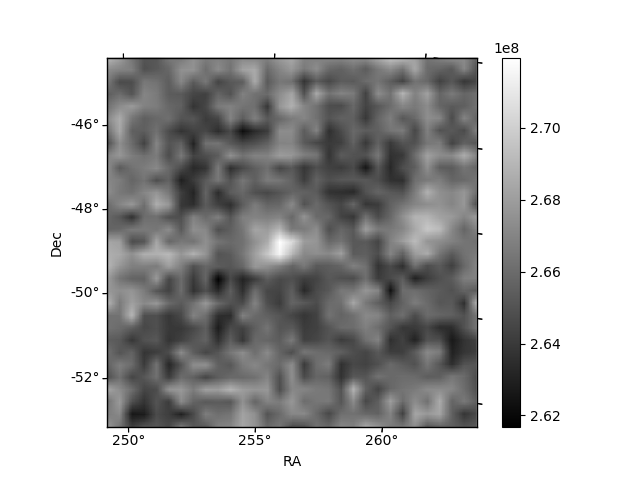
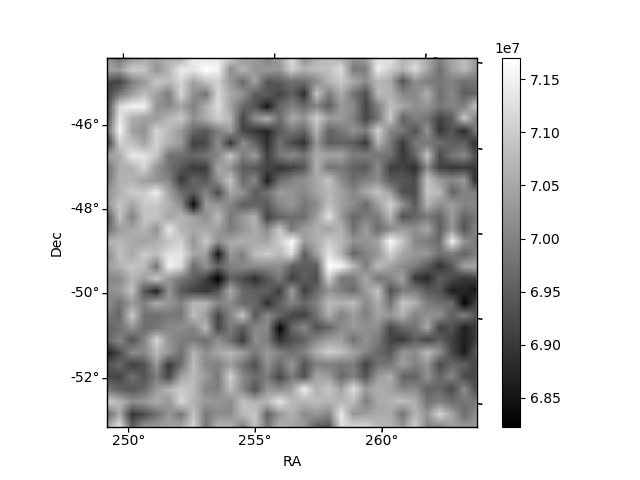
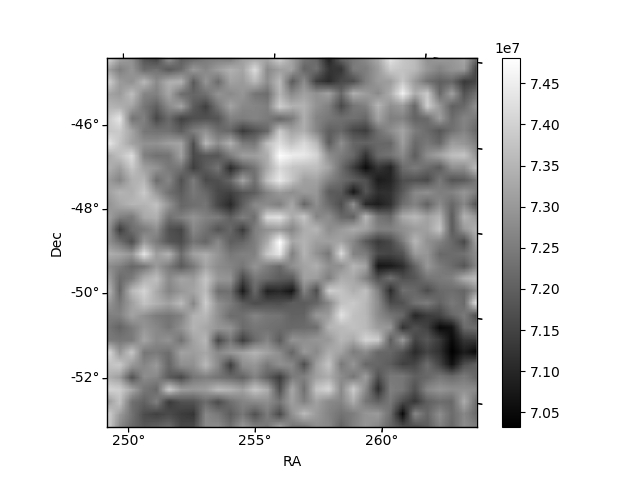
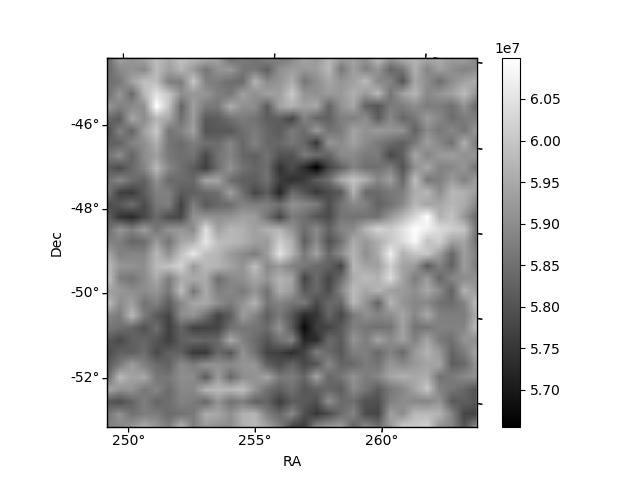
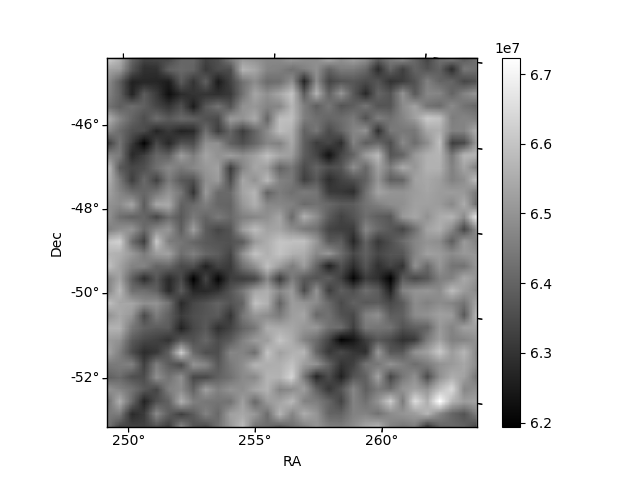
Histogram calculated using DETX and DETY for each event in the final _common_clean file
| Quadrant A | 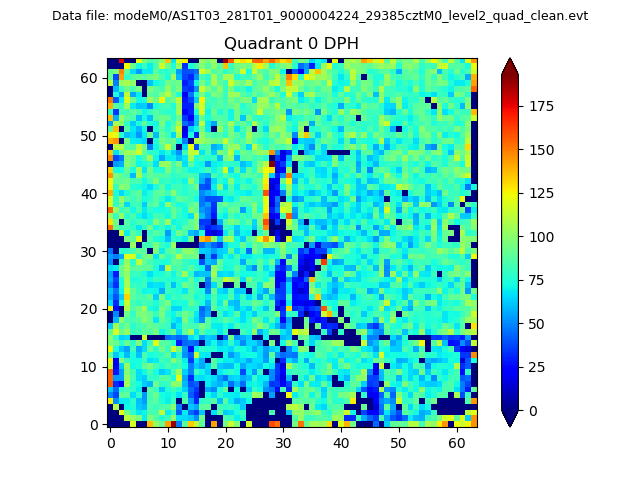 |
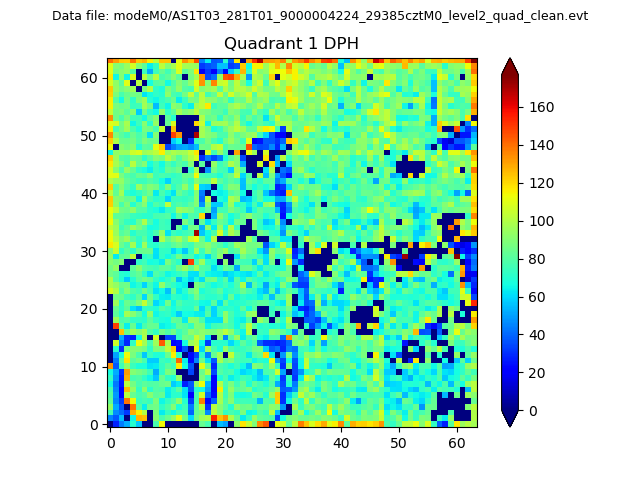 |
Quadrant B |
|---|---|---|---|
| Quadrant D | 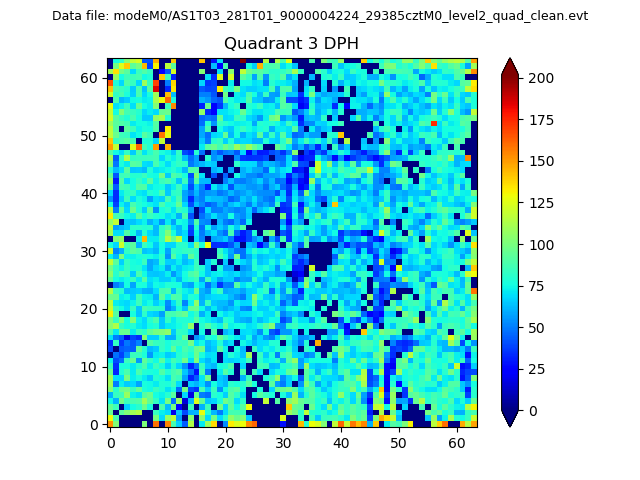 |
 |
Quadrant C |
| Plot type | Count rate plots | Images |
|---|---|---|
| Comparison with Poisson distribution Blue bars denote a histogram of data divided into 1 sec bins. Red curve is a Poisson curve with rate = median count rate of data. |
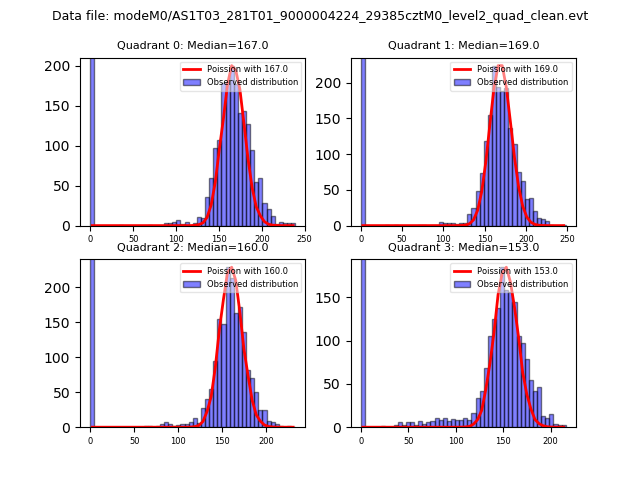 |
 |
| Quadrant-wise count rates Data is divided into 100 sec bins |
 |
|
| Module-wise count rates for Quadrant A Data is divided into 100 sec bins |
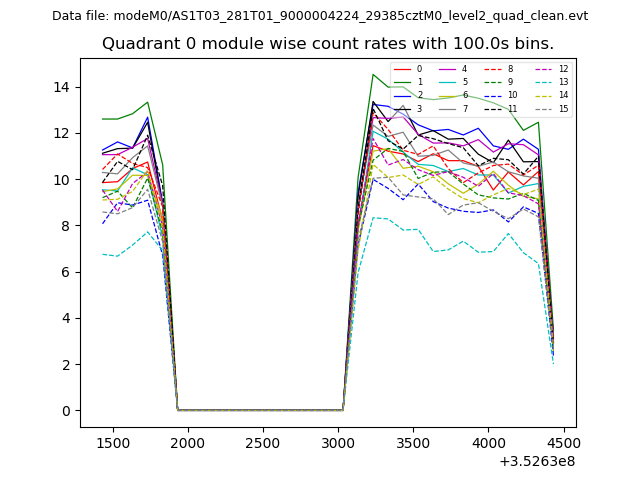 |
 |
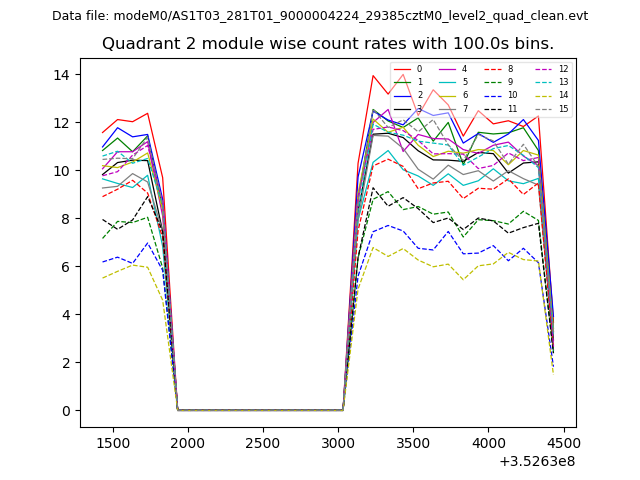
| Module-wise count rates for Quadrant B Data is divided into 100 sec bins |
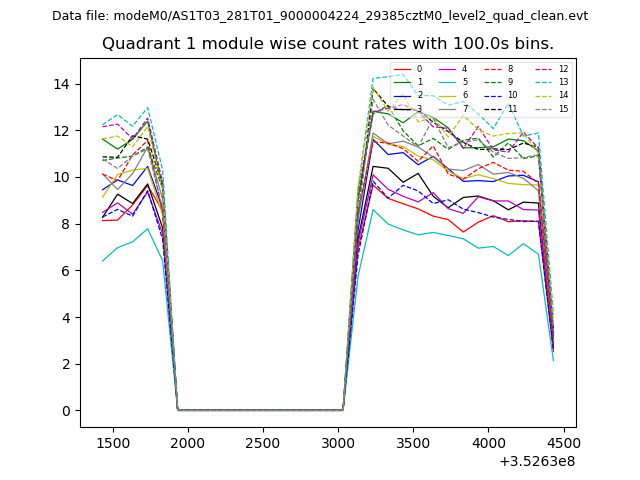 |
 |
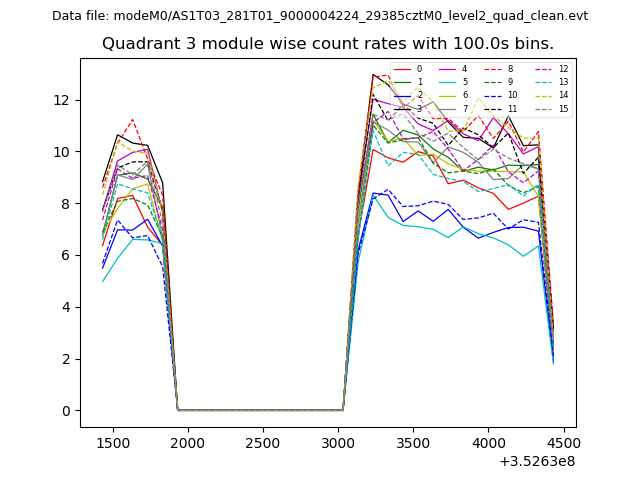
| Module-wise count rates for Quadrant C Data is divided into 100 sec bins |
 |
 |
| Module-wise count rates for Quadrant D Data is divided into 100 sec bins |
 |
 |
| Parameter | Plot |
|---|---|
| CZT HV Monitor | 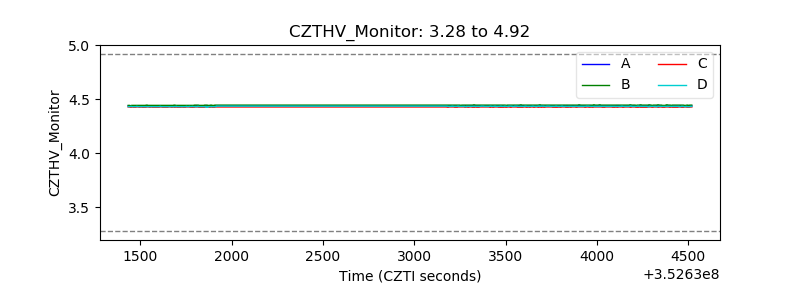 |
| D_VDD | 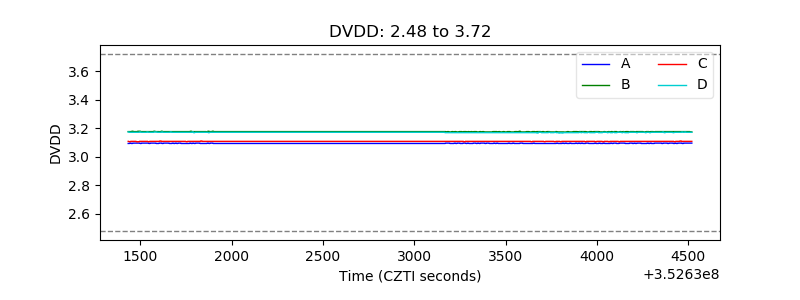 |
| Temperature 1 | 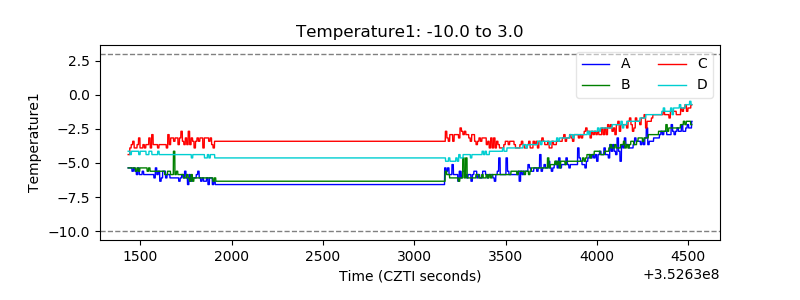 |
| Veto HV Monitor |  |
| Veto LLD | 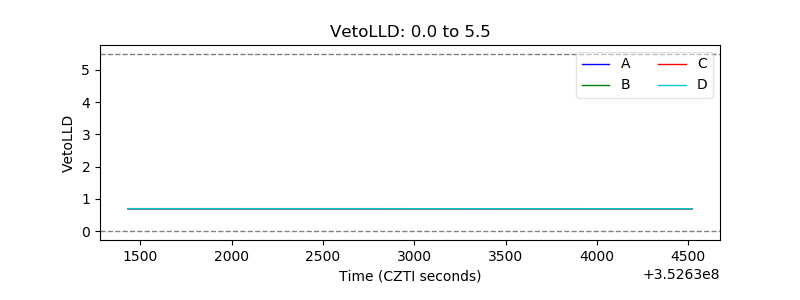 |
| Alpha Counter | 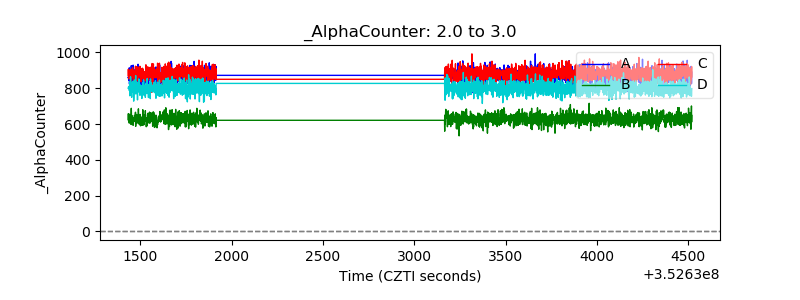 |
| _CPM_Rate | 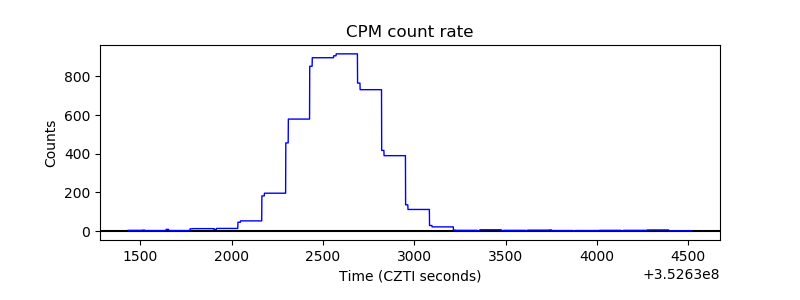 |
| CZT Counter | 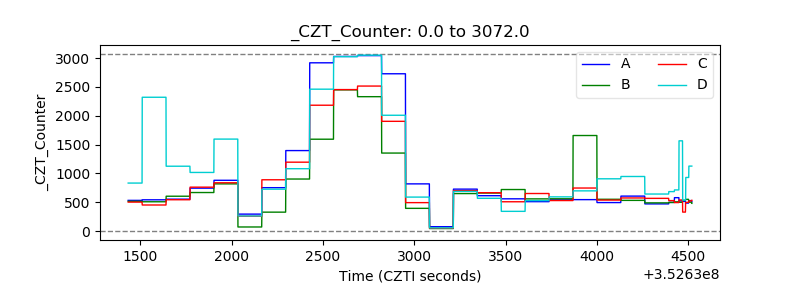 |
| +2.5 Volts monitor |  |
| +5 Volts monitor | 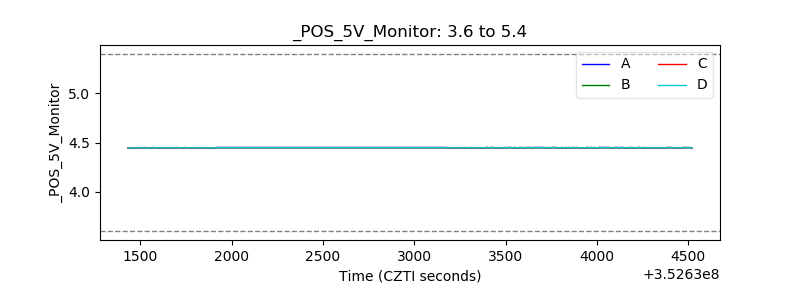 |
| _ROLL_ROT | 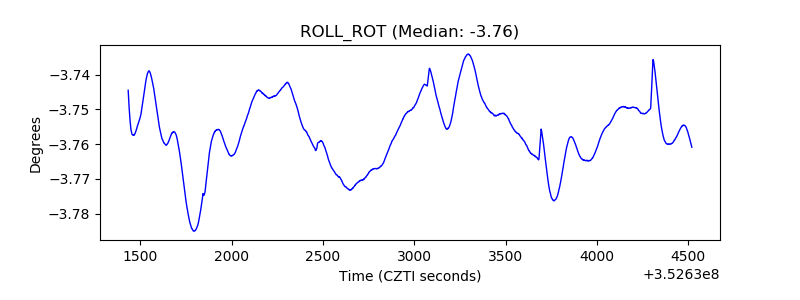 |
| _Roll_DEC | 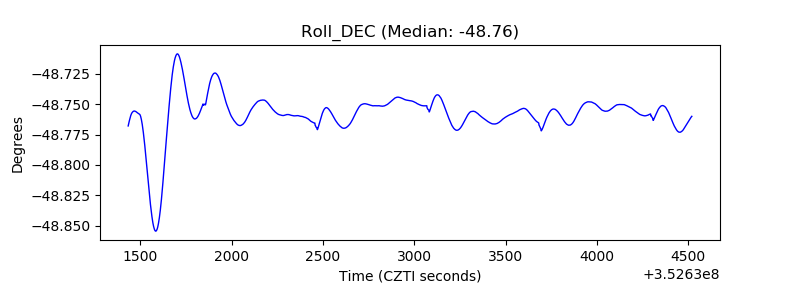 |
| _Roll_RA | 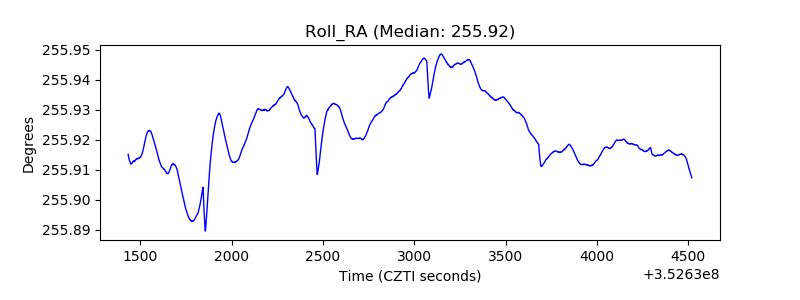 |
| Veto Counter | 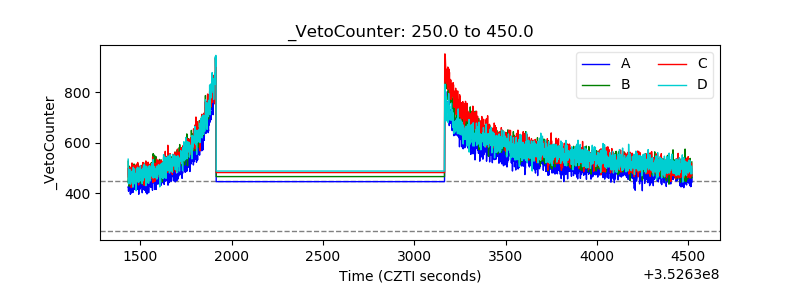 |