| Param | Original file | Final file |
|---|---|---|
| Filename | modeM0/AS1T03_281T01_9000004224_29386cztM0_level2.evt | modeM0/AS1T03_281T01_9000004224_29386cztM0_level2_quad_clean.evt |
| Size (bytes) | 324,665,280 | 33,779,520 |
| Size | 309.6 MB | 32.2 MB |
| Events in quadrant A | 1,621,482 | 205,806 |
| Events in quadrant B | 1,751,932 | 206,387 |
| Events in quadrant C | 1,791,265 | 197,984 |
| Events in quadrant D | 4,440,178 | 175,094 |
| Mode SS | |||
|---|---|---|---|
| Quadrant | BADHDUFLAG | Total packets | Discarded packets |
| A | 0 | 66 | 0 |
| B | 0 | 66 | 0 |
| C | 0 | 66 | 0 |
| D | 0 | 66 | 0 |
| Mode M0 | |||
|---|---|---|---|
| Quadrant | BADHDUFLAG | Total packets | Discarded packets |
| A | 0 | 6730 | 0 |
| B | 0 | 7123 | 0 |
| C | 0 | 7150 | 0 |
| D | 0 | 15553 | 0 |
| Quadrant | Total seconds | Saturated seconds | Saturation percentage |
|---|---|---|---|
| A | 3340 | 4 | 0.119760% |
| B | 3341 | 5 | 0.149656% |
| C | 3341 | 96 | 2.873391% |
| D | 3341 | 686 | 20.532775% |
Noise dominated data is calculated using 1-second bins in cleaned event files. If a bin has >2000 counts, and if more than 50% of those come from <1% of pixels, then it is considered to be noise-dominated and hence unusable.
| Quadrant | # 1 sec bins | Bins with >0 counts | Bins with >2000 counts | High rate bins dominated by noise | Noise dominated (total time) | Noise dominated (detector-on time) | Marked lightcurve |
|---|---|---|---|---|---|---|---|
| A | 3340 | 3340 | 0 | 0 | 0.00% | 0.00% |  |
| B | 3341 | 3341 | 5 | 5 | 0.15% | 0.15% |  |
| C | 3341 | 3341 | 1 | 1 | 0.03% | 0.03% | 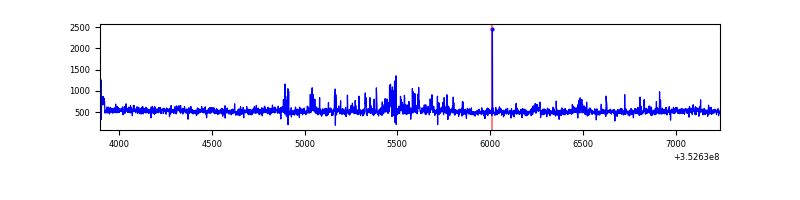 |
| D | 3341 | 3341 | 591 | 591 | 17.69% | 17.69% | 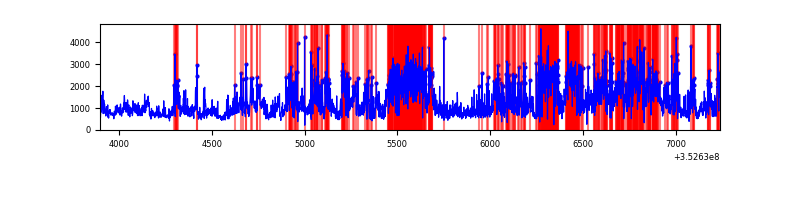 |
Top three noisy pixels from each quadrant. If the there are fewer than three noisy pixels in the level2.evt file, extra rows are filled as -1
| Pixel properties | Quadrant properties | ||||||
|---|---|---|---|---|---|---|---|
| Quadrant | DetID | PixID | Counts | Sigma | Mean | Median | Sigma |
| A | 13 | 254 | 7269 | 81.25 | 419 | 412 | 84.4 |
| A | 3 | 137 | 3705 | 39.02 | 419 | 412 | 84.4 |
| A | 0 | 226 | 3661 | 38.5 | 419 | 412 | 84.4 |
| B | 0 | 229 | 57984 | 738.18 | 411 | 402 | 78.0 |
| B | 5 | 255 | 33619 | 425.83 | 411 | 402 | 78.0 |
| B | 15 | 32 | 12183 | 151.03 | 411 | 402 | 78.0 |
| C | 14 | 238 | 99397 | 1068.42 | 395 | 398 | 92.7 |
| C | 3 | 233 | 73771 | 791.85 | 395 | 398 | 92.7 |
| C | 14 | 254 | 48404 | 518.09 | 395 | 398 | 92.7 |
| D | 1 | 52 | 1697846 | 19131.91 | 372 | 362 | 88.7 |
| D | 12 | 33 | 955405 | 10764.04 | 372 | 362 | 88.7 |
| D | 8 | 195 | 151133 | 1699.3 | 372 | 362 | 88.7 |
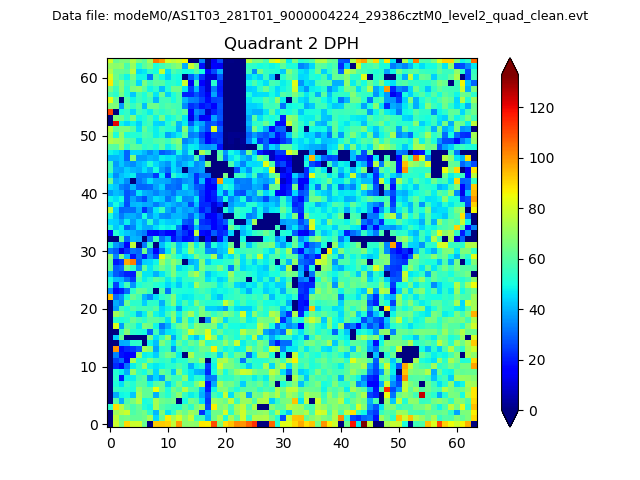
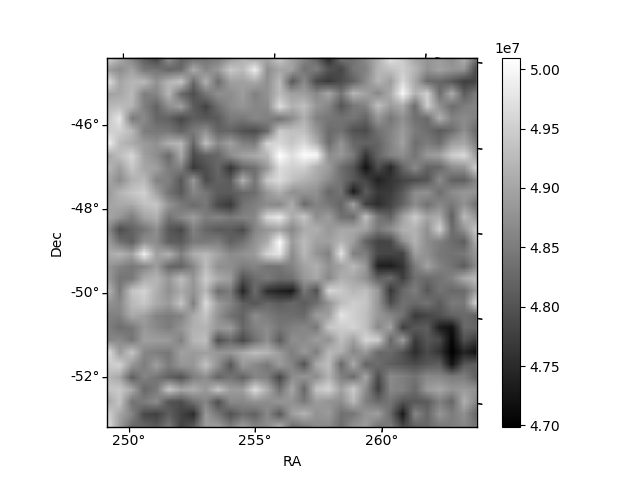
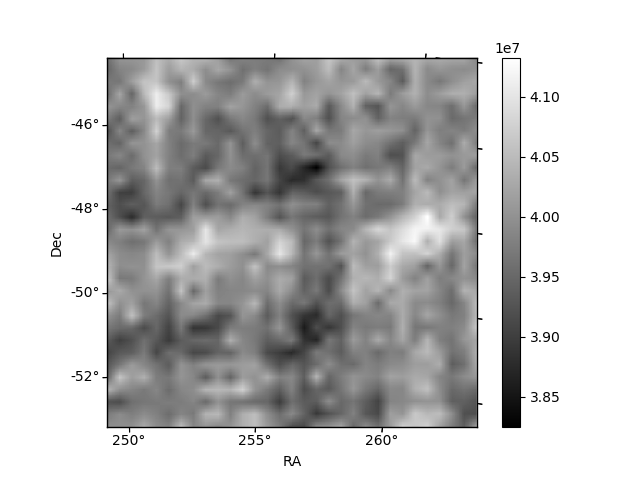
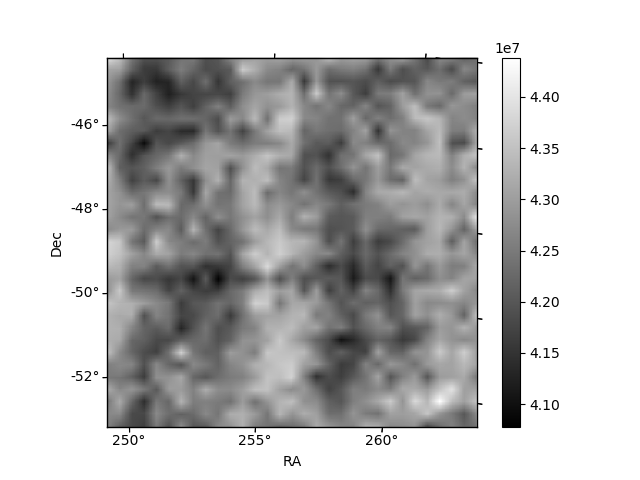
Histogram calculated using DETX and DETY for each event in the final _common_clean file
| Quadrant A | 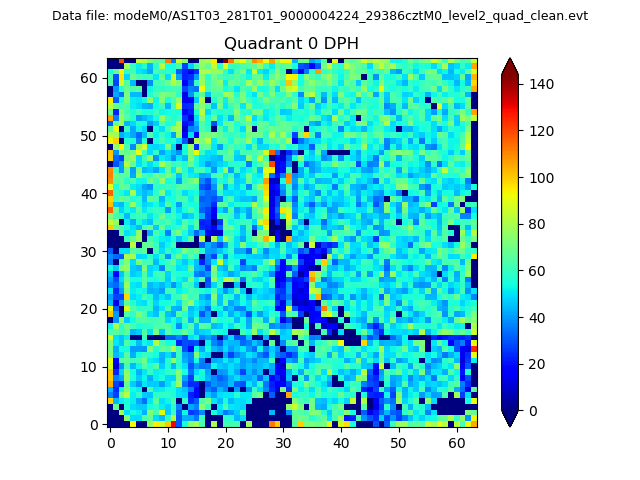 |
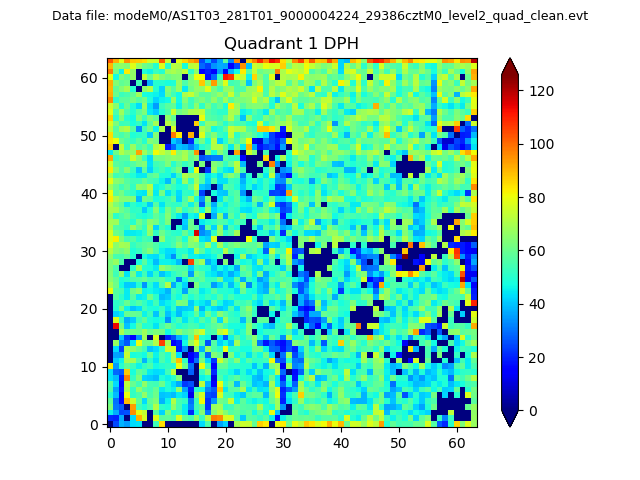 |
Quadrant B |
|---|---|---|---|
| Quadrant D | 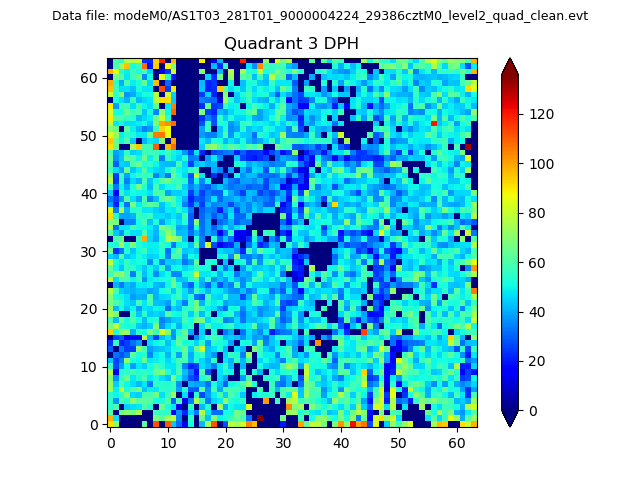 |
 |
Quadrant C |
| Plot type | Count rate plots | Images |
|---|---|---|
| Comparison with Poisson distribution Blue bars denote a histogram of data divided into 1 sec bins. Red curve is a Poisson curve with rate = median count rate of data. |
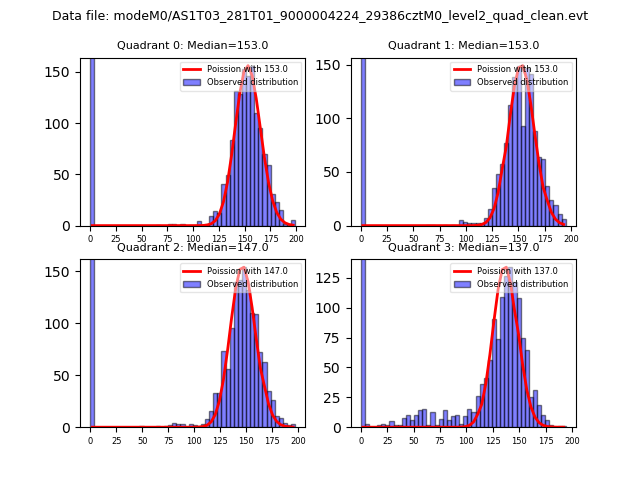 |
 |
| Quadrant-wise count rates Data is divided into 100 sec bins |
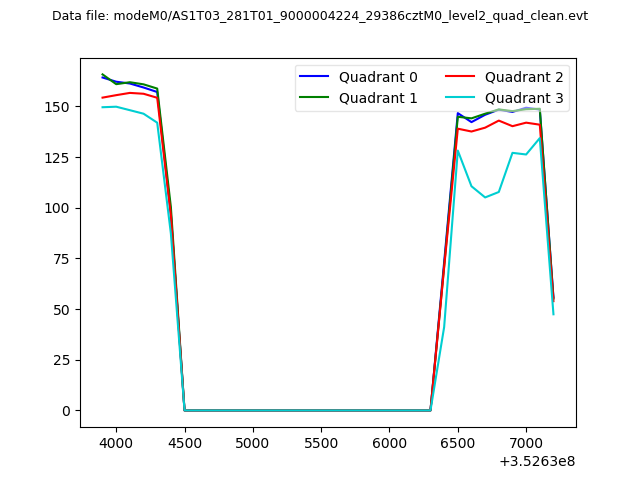 |
|
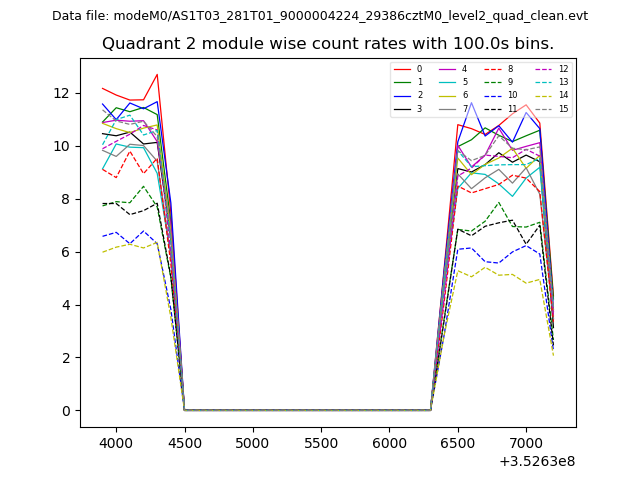
| Module-wise count rates for Quadrant A Data is divided into 100 sec bins |
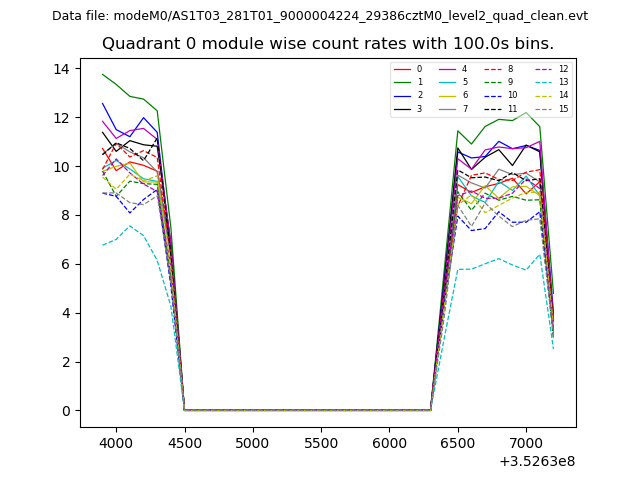 |
 |
| Module-wise count rates for Quadrant B Data is divided into 100 sec bins |
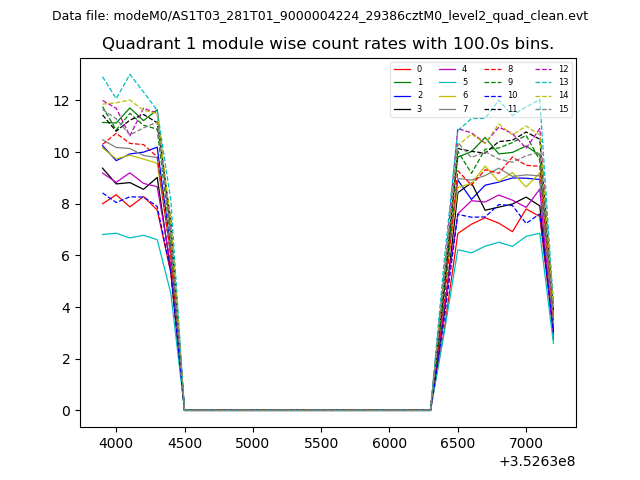 |
 |
| Module-wise count rates for Quadrant C Data is divided into 100 sec bins |
 |
 |
| Module-wise count rates for Quadrant D Data is divided into 100 sec bins |
 |
 |
| Parameter | Plot |
|---|---|
| CZT HV Monitor | 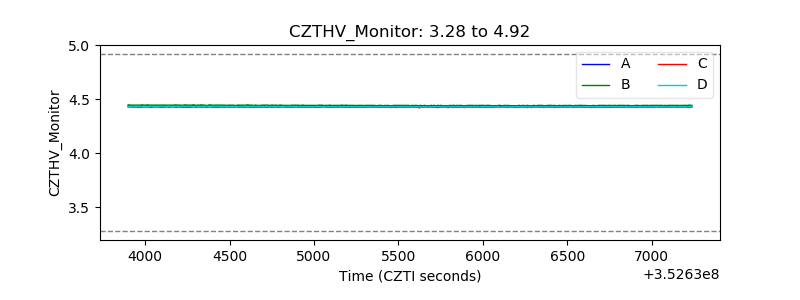 |
| D_VDD | 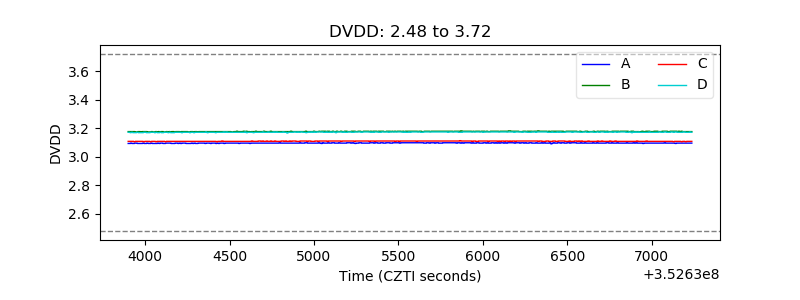 |
| Temperature 1 | 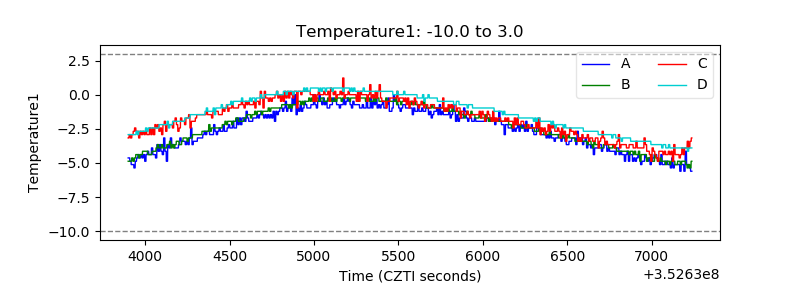 |
| Veto HV Monitor | 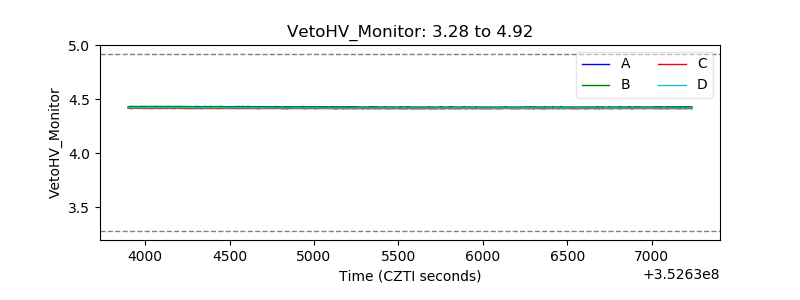 |
| Veto LLD | 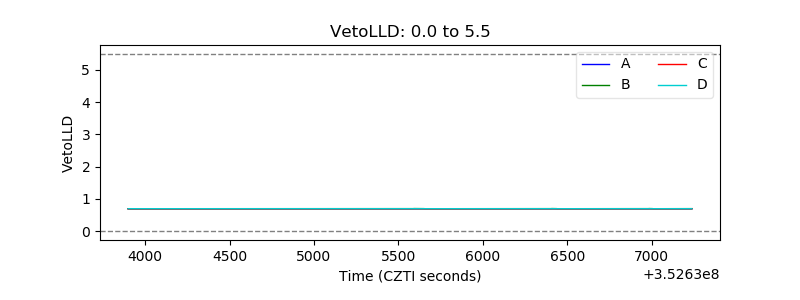 |
| Alpha Counter | 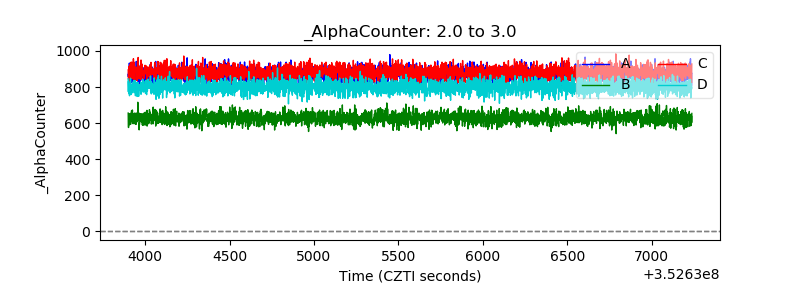 |
| _CPM_Rate | 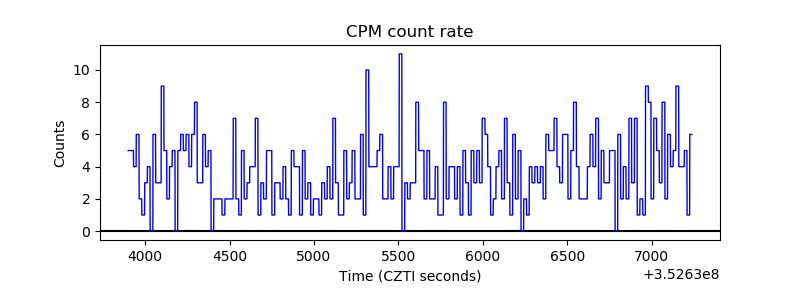 |
| CZT Counter | 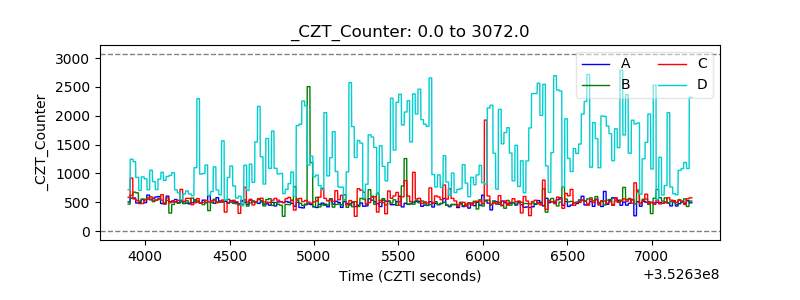 |
| +2.5 Volts monitor | 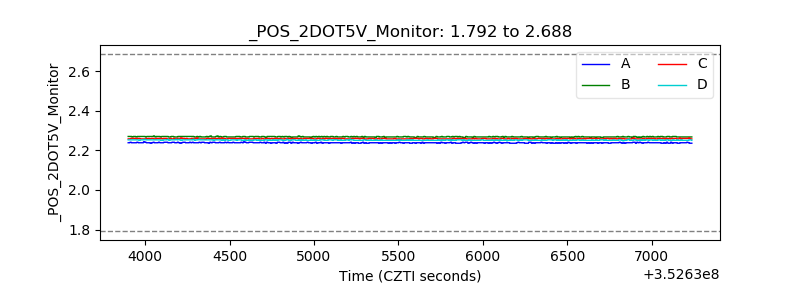 |
| +5 Volts monitor | 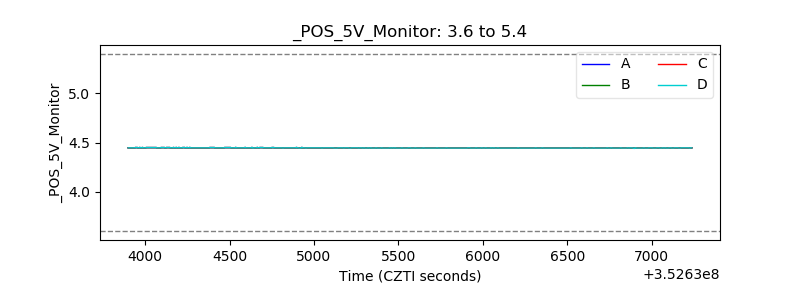 |
| _ROLL_ROT | 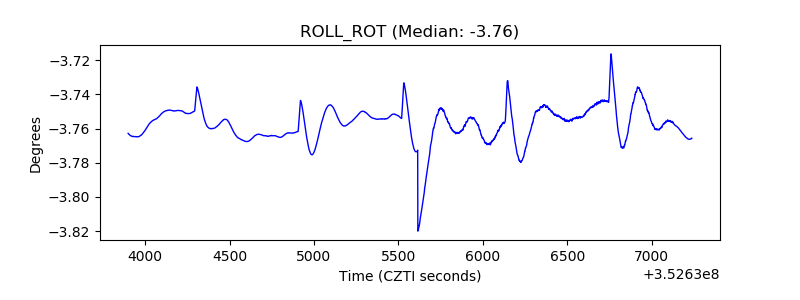 |
| _Roll_DEC | 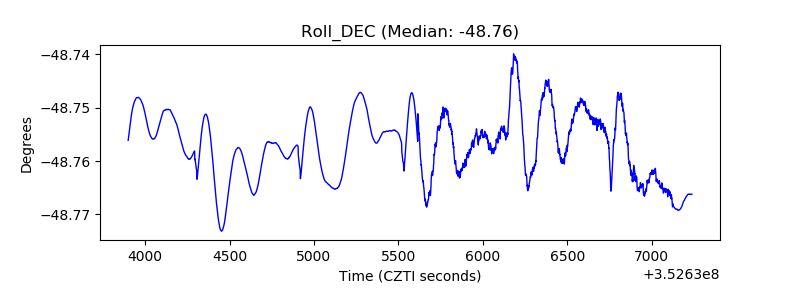 |
| _Roll_RA | 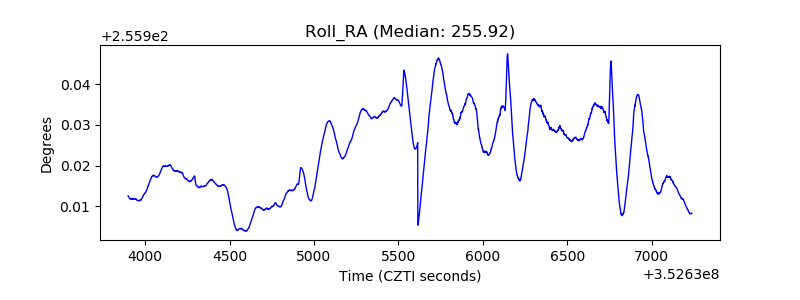 |
| Veto Counter | 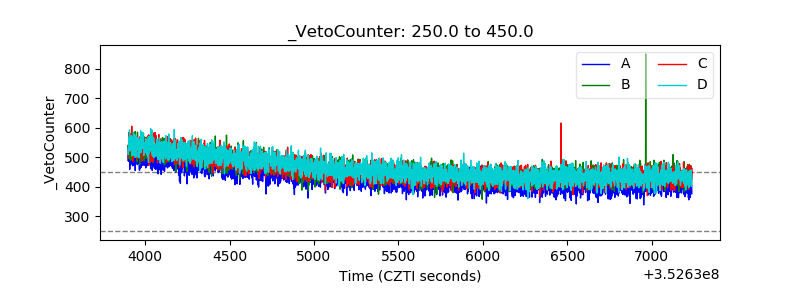 |