| Param | Original file | Final file |
|---|---|---|
| Filename | modeM0/AS1T03_282T01_9000004226cztM0_level2.fits | modeM0/AS1T03_282T01_9000004226cztM0_level2_quad_clean.evt |
| Size (bytes) | 45,247,680 | 26,752,320 |
| Size | 43.2 MB | 25.5 MB |
| Events in quadrant A | 286,884 | 136,898 |
| Events in quadrant B | 274,636 | 137,528 |
| Events in quadrant C | 270,554 | 123,315 |
| Events in quadrant D | 217,608 | 91,081 |
| Mode SS | |||
|---|---|---|---|
| Quadrant | BADHDUFLAG | Total packets | Discarded packets |
| A | 0 | 92 | 0 |
| B | 0 | 92 | 0 |
| C | 0 | 92 | 0 |
| D | 0 | 92 | 0 |
| Mode M9 | |||
|---|---|---|---|
| Quadrant | BADHDUFLAG | Total packets | Discarded packets |
| A | 0 | 11 | 0 |
| B | 0 | 11 | 0 |
| C | 0 | 11 | 0 |
| D | 0 | 11 | 0 |
| Mode M0 | |||
|---|---|---|---|
| Quadrant | BADHDUFLAG | Total packets | Discarded packets |
| A | 0 | 9978 | 0 |
| B | 0 | 9936 | 0 |
| C | 0 | 11577 | 0 |
| D | 0 | 21643 | 0 |
| Quadrant | Total seconds | Saturated seconds | Saturation percentage |
|---|---|---|---|
| A | 4557 | 118 | 2.589423% |
| B | 4557 | 131 | 2.874698% |
| C | 4557 | 441 | 9.677419% |
| D | 4557 | 1218 | 26.728111% |
Noise dominated data is calculated using 1-second bins in cleaned event files. If a bin has >2000 counts, and if more than 50% of those come from <1% of pixels, then it is considered to be noise-dominated and hence unusable.
| Quadrant | # 1 sec bins | Bins with >0 counts | Bins with >2000 counts | High rate bins dominated by noise | Noise dominated (total time) | Noise dominated (detector-on time) | Marked lightcurve |
|---|---|---|---|---|---|---|---|
| A | 5582 | 4557 | 0 | 0 | 0.00% | 0.00% |  |
| B | 5582 | 4557 | 0 | 0 | 0.00% | 0.00% | 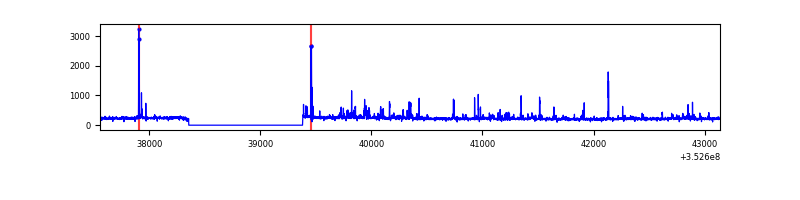 |
| C | 5582 | 4557 | 0 | 0 | 0.00% | 0.00% |  |
| D | 5582 | 4544 | 0 | 0 | 0.00% | 0.00% |  |
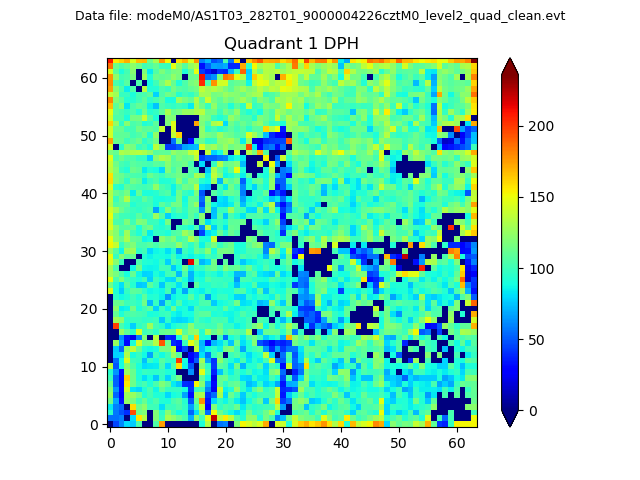
Top three noisy pixels from each quadrant. If the there are fewer than three noisy pixels in the level2.evt file, extra rows are filled as -1
| Pixel properties | Quadrant properties | ||||||
|---|---|---|---|---|---|---|---|
| Quadrant | DetID | PixID | Counts | Sigma | Mean | Median | Sigma |
| A | 0 | 29 | 292 | 11.1 | 74 | 71 | 19.9 |
| A | 7 | 110 | 253 | 9.14 | 74 | 71 | 19.9 |
| A | 14 | 95 | 220 | 7.49 | 74 | 71 | 19.9 |
| B | 2 | 9 | 227 | 9.51 | 72 | 69 | 16.6 |
| B | 5 | 128 | 201 | 7.95 | 72 | 69 | 16.6 |
| B | 2 | 8 | 201 | 7.95 | 72 | 69 | 16.6 |
| C | 1 | 80 | 217 | 7.63 | 71 | 67 | 19.7 |
| C | 1 | 81 | 213 | 7.43 | 71 | 67 | 19.7 |
| C | 3 | 187 | 201 | 6.82 | 71 | 67 | 19.7 |
| D | 10 | 113 | 165 | 5.91 | 62 | 56 | 18.5 |
| D | 4 | 246 | 162 | 5.74 | 62 | 56 | 18.5 |
| D | 10 | 189 | 161 | 5.69 | 62 | 56 | 18.5 |
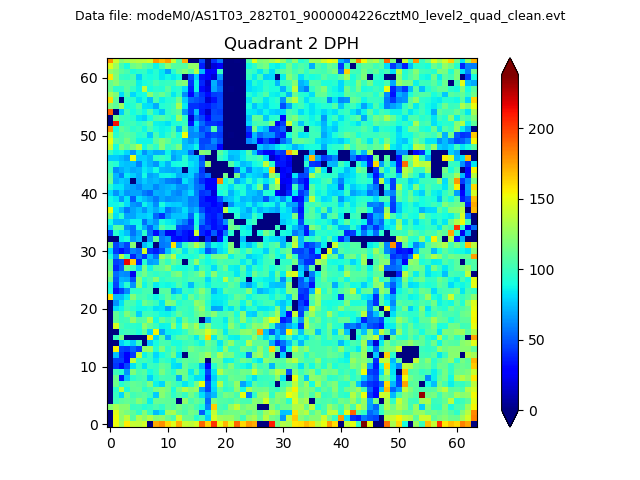
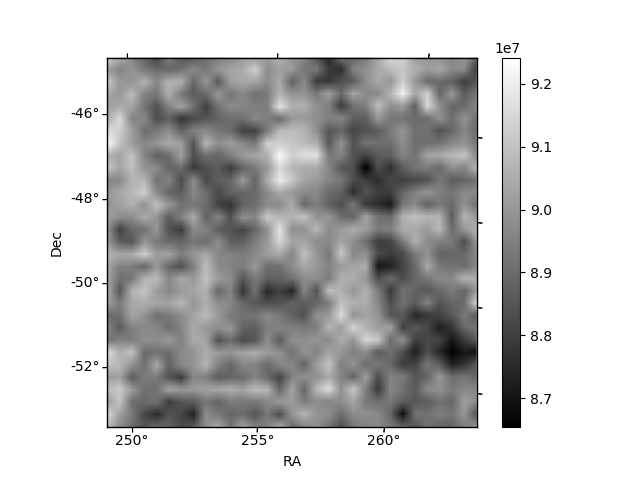
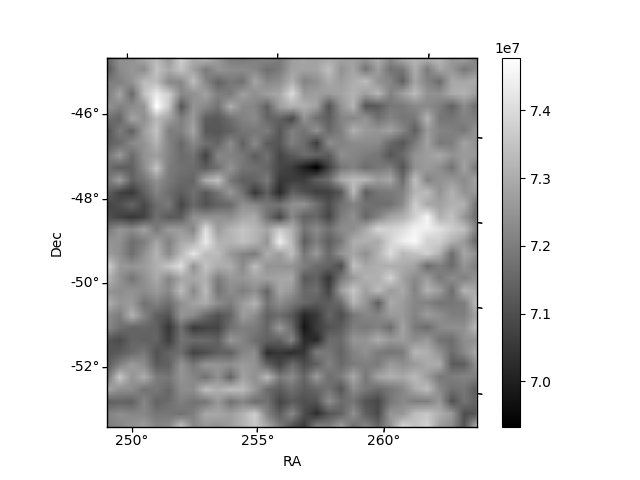
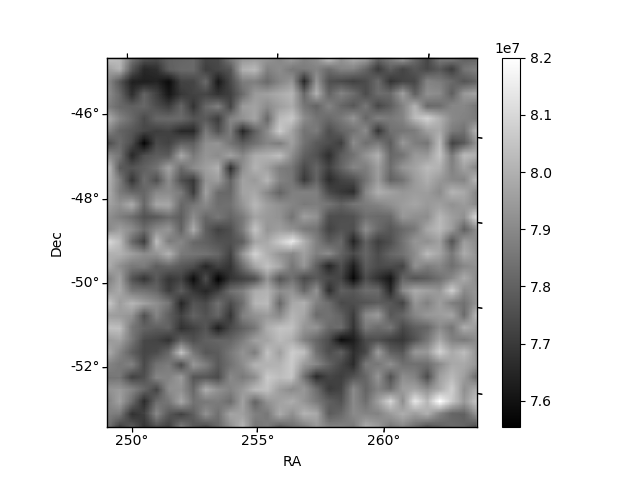
Histogram calculated using DETX and DETY for each event in the final _common_clean file
| Quadrant A | 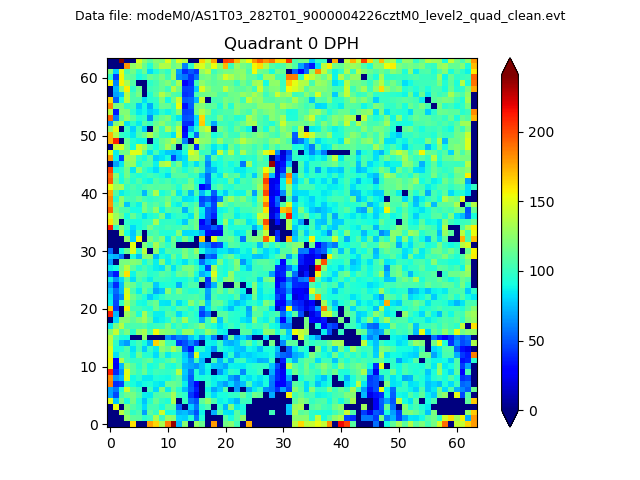 |
 |
Quadrant B |
|---|---|---|---|
| Quadrant D | 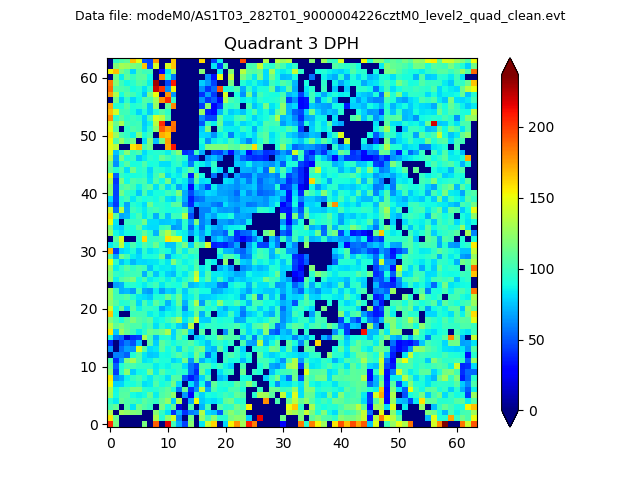 |
 |
Quadrant C |
| Plot type | Count rate plots | Images |
|---|---|---|
| Comparison with Poisson distribution Blue bars denote a histogram of data divided into 1 sec bins. Red curve is a Poisson curve with rate = median count rate of data. |
 |
 |
| Quadrant-wise count rates Data is divided into 100 sec bins |
 |
|
| Module-wise count rates for Quadrant A Data is divided into 100 sec bins |
 |
 |
| Module-wise count rates for Quadrant B Data is divided into 100 sec bins |
 |
 |
| Module-wise count rates for Quadrant C Data is divided into 100 sec bins |
 |
 |
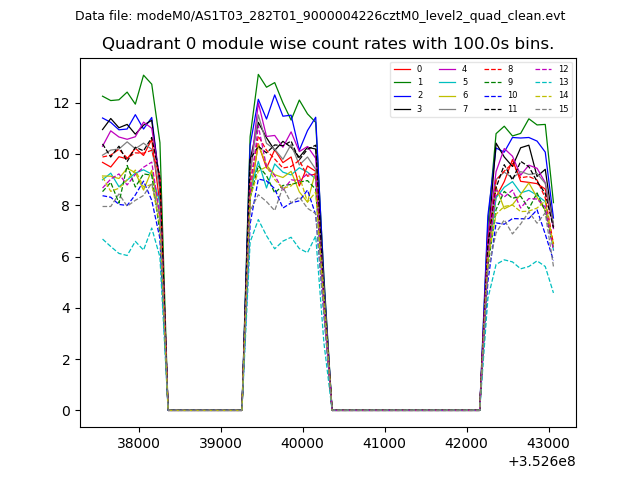
| Module-wise count rates for Quadrant D Data is divided into 100 sec bins |
 |
 |
| Parameter | Plot |
|---|---|
| CZT HV Monitor |  |
| D_VDD | 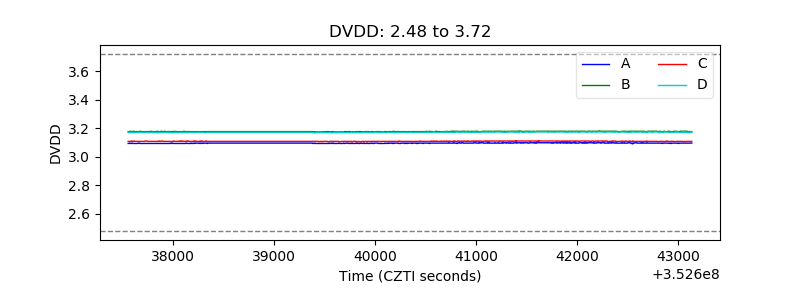 |
| Temperature 1 |  |
| Veto HV Monitor | 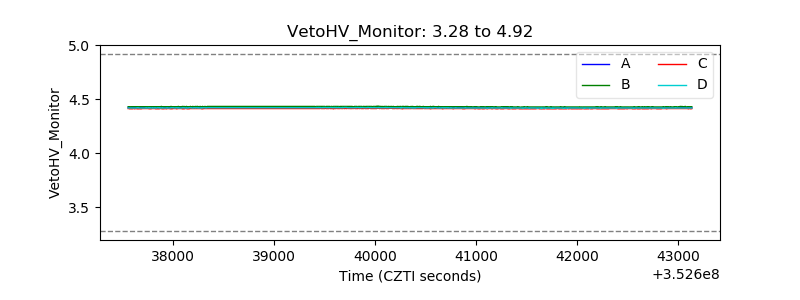 |
| Veto LLD | 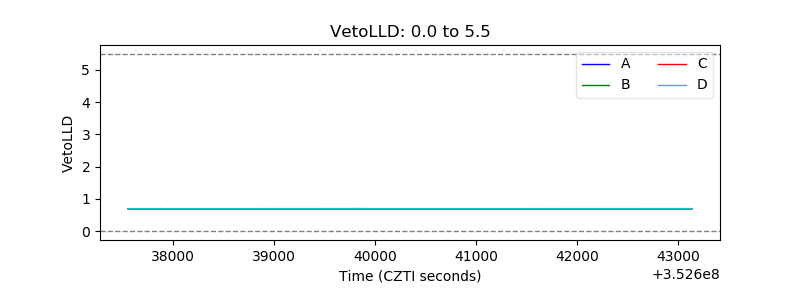 |
| Alpha Counter | 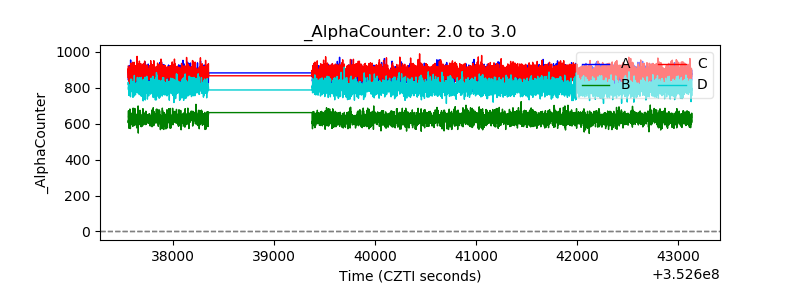 |
| _CPM_Rate | 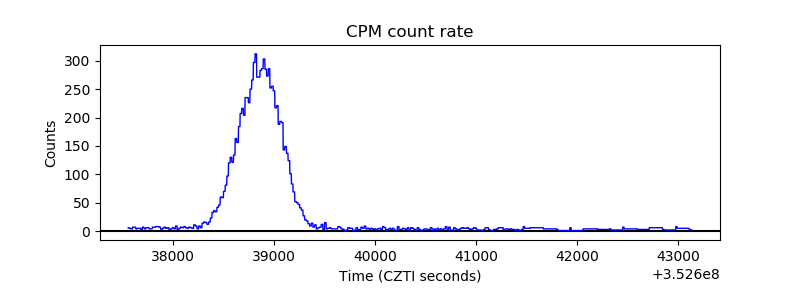 |
| CZT Counter | 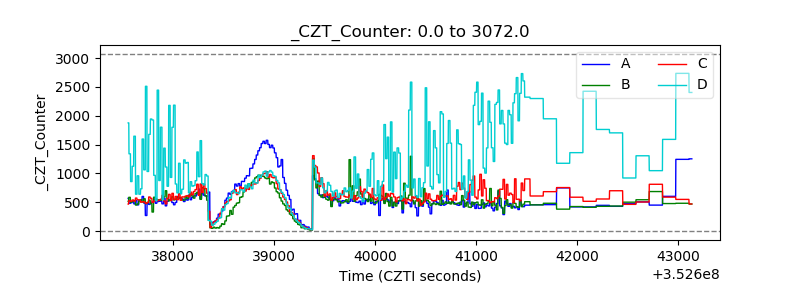 |
| +2.5 Volts monitor |  |
| +5 Volts monitor |  |
| _ROLL_ROT | 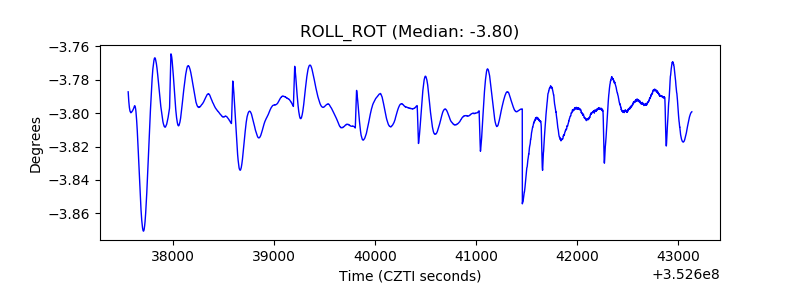 |
| _Roll_DEC | 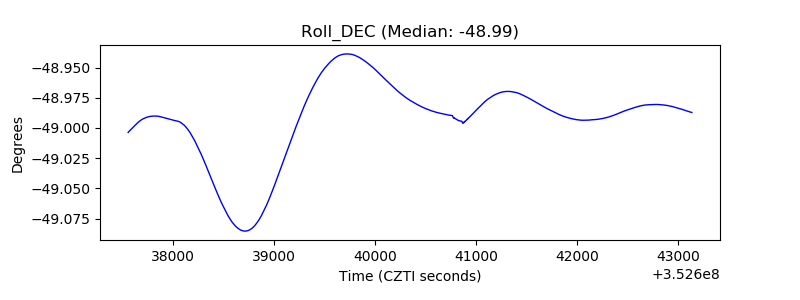 |
| _Roll_RA | 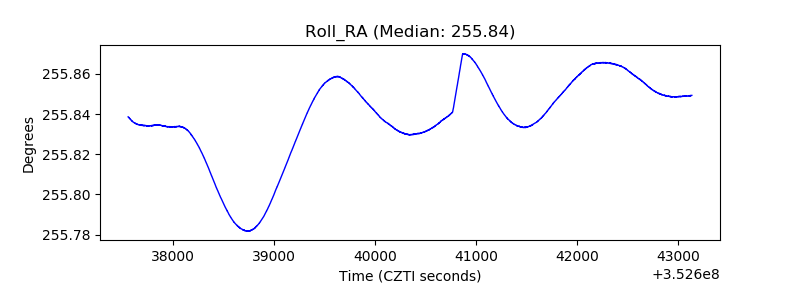 |
| Veto Counter |  |