| Param | Original file | Final file |
|---|---|---|
| Filename | modeM0/AS1T03_282T01_9000004226_29387cztM0_level2.evt | modeM0/AS1T03_282T01_9000004226_29387cztM0_level2_quad_clean.evt |
| Size (bytes) | 366,062,400 | 35,023,680 |
| Size | 349.1 MB | 33.4 MB |
| Events in quadrant A | 1,791,401 | 214,209 |
| Events in quadrant B | 1,758,791 | 218,111 |
| Events in quadrant C | 2,169,065 | 203,016 |
| Events in quadrant D | 5,129,751 | 177,732 |
| Mode SS | |||
|---|---|---|---|
| Quadrant | BADHDUFLAG | Total packets | Discarded packets |
| A | 0 | 70 | 0 |
| B | 0 | 70 | 0 |
| C | 0 | 70 | 0 |
| D | 0 | 70 | 0 |
| Mode M0 | |||
|---|---|---|---|
| Quadrant | BADHDUFLAG | Total packets | Discarded packets |
| A | 0 | 7464 | 0 |
| B | 0 | 7338 | 0 |
| C | 0 | 8779 | 0 |
| D | 0 | 17694 | 0 |
| Quadrant | Total seconds | Saturated seconds | Saturation percentage |
|---|---|---|---|
| A | 3480 | 25 | 0.718391% |
| B | 3481 | 11 | 0.316001% |
| C | 3481 | 315 | 9.049124% |
| D | 3481 | 1045 | 30.020109% |
Noise dominated data is calculated using 1-second bins in cleaned event files. If a bin has >2000 counts, and if more than 50% of those come from <1% of pixels, then it is considered to be noise-dominated and hence unusable.
| Quadrant | # 1 sec bins | Bins with >0 counts | Bins with >2000 counts | High rate bins dominated by noise | Noise dominated (total time) | Noise dominated (detector-on time) | Marked lightcurve |
|---|---|---|---|---|---|---|---|
| A | 3480 | 3480 | 19 | 19 | 0.55% | 0.55% |  |
| B | 3481 | 3481 | 5 | 5 | 0.14% | 0.14% |  |
| C | 3481 | 3481 | 0 | 0 | 0.00% | 0.00% |  |
| D | 3481 | 3481 | 882 | 882 | 25.34% | 25.34% |  |
Top three noisy pixels from each quadrant. If the there are fewer than three noisy pixels in the level2.evt file, extra rows are filled as -1
| Pixel properties | Quadrant properties | ||||||
|---|---|---|---|---|---|---|---|
| Quadrant | DetID | PixID | Counts | Sigma | Mean | Median | Sigma |
| A | 1 | 113 | 145582 | 1716.95 | 422 | 414 | 84.6 |
| A | 15 | 174 | 16054 | 184.98 | 422 | 414 | 84.6 |
| A | 13 | 254 | 7146 | 79.62 | 422 | 414 | 84.6 |
| B | 5 | 255 | 56385 | 715.08 | 416 | 408 | 78.3 |
| B | 0 | 190 | 25247 | 317.31 | 416 | 408 | 78.3 |
| B | 0 | 229 | 12345 | 152.49 | 416 | 408 | 78.3 |
| C | 3 | 233 | 304376 | 3349.09 | 390 | 395 | 90.8 |
| C | 14 | 238 | 167853 | 1844.96 | 390 | 395 | 90.8 |
| C | 14 | 254 | 142575 | 1566.46 | 390 | 395 | 90.8 |
| D | 1 | 52 | 2643861 | 29885.49 | 364 | 355 | 88.5 |
| D | 12 | 227 | 516131 | 5830.97 | 364 | 355 | 88.5 |
| D | 8 | 195 | 177765 | 2005.66 | 364 | 355 | 88.5 |
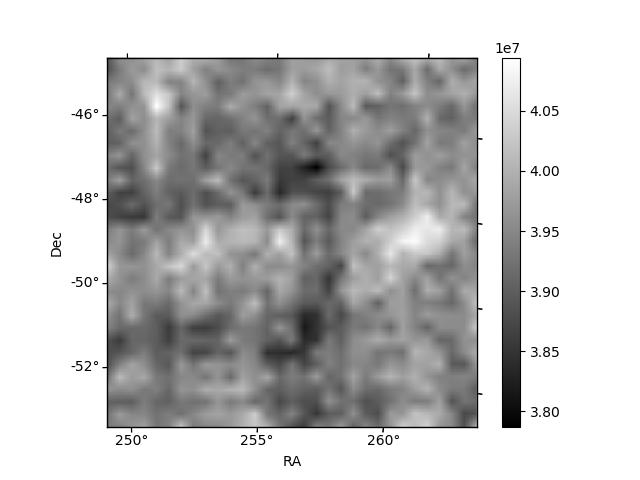
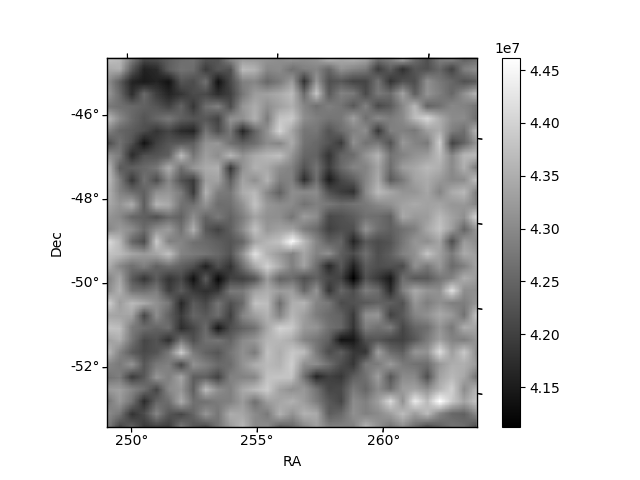
Histogram calculated using DETX and DETY for each event in the final _common_clean file
| Quadrant A | 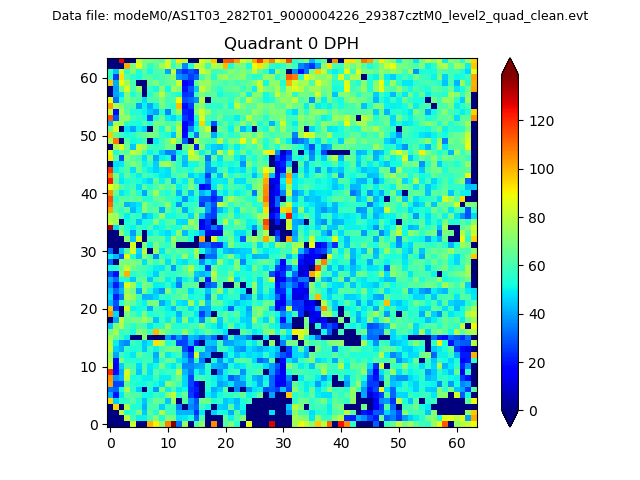 |
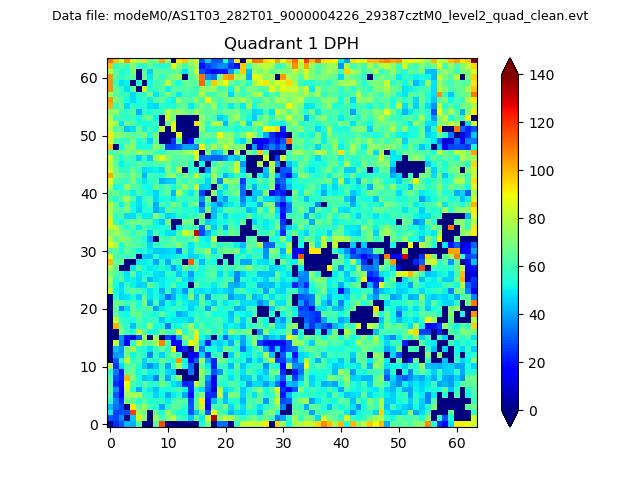 |
Quadrant B |
|---|---|---|---|
| Quadrant D | 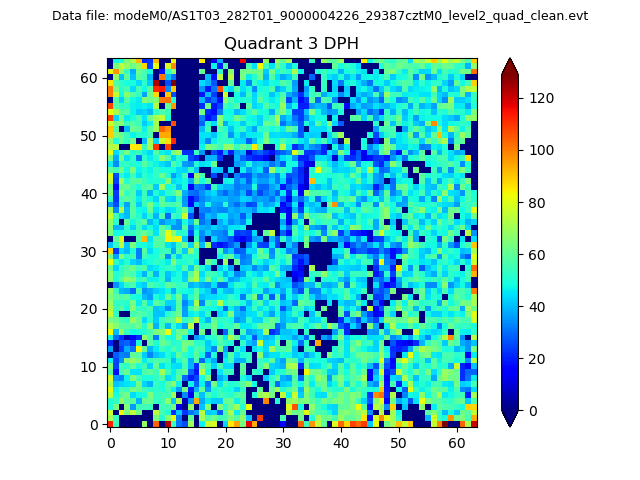 |
 |
Quadrant C |
| Plot type | Count rate plots | Images |
|---|---|---|
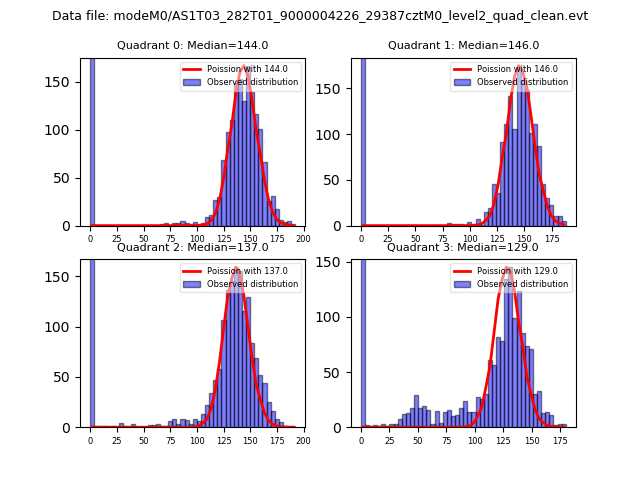
| Comparison with Poisson distribution Blue bars denote a histogram of data divided into 1 sec bins. Red curve is a Poisson curve with rate = median count rate of data. |
 |
 |
| Quadrant-wise count rates Data is divided into 100 sec bins |
 |
|
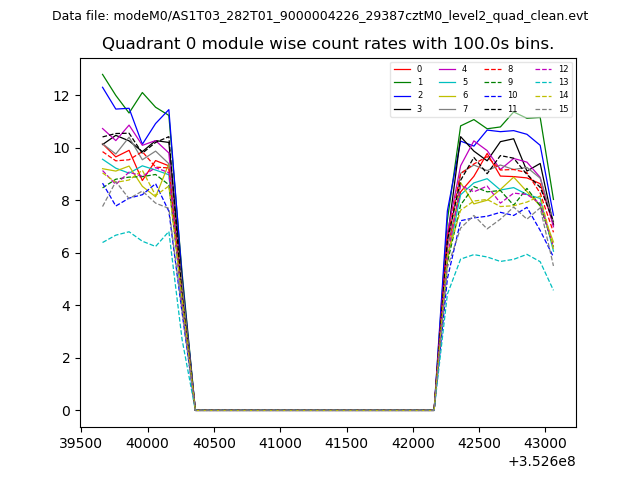
| Module-wise count rates for Quadrant A Data is divided into 100 sec bins |
 |
 |
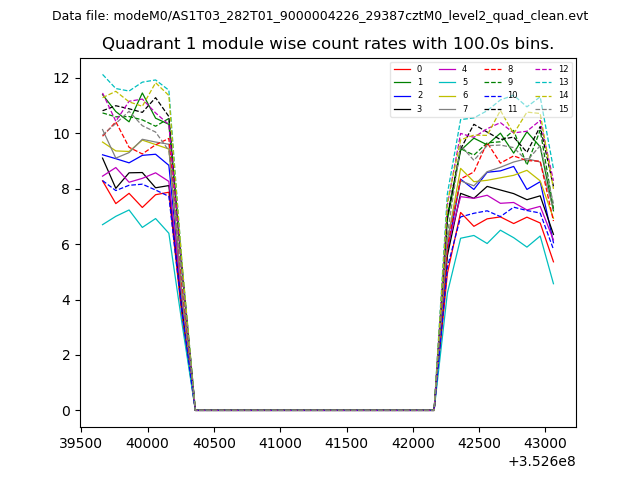
| Module-wise count rates for Quadrant B Data is divided into 100 sec bins |
 |
 |
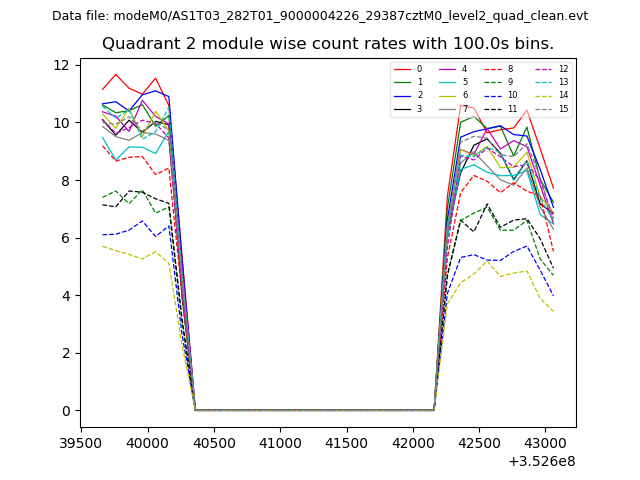
| Module-wise count rates for Quadrant C Data is divided into 100 sec bins |
 |
 |
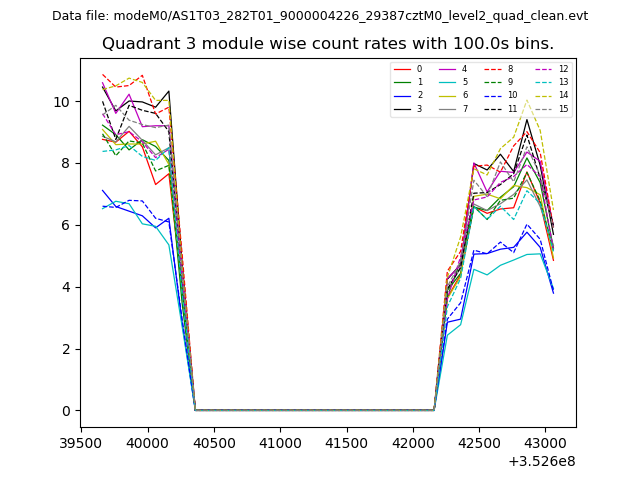
| Module-wise count rates for Quadrant D Data is divided into 100 sec bins |
 |
 |
| Parameter | Plot |
|---|---|
| CZT HV Monitor | 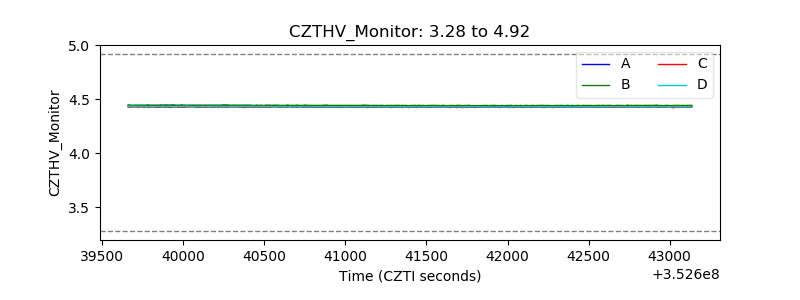 |
| D_VDD | 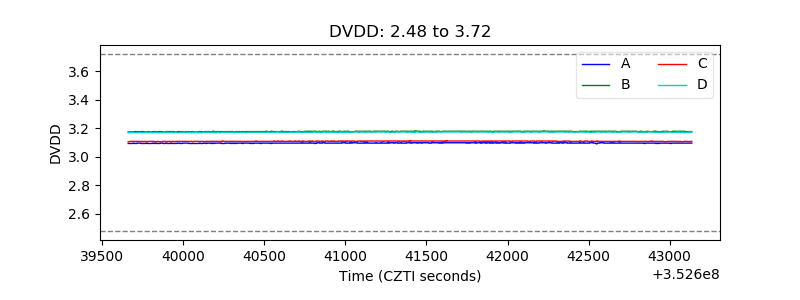 |
| Temperature 1 | 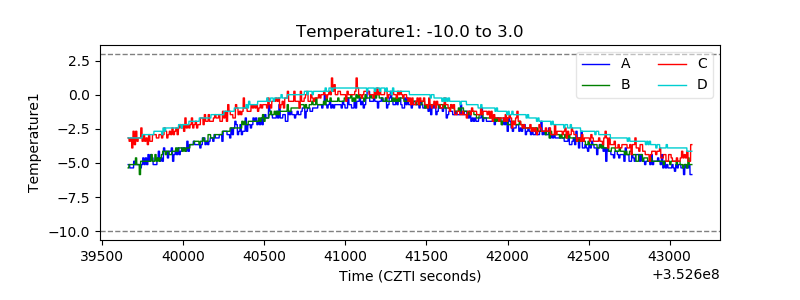 |
| Veto HV Monitor | 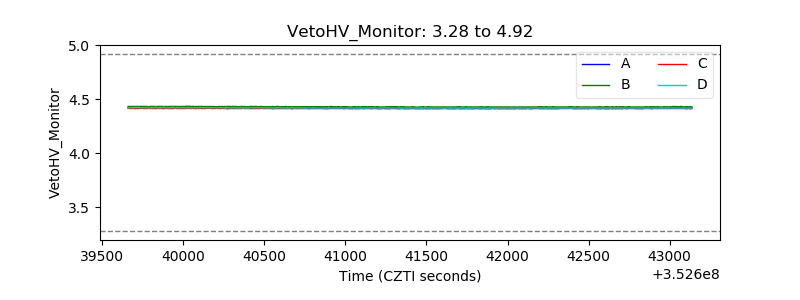 |
| Veto LLD |  |
| Alpha Counter | 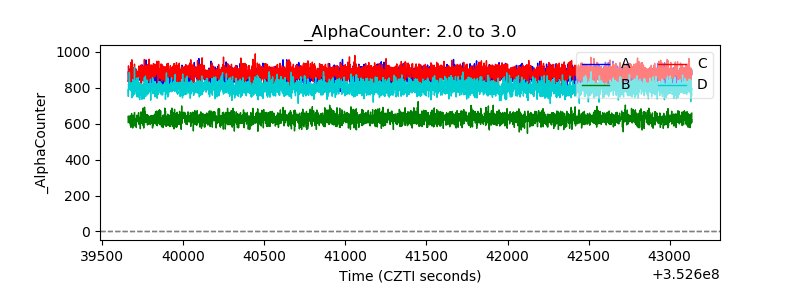 |
| _CPM_Rate | 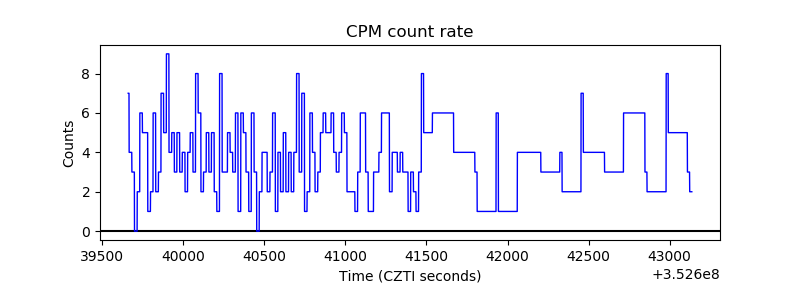 |
| CZT Counter |  |
| +2.5 Volts monitor |  |
| +5 Volts monitor |  |
| _ROLL_ROT | 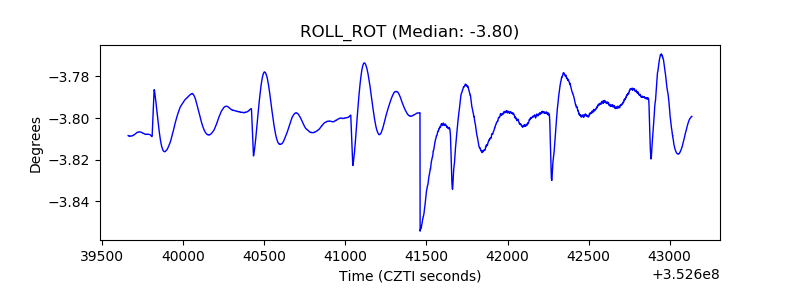 |
| _Roll_DEC | 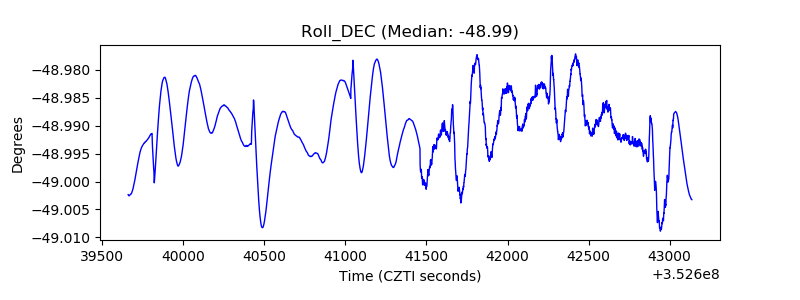 |
| _Roll_RA | 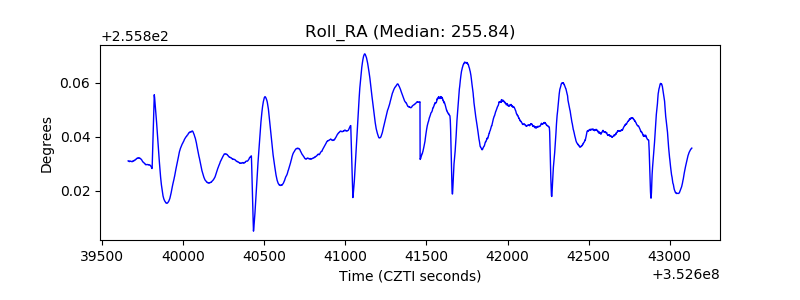 |
| Veto Counter |  |