| Param | Original file | Final file |
|---|---|---|
| Filename | modeM0/AS1A10_102T11_9000004230cztM0_level2.fits | modeM0/AS1A10_102T11_9000004230cztM0_level2_quad_clean.evt |
| Size (bytes) | 788,267,520 | 625,547,520 |
| Size | 751.8 MB | 596.6 MB |
| Events in quadrant A | 4,987,372 | 3,614,260 |
| Events in quadrant B | 4,746,674 | 3,636,494 |
| Events in quadrant C | 4,560,050 | 3,160,361 |
| Events in quadrant D | 3,969,804 | 2,932,643 |
| Mode SS | |||
|---|---|---|---|
| Quadrant | BADHDUFLAG | Total packets | Discarded packets |
| A | 0 | 1664 | 0 |
| B | 0 | 1664 | 0 |
| C | 0 | 1664 | 0 |
| D | 0 | 1664 | 0 |
| Mode M0 | |||
|---|---|---|---|
| Quadrant | BADHDUFLAG | Total packets | Discarded packets |
| A | 0 | 174767 | 0 |
| B | 0 | 189199 | 0 |
| C | 0 | 275404 | 0 |
| D | 0 | 307690 | 0 |
| Mode M9 | |||
|---|---|---|---|
| Quadrant | BADHDUFLAG | Total packets | Discarded packets |
| A | 0 | 116 | 0 |
| B | 0 | 116 | 0 |
| C | 0 | 116 | 0 |
| D | 0 | 116 | 0 |
| Quadrant | Total seconds | Saturated seconds | Saturation percentage |
|---|---|---|---|
| A | 81647 | 1339 | 1.639987% |
| B | 81647 | 2580 | 3.159945% |
| C | 81647 | 10777 | 13.199505% |
| D | 81647 | 12312 | 15.079550% |
Noise dominated data is calculated using 1-second bins in cleaned event files. If a bin has >2000 counts, and if more than 50% of those come from <1% of pixels, then it is considered to be noise-dominated and hence unusable.
| Quadrant | # 1 sec bins | Bins with >0 counts | Bins with >2000 counts | High rate bins dominated by noise | Noise dominated (total time) | Noise dominated (detector-on time) | Marked lightcurve |
|---|---|---|---|---|---|---|---|
| A | 93452 | 81646 | 0 | 0 | 0.00% | 0.00% |  |
| B | 93452 | 81638 | 0 | 0 | 0.00% | 0.00% | 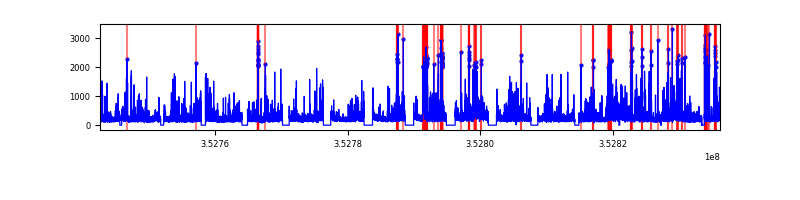 |
| C | 93452 | 81631 | 0 | 0 | 0.00% | 0.00% |  |
| D | 93452 | 81569 | 0 | 0 | 0.00% | 0.00% | 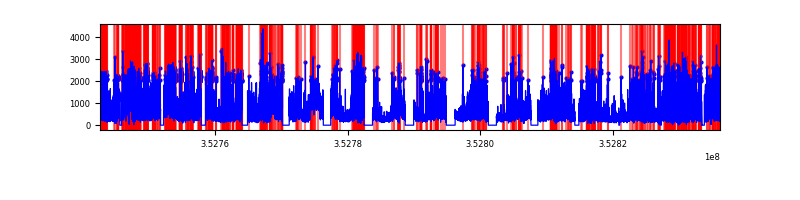 |
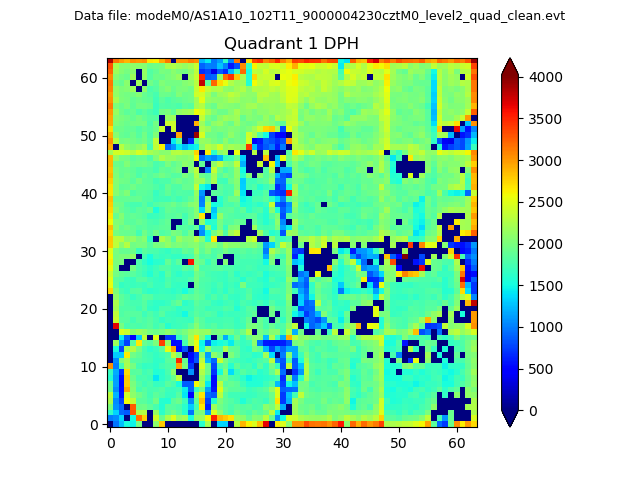
Top three noisy pixels from each quadrant. If the there are fewer than three noisy pixels in the level2.evt file, extra rows are filled as -1
| Pixel properties | Quadrant properties | ||||||
|---|---|---|---|---|---|---|---|
| Quadrant | DetID | PixID | Counts | Sigma | Mean | Median | Sigma |
| A | 0 | 29 | 4221 | 9.5 | 1299 | 1221 | 315.7 |
| A | 7 | 110 | 3925 | 8.57 | 1299 | 1221 | 315.7 |
| A | 9 | 19 | 3723 | 7.93 | 1299 | 1221 | 315.7 |
| B | 2 | 9 | 3869 | 11.06 | 1251 | 1195 | 241.7 |
| B | 2 | 8 | 3176 | 8.2 | 1251 | 1195 | 241.7 |
| B | 3 | 17 | 3153 | 8.1 | 1251 | 1195 | 241.7 |
| C | 1 | 80 | 3566 | 8.0 | 1204 | 1127 | 304.8 |
| C | 1 | 81 | 3502 | 7.79 | 1204 | 1127 | 304.8 |
| C | 12 | 241 | 3210 | 6.83 | 1204 | 1127 | 304.8 |
| D | 3 | 14 | 2958 | 6.41 | 1133 | 1032 | 300.6 |
| D | 15 | 46 | 2926 | 6.3 | 1133 | 1032 | 300.6 |
| D | 10 | 189 | 2834 | 5.99 | 1133 | 1032 | 300.6 |
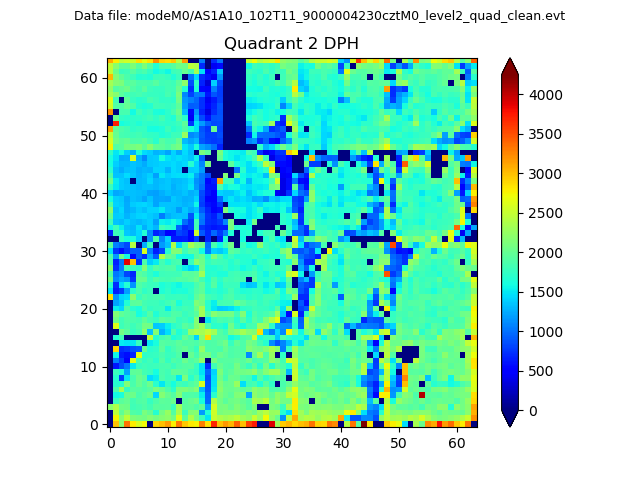
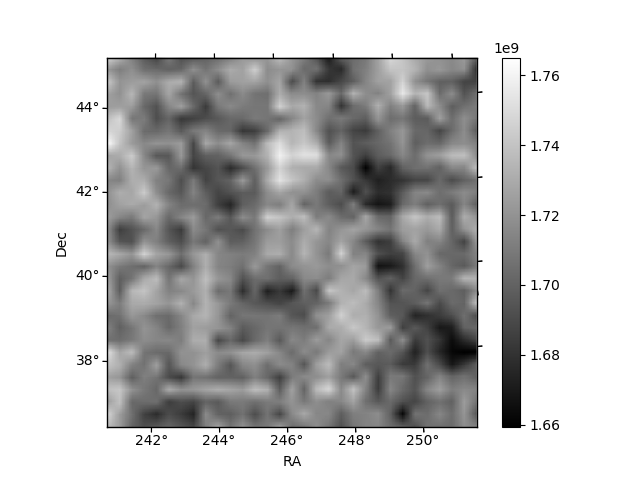
Histogram calculated using DETX and DETY for each event in the final _common_clean file
| Quadrant A | 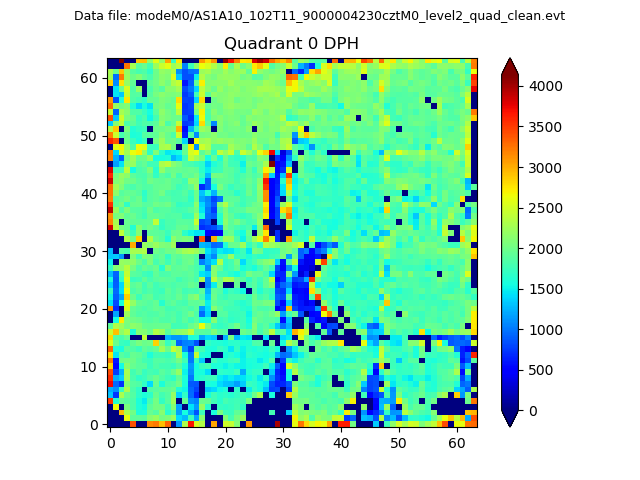 |
 |
Quadrant B |
|---|---|---|---|
| Quadrant D | 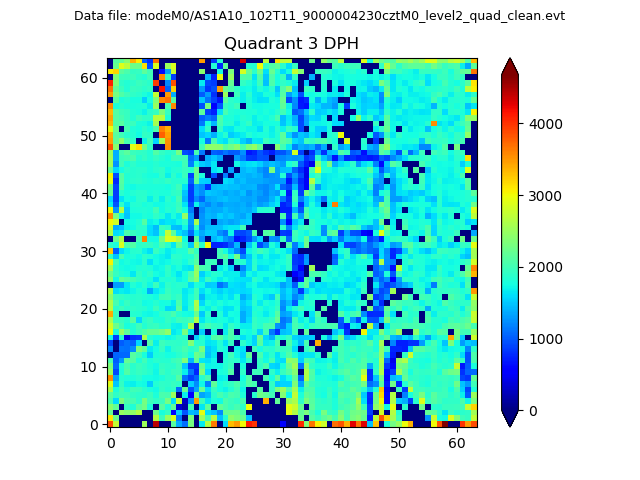 |
 |
Quadrant C |
| Plot type | Count rate plots | Images |
|---|---|---|
| Comparison with Poisson distribution Blue bars denote a histogram of data divided into 1 sec bins. Red curve is a Poisson curve with rate = median count rate of data. |
 |
 |
| Quadrant-wise count rates Data is divided into 100 sec bins |
 |
|
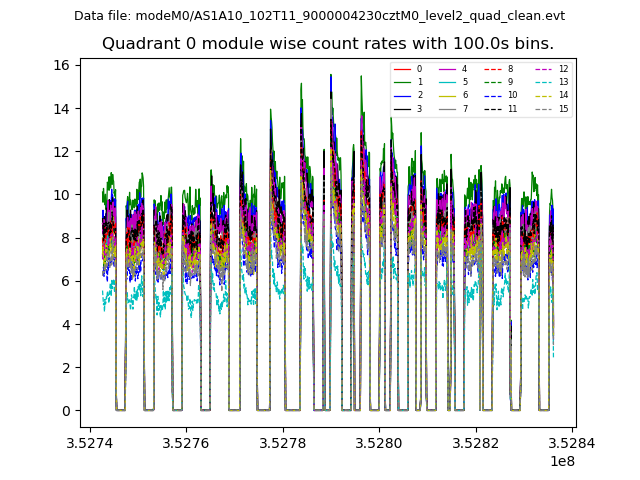
| Module-wise count rates for Quadrant A Data is divided into 100 sec bins |
 |
 |
| Module-wise count rates for Quadrant B Data is divided into 100 sec bins |
 |
 |
| Module-wise count rates for Quadrant C Data is divided into 100 sec bins |
 |
 |
| Module-wise count rates for Quadrant D Data is divided into 100 sec bins |
 |
 |
| Parameter | Plot |
|---|---|
| CZT HV Monitor |  |
| D_VDD | 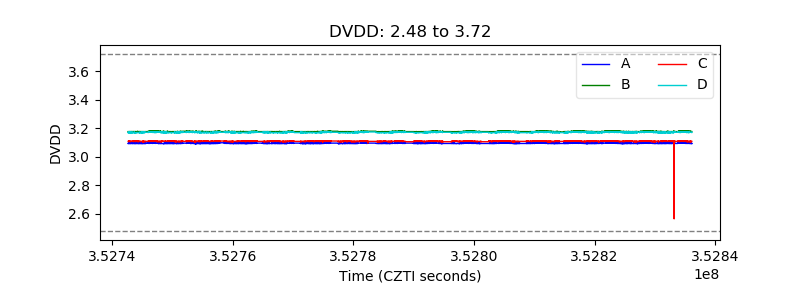 |
| Temperature 1 |  |
| Veto HV Monitor |  |
| Veto LLD |  |
| Alpha Counter |  |
| _CPM_Rate |  |
| CZT Counter |  |
| +2.5 Volts monitor |  |
| +5 Volts monitor | 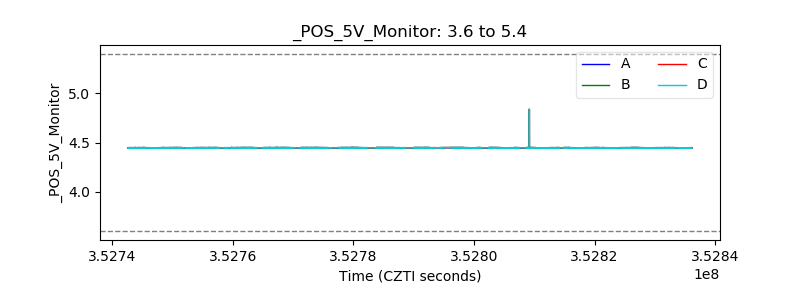 |
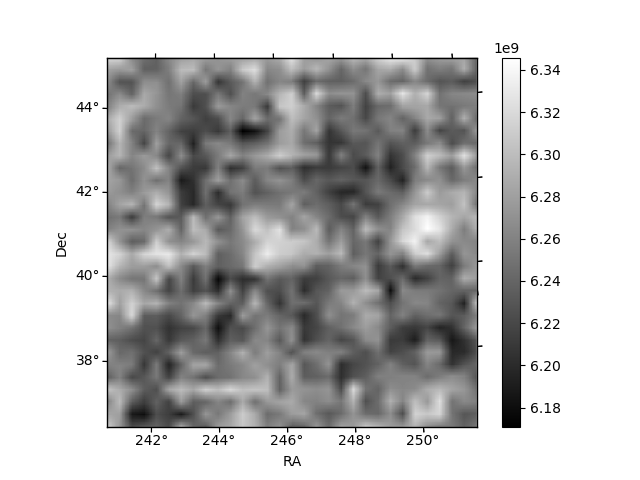
| _ROLL_ROT |  |
| _Roll_DEC |  |
| _Roll_RA |  |
| Veto Counter |  |