| Param | Original file | Final file |
|---|---|---|
| Filename | modeM0/AS1A10_102T11_9000004230_29404cztM0_level2.evt | modeM0/AS1A10_102T11_9000004230_29404cztM0_level2_quad_clean.evt |
| Size (bytes) | 432,227,520 | 57,504,960 |
| Size | 412.2 MB | 54.8 MB |
| Events in quadrant A | 2,202,188 | 361,597 |
| Events in quadrant B | 2,440,160 | 365,197 |
| Events in quadrant C | 2,735,157 | 354,460 |
| Events in quadrant D | 5,404,871 | 341,617 |
| Mode SS | |||
|---|---|---|---|
| Quadrant | BADHDUFLAG | Total packets | Discarded packets |
| A | 0 | 92 | 0 |
| B | 0 | 92 | 0 |
| C | 0 | 92 | 0 |
| D | 0 | 92 | 0 |
| Mode M0 | |||
|---|---|---|---|
| Quadrant | BADHDUFLAG | Total packets | Discarded packets |
| A | 0 | 9440 | 1 |
| B | 0 | 10106 | 1 |
| C | 0 | 11130 | 1 |
| D | 0 | 19155 | 3 |
| Mode M9 | |||
|---|---|---|---|
| Quadrant | BADHDUFLAG | Total packets | Discarded packets |
| A | 0 | 3 | 0 |
| B | 0 | 3 | 0 |
| C | 0 | 3 | 0 |
| D | 0 | 3 | 0 |
| Quadrant | Total seconds | Saturated seconds | Saturation percentage |
|---|---|---|---|
| A | 4526 | 80 | 1.767565% |
| B | 4526 | 124 | 2.739726% |
| C | 4526 | 178 | 3.932833% |
| D | 4525 | 1072 | 23.690608% |
Noise dominated data is calculated using 1-second bins in cleaned event files. If a bin has >2000 counts, and if more than 50% of those come from <1% of pixels, then it is considered to be noise-dominated and hence unusable.
| Quadrant | # 1 sec bins | Bins with >0 counts | Bins with >2000 counts | High rate bins dominated by noise | Noise dominated (total time) | Noise dominated (detector-on time) | Marked lightcurve |
|---|---|---|---|---|---|---|---|
| A | 4806 | 4527 | 2 | 2 | 0.04% | 0.04% | 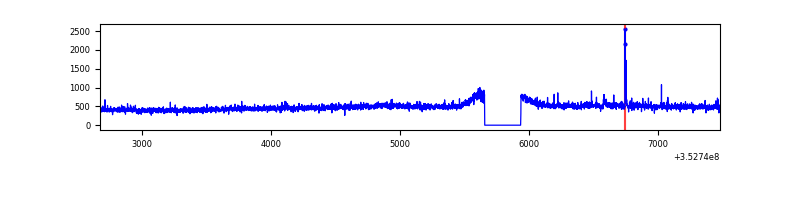 |
| B | 4806 | 4527 | 13 | 13 | 0.27% | 0.29% | 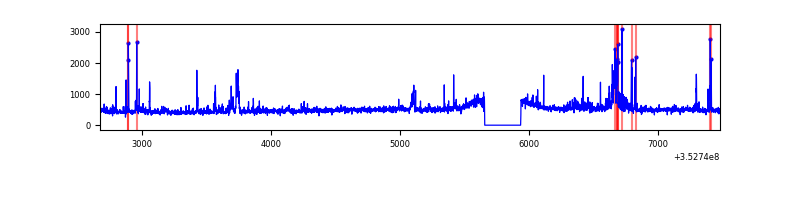 |
| C | 4806 | 4527 | 0 | 0 | 0.00% | 0.00% | 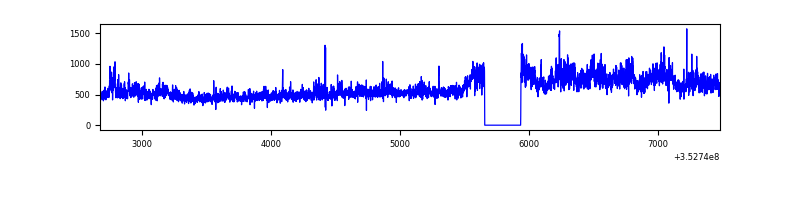 |
| D | 4805 | 4526 | 858 | 858 | 17.86% | 18.96% | 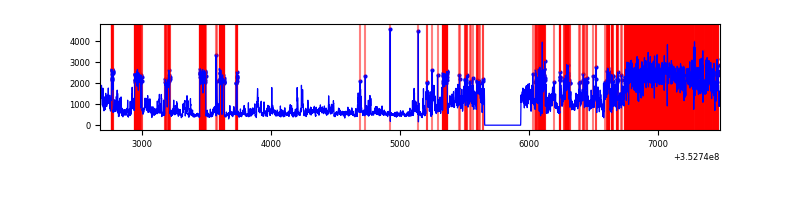 |
Top three noisy pixels from each quadrant. If the there are fewer than three noisy pixels in the level2.evt file, extra rows are filled as -1
| Pixel properties | Quadrant properties | ||||||
|---|---|---|---|---|---|---|---|
| Quadrant | DetID | PixID | Counts | Sigma | Mean | Median | Sigma |
| A | 0 | 13 | 28857 | 245.07 | 563 | 551 | 115.5 |
| A | 13 | 254 | 8063 | 65.04 | 563 | 551 | 115.5 |
| A | 3 | 137 | 5560 | 43.37 | 563 | 551 | 115.5 |
| B | 0 | 229 | 90917 | 833.75 | 553 | 538 | 108.4 |
| B | 10 | 245 | 77656 | 711.41 | 553 | 538 | 108.4 |
| B | 15 | 32 | 36081 | 327.88 | 553 | 538 | 108.4 |
| C | 3 | 233 | 521526 | 4153.66 | 531 | 531 | 125.4 |
| C | 14 | 238 | 87751 | 695.37 | 531 | 531 | 125.4 |
| C | 10 | 9 | 20986 | 163.08 | 531 | 531 | 125.4 |
| D | 8 | 195 | 1771699 | 14841.87 | 498 | 484 | 119.3 |
| D | 12 | 33 | 1155382 | 9677.45 | 498 | 484 | 119.3 |
| D | 1 | 52 | 467641 | 3914.53 | 498 | 484 | 119.3 |
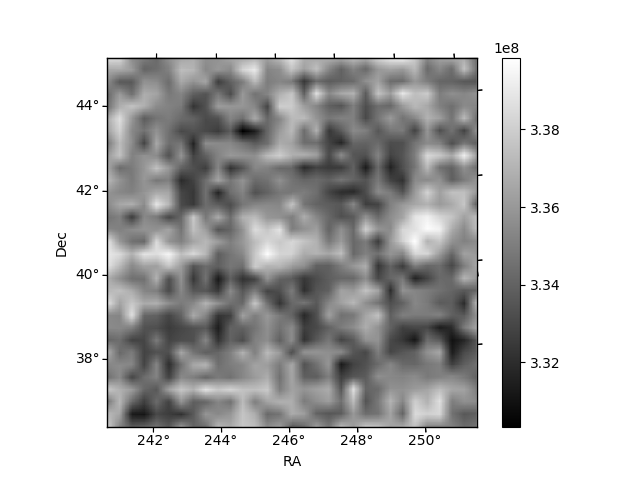
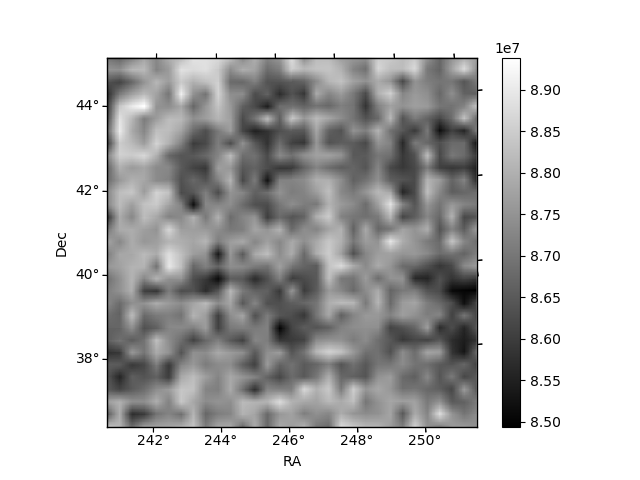
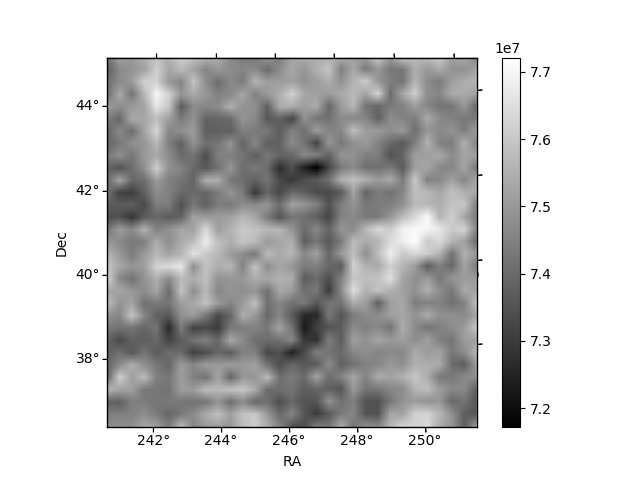
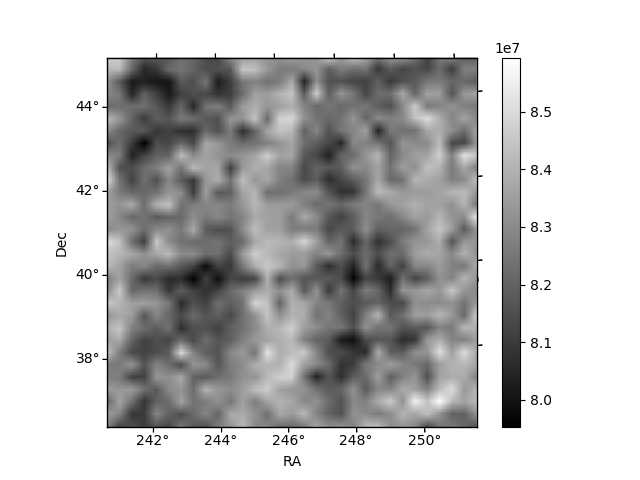
Histogram calculated using DETX and DETY for each event in the final _common_clean file
| Quadrant A | 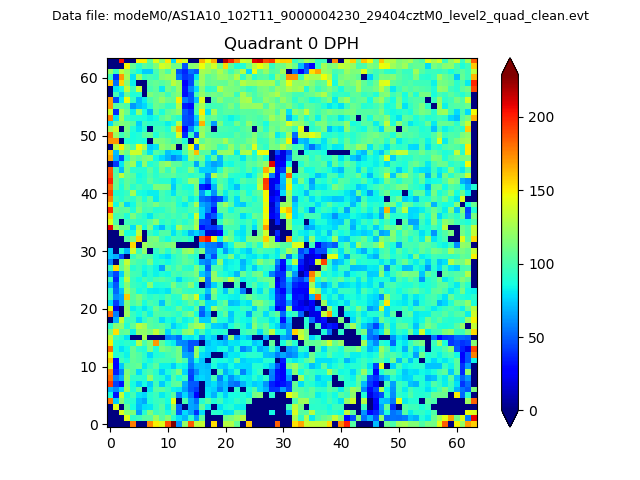 |
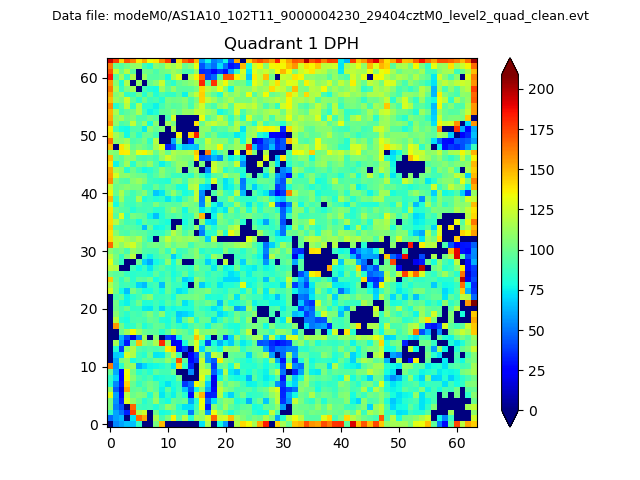 |
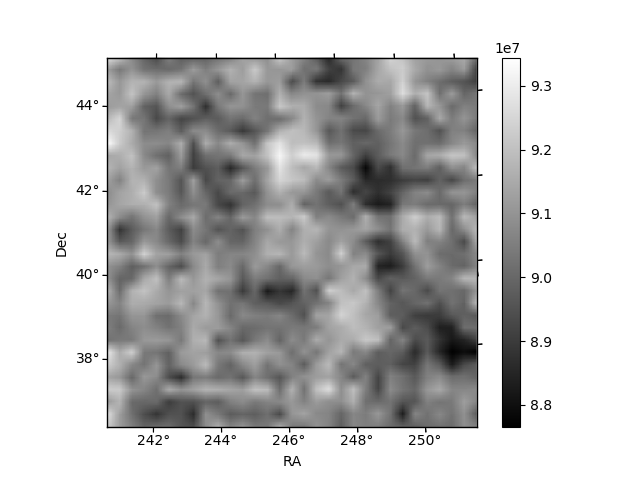
Quadrant B |
|---|---|---|---|
| Quadrant D | 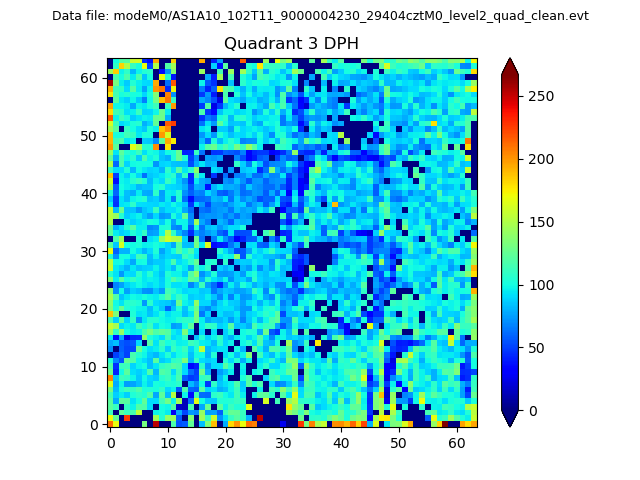 |
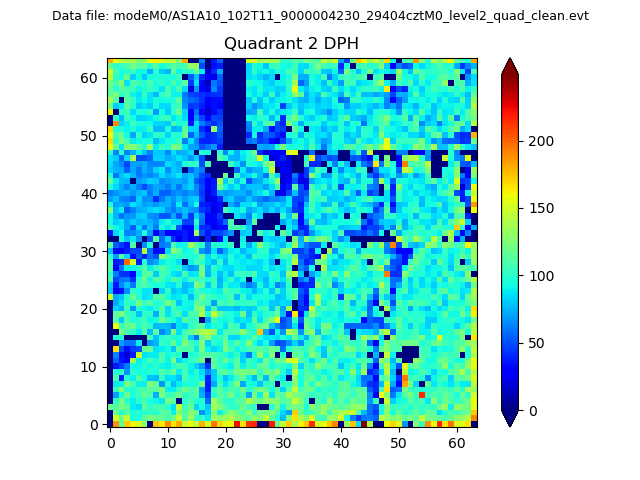 |
Quadrant C |
| Plot type | Count rate plots | Images |
|---|---|---|
| Comparison with Poisson distribution Blue bars denote a histogram of data divided into 1 sec bins. Red curve is a Poisson curve with rate = median count rate of data. |
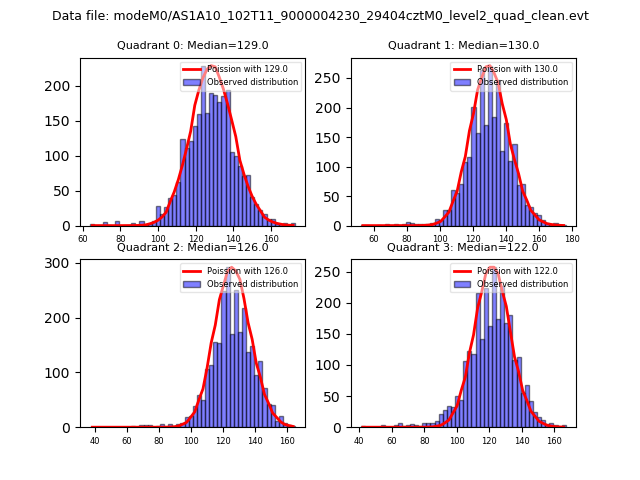 |
 |
| Quadrant-wise count rates Data is divided into 100 sec bins |
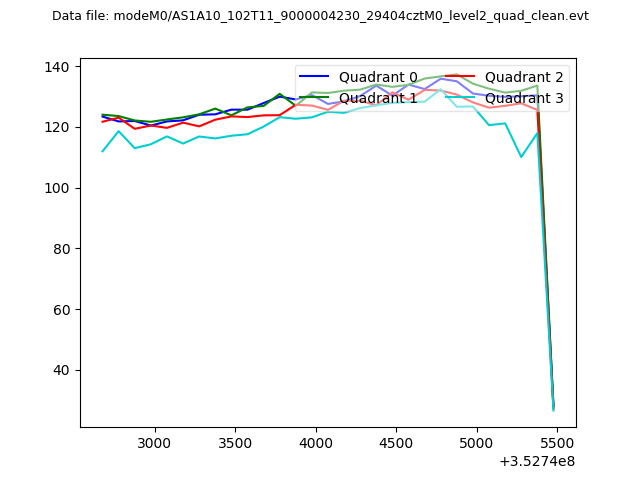 |
|
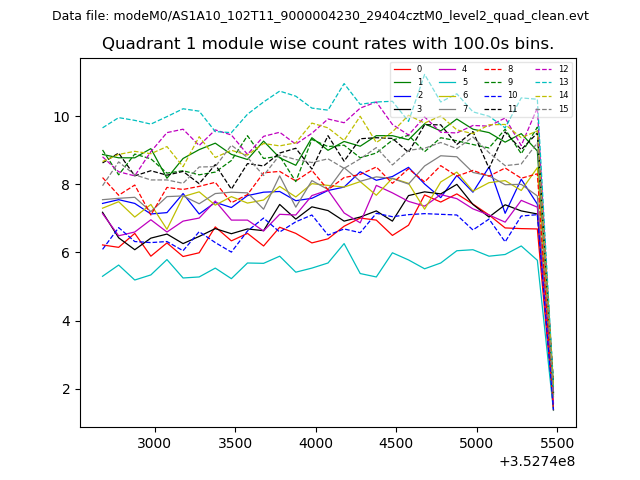
| Module-wise count rates for Quadrant A Data is divided into 100 sec bins |
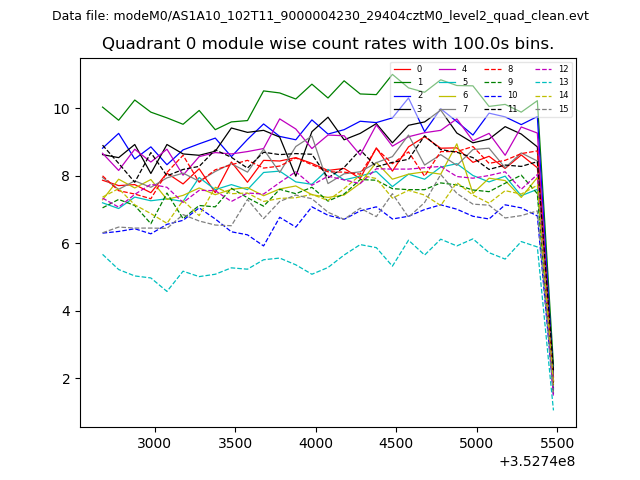 |
 |
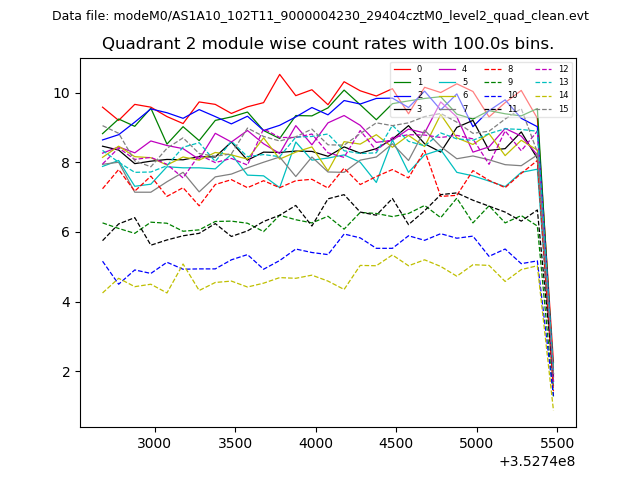
| Module-wise count rates for Quadrant B Data is divided into 100 sec bins |
 |
 |
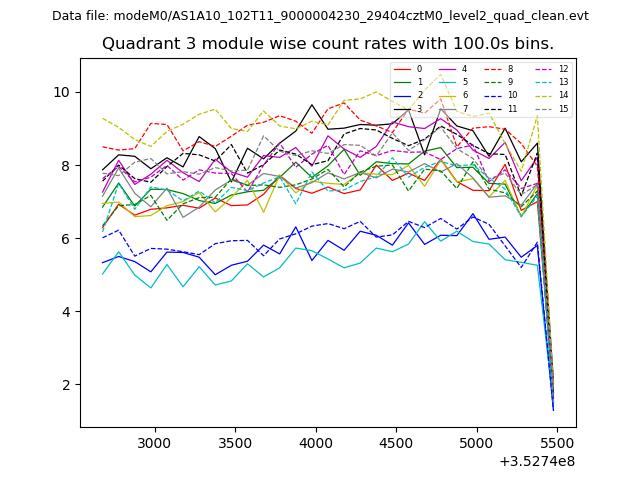
| Module-wise count rates for Quadrant C Data is divided into 100 sec bins |
 |
 |
| Module-wise count rates for Quadrant D Data is divided into 100 sec bins |
 |
 |
| Parameter | Plot |
|---|---|
| CZT HV Monitor | 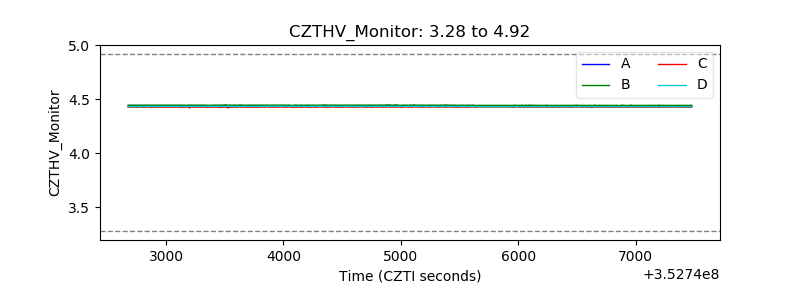 |
| D_VDD | 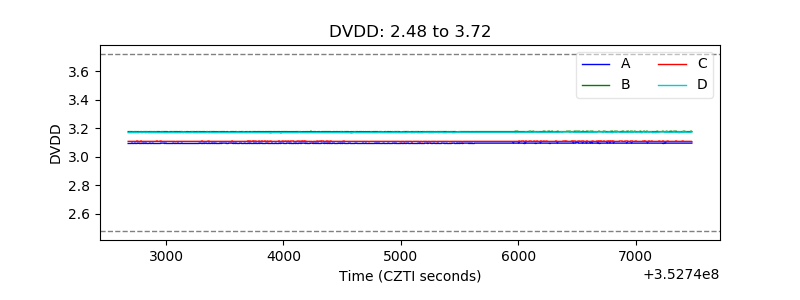 |
| Temperature 1 | 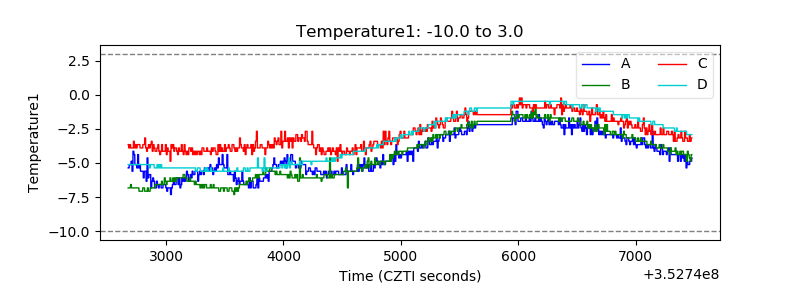 |
| Veto HV Monitor | 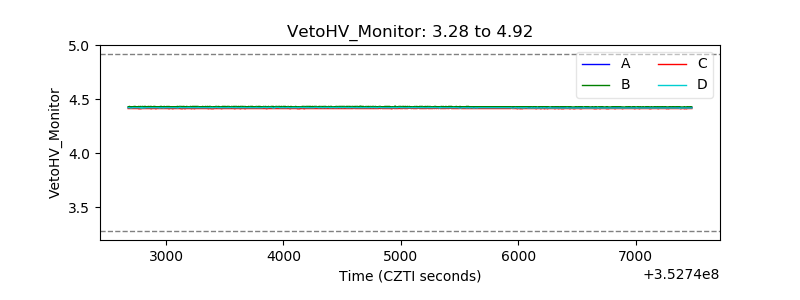 |
| Veto LLD | 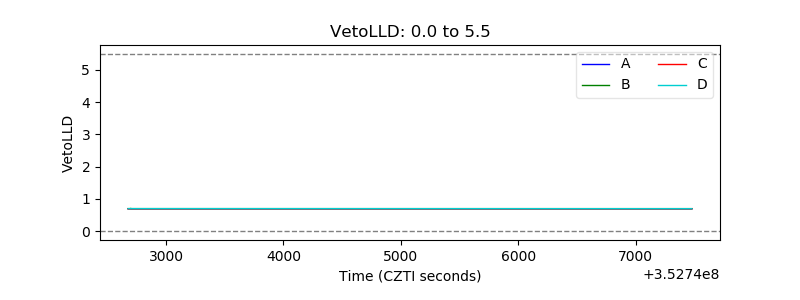 |
| Alpha Counter | 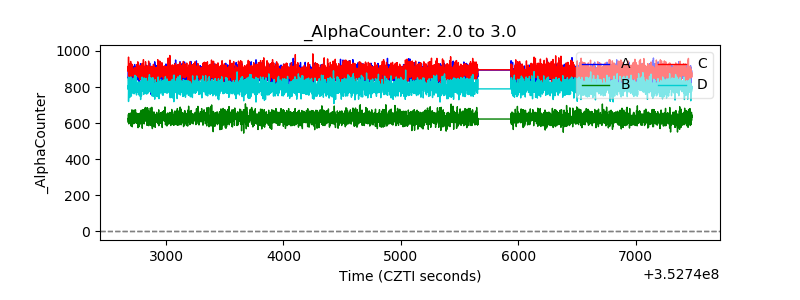 |
| _CPM_Rate | 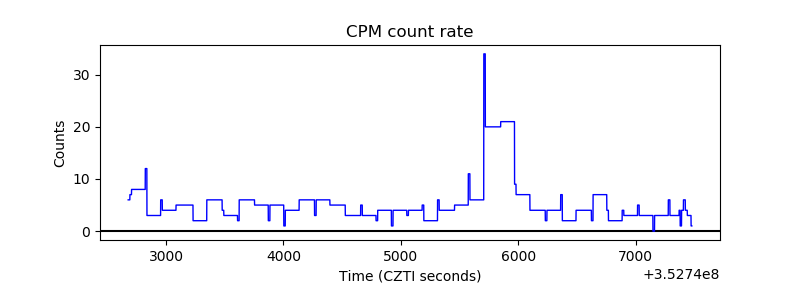 |
| CZT Counter | 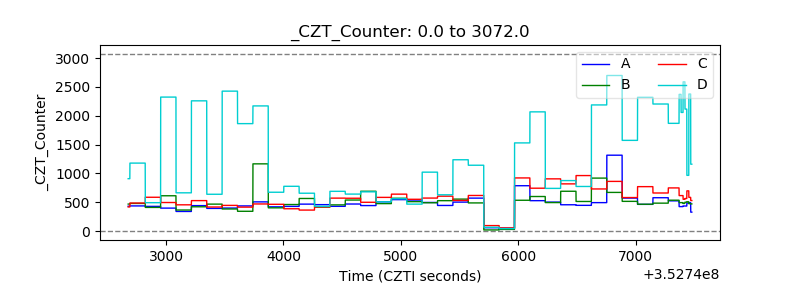 |
| +2.5 Volts monitor | 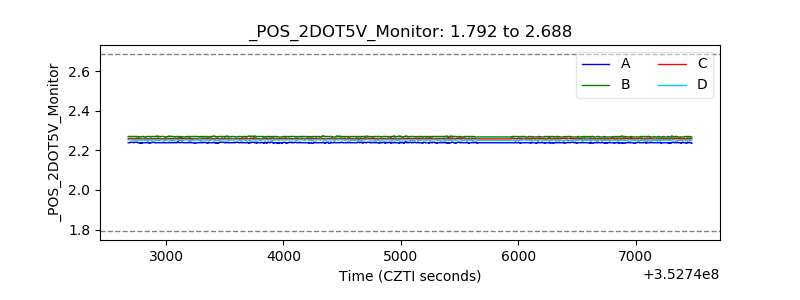 |
| +5 Volts monitor | 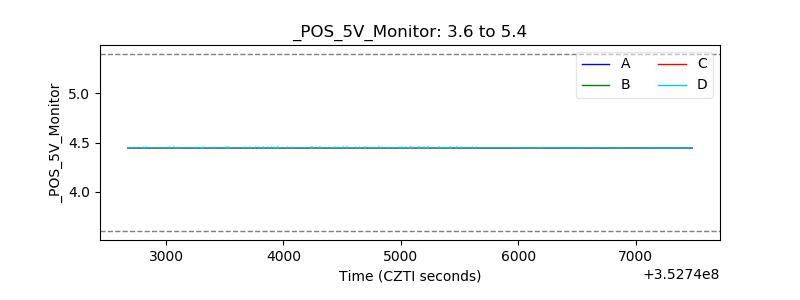 |
| _ROLL_ROT | 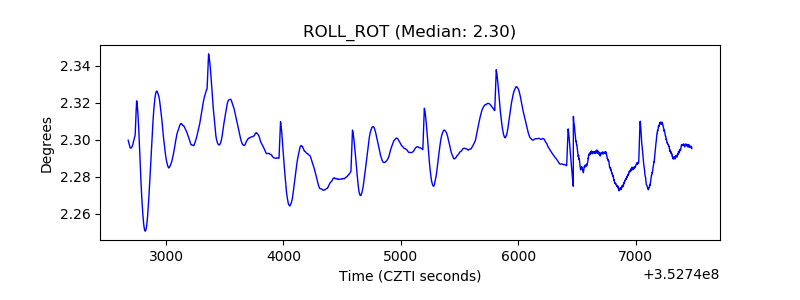 |
| _Roll_DEC | 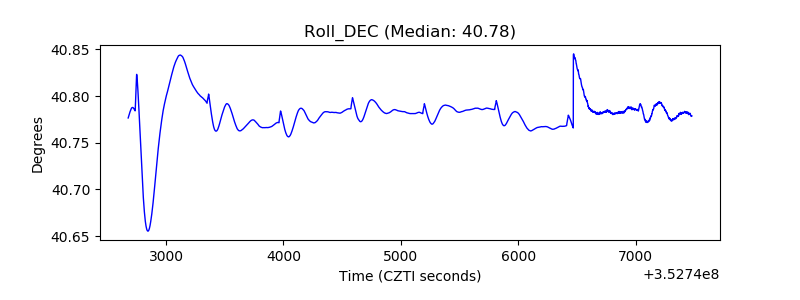 |
| _Roll_RA | 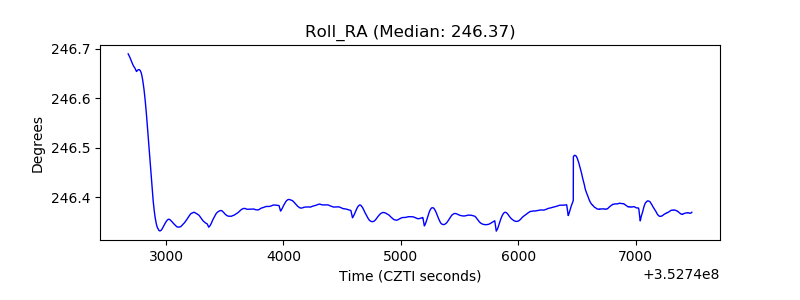 |
| Veto Counter | 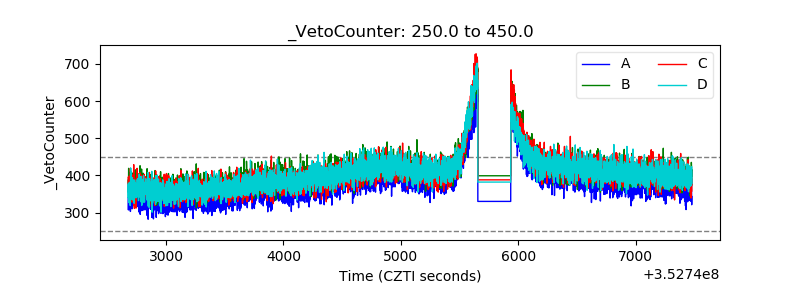 |