| Param | Original file | Final file |
|---|---|---|
| Filename | modeM0/AS1A10_102T11_9000004230_29407cztM0_level2.evt | modeM0/AS1A10_102T11_9000004230_29407cztM0_level2_quad_clean.evt |
| Size (bytes) | 1,689,543,360 | 235,552,320 |
| Size | 1.6 GB | 224.6 MB |
| Events in quadrant A | 10,097,737 | 1,508,306 |
| Events in quadrant B | 8,950,561 | 1,543,090 |
| Events in quadrant C | 11,083,985 | 1,477,758 |
| Events in quadrant D | 19,866,495 | 1,407,196 |
| Mode SS | |||
|---|---|---|---|
| Quadrant | BADHDUFLAG | Total packets | Discarded packets |
| A | 0 | 354 | 0 |
| B | 0 | 354 | 0 |
| C | 0 | 354 | 0 |
| D | 0 | 354 | 0 |
| Mode M0 | |||
|---|---|---|---|
| Quadrant | BADHDUFLAG | Total packets | Discarded packets |
| A | 0 | 41660 | 3 |
| B | 0 | 37908 | 3 |
| C | 0 | 44831 | 3 |
| D | 0 | 71254 | 4 |
| Mode M9 | |||
|---|---|---|---|
| Quadrant | BADHDUFLAG | Total packets | Discarded packets |
| A | 0 | 19 | 0 |
| B | 0 | 19 | 0 |
| C | 0 | 19 | 0 |
| D | 0 | 19 | 0 |
| Quadrant | Total seconds | Saturated seconds | Saturation percentage |
|---|---|---|---|
| A | 17371 | 395 | 2.273905% |
| B | 17371 | 247 | 1.421910% |
| C | 17371 | 753 | 4.334811% |
| D | 17370 | 2929 | 16.862406% |
Noise dominated data is calculated using 1-second bins in cleaned event files. If a bin has >2000 counts, and if more than 50% of those come from <1% of pixels, then it is considered to be noise-dominated and hence unusable.
| Quadrant | # 1 sec bins | Bins with >0 counts | Bins with >2000 counts | High rate bins dominated by noise | Noise dominated (total time) | Noise dominated (detector-on time) | Marked lightcurve |
|---|---|---|---|---|---|---|---|
| A | 19321 | 17374 | 126 | 126 | 0.65% | 0.73% | 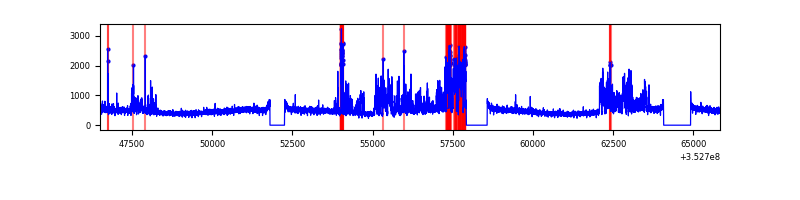 |
| B | 19321 | 17374 | 41 | 41 | 0.21% | 0.24% | 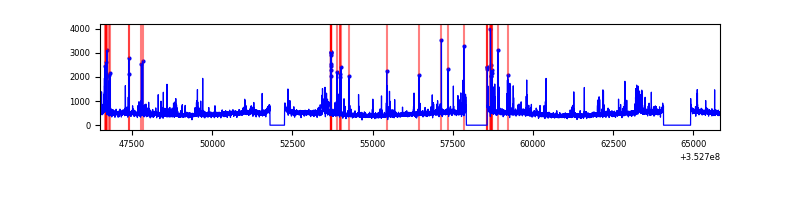 |
| C | 19321 | 17374 | 1 | 1 | 0.01% | 0.01% | 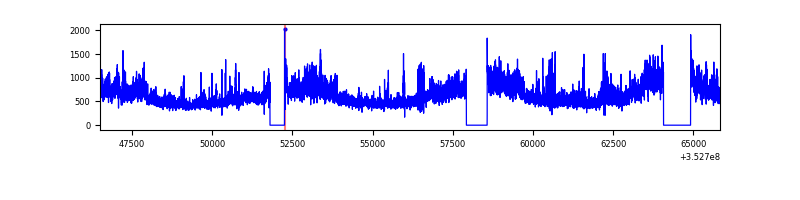 |
| D | 19320 | 17373 | 2508 | 2508 | 12.98% | 14.44% | 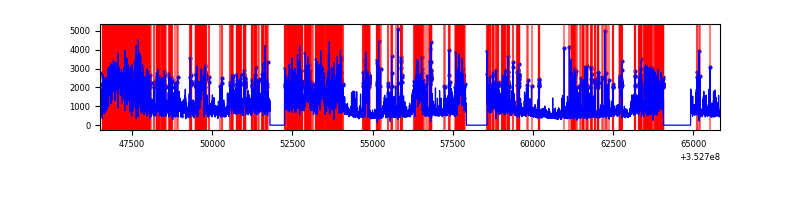 |
Top three noisy pixels from each quadrant. If the there are fewer than three noisy pixels in the level2.evt file, extra rows are filled as -1
| Pixel properties | Quadrant properties | ||||||
|---|---|---|---|---|---|---|---|
| Quadrant | DetID | PixID | Counts | Sigma | Mean | Median | Sigma |
| A | 1 | 113 | 1957198 | 4693.64 | 2073 | 2029 | 416.6 |
| A | 0 | 13 | 143695 | 340.09 | 2073 | 2029 | 416.6 |
| A | 13 | 254 | 30455 | 68.24 | 2073 | 2029 | 416.6 |
| B | 0 | 229 | 279145 | 703.54 | 2066 | 2010 | 393.9 |
| B | 10 | 245 | 235776 | 593.44 | 2066 | 2010 | 393.9 |
| B | 5 | 255 | 137280 | 343.4 | 2066 | 2010 | 393.9 |
| C | 3 | 233 | 2581435 | 5604.99 | 1979 | 1989 | 460.2 |
| C | 14 | 238 | 417591 | 903.08 | 1979 | 1989 | 460.2 |
| C | 10 | 9 | 168660 | 362.17 | 1979 | 1989 | 460.2 |
| D | 8 | 195 | 7647271 | 16735.21 | 1915 | 1863 | 456.8 |
| D | 1 | 52 | 2775208 | 6070.64 | 1915 | 1863 | 456.8 |
| D | 12 | 33 | 1377522 | 3011.21 | 1915 | 1863 | 456.8 |
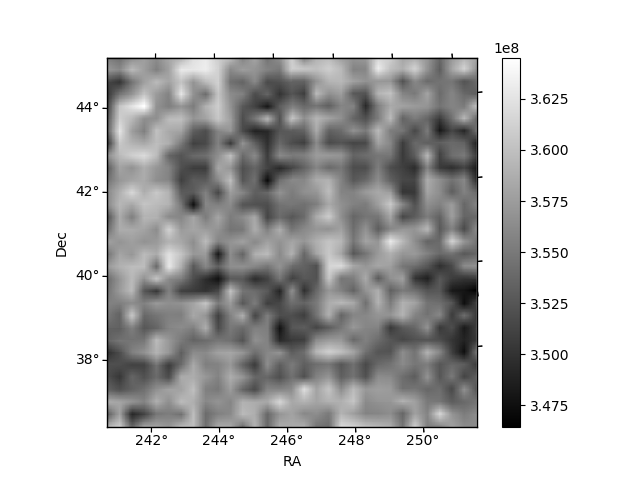
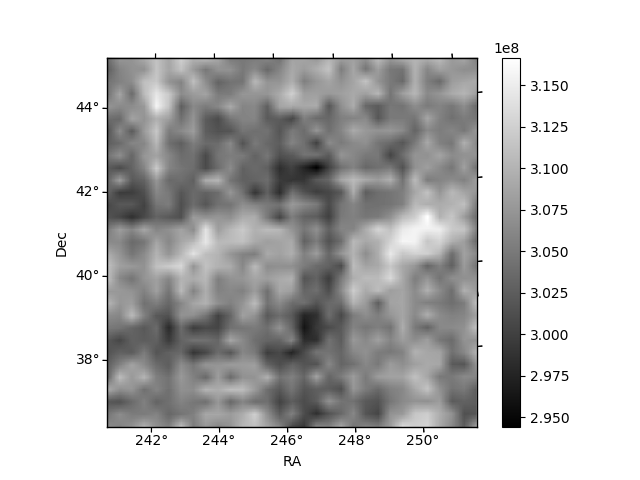
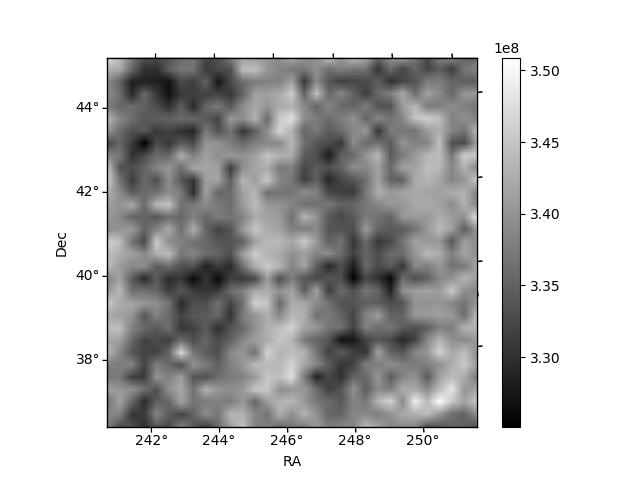
Histogram calculated using DETX and DETY for each event in the final _common_clean file
| Quadrant A |  |
 |
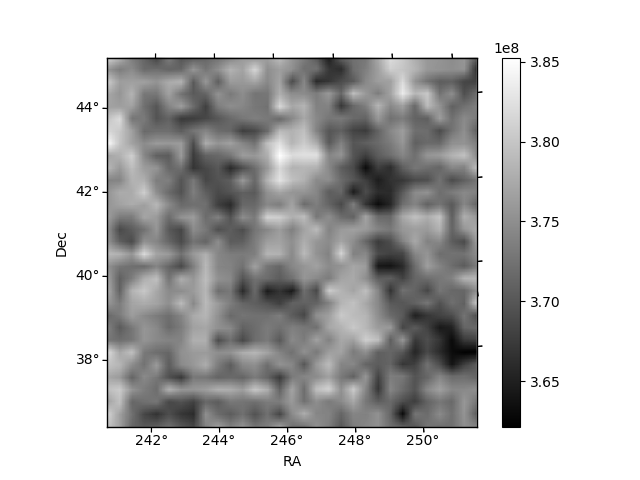
Quadrant B |
|---|---|---|---|
| Quadrant D |  |
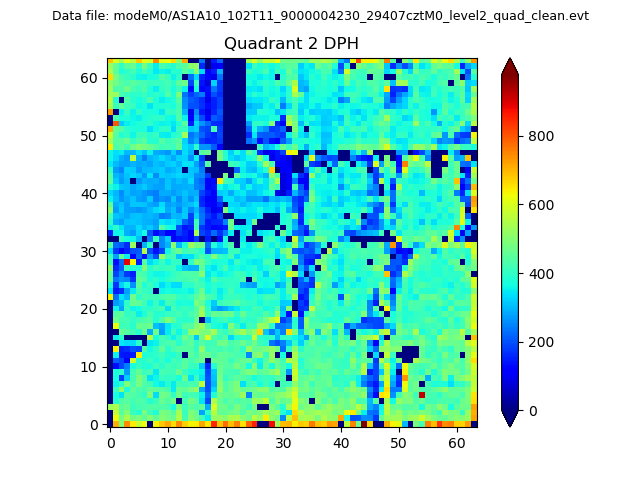 |
Quadrant C |
| Plot type | Count rate plots | Images |
|---|---|---|
| Comparison with Poisson distribution Blue bars denote a histogram of data divided into 1 sec bins. Red curve is a Poisson curve with rate = median count rate of data. |
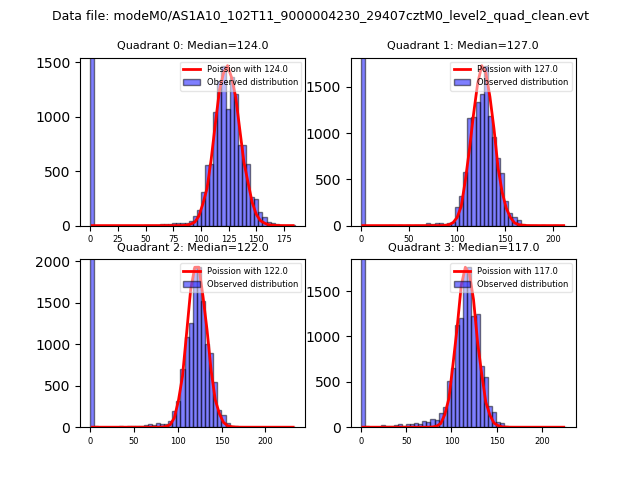 |
 |
| Quadrant-wise count rates Data is divided into 100 sec bins |
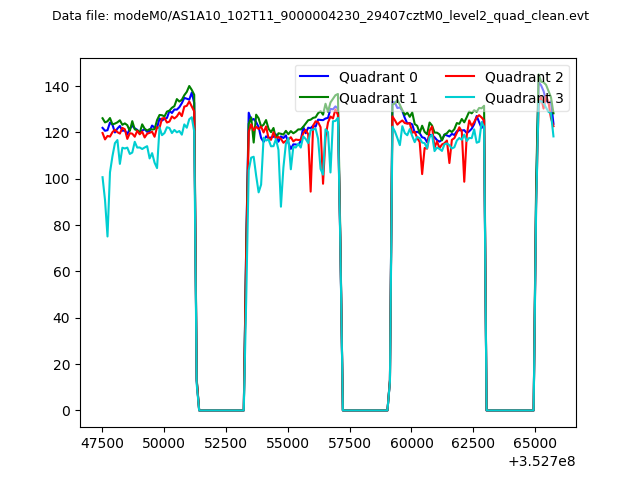 |
|
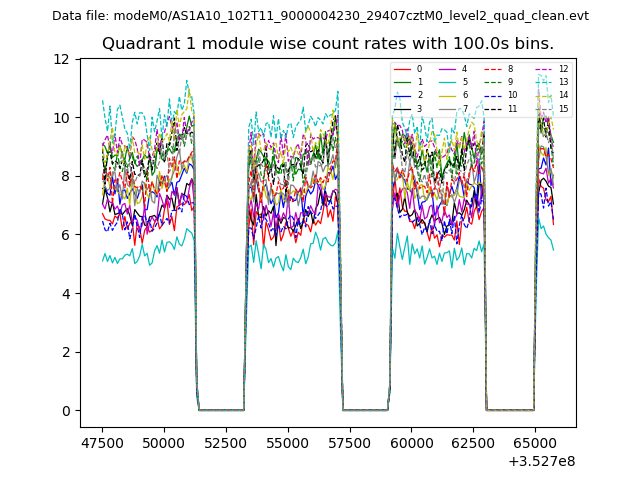
| Module-wise count rates for Quadrant A Data is divided into 100 sec bins |
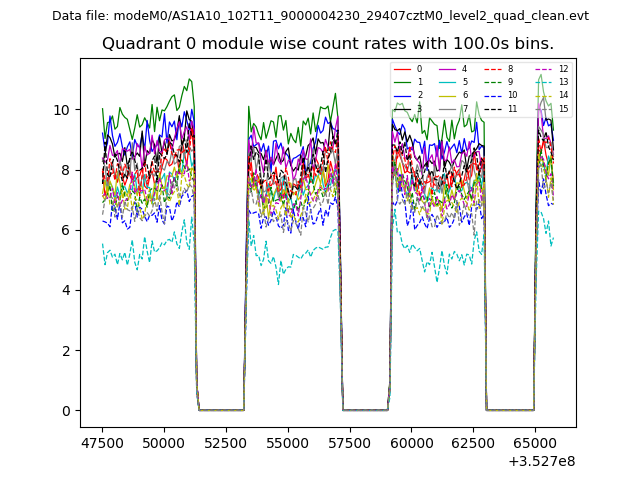 |
 |
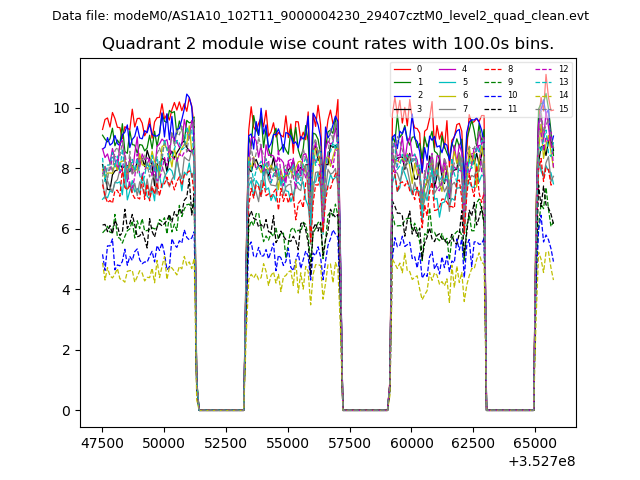
| Module-wise count rates for Quadrant B Data is divided into 100 sec bins |
 |
 |
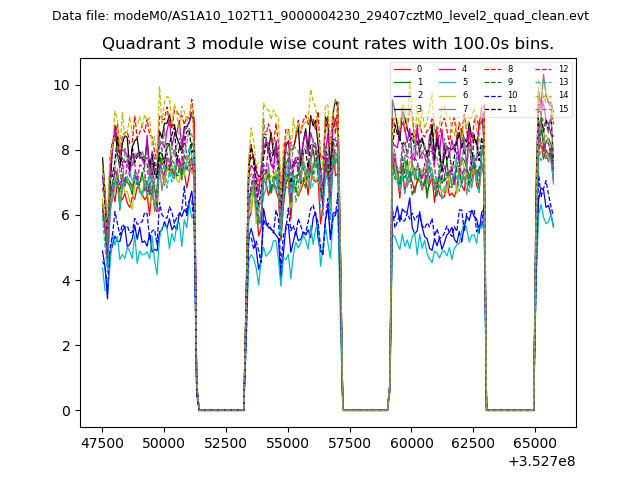
| Module-wise count rates for Quadrant C Data is divided into 100 sec bins |
 |
 |
| Module-wise count rates for Quadrant D Data is divided into 100 sec bins |
 |
 |
| Parameter | Plot |
|---|---|
| CZT HV Monitor | 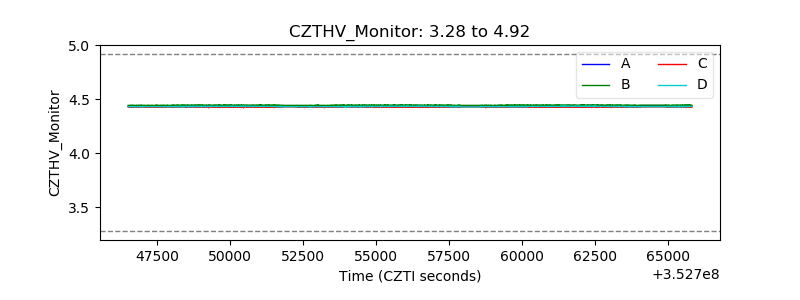 |
| D_VDD | 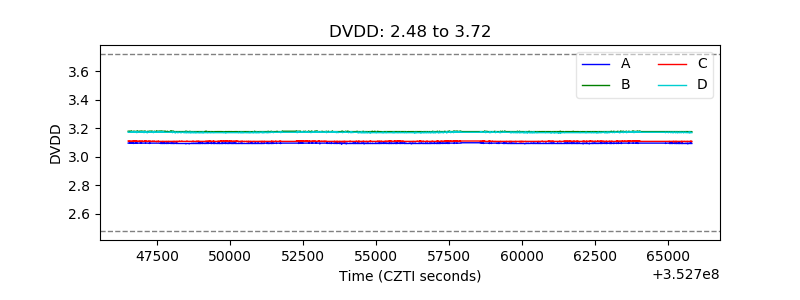 |
| Temperature 1 | 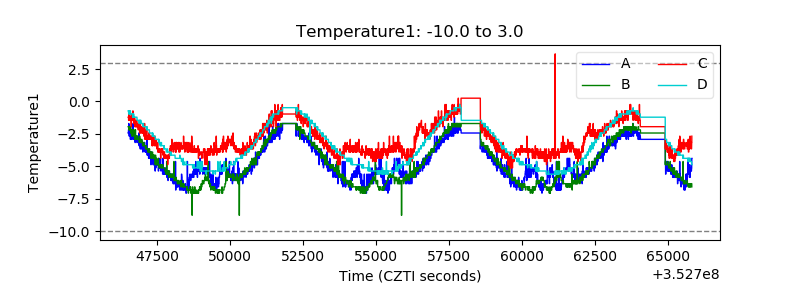 |
| Veto HV Monitor |  |
| Veto LLD |  |
| Alpha Counter | 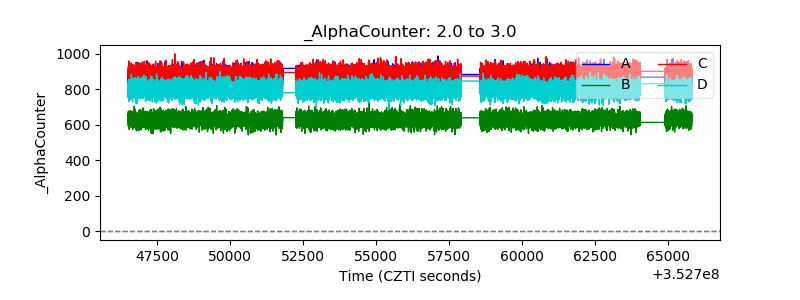 |
| _CPM_Rate | 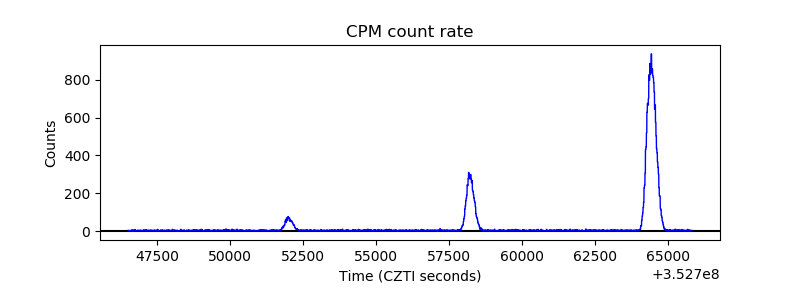 |
| CZT Counter | 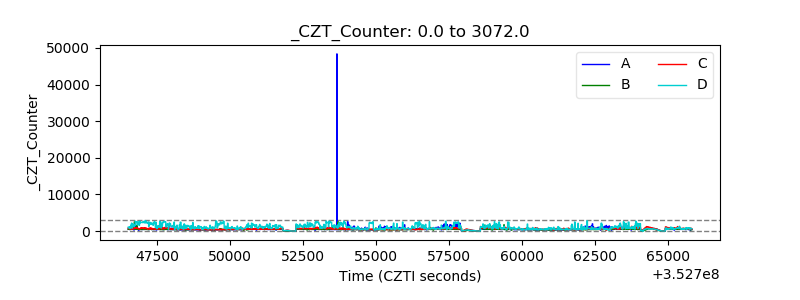 |
| +2.5 Volts monitor |  |
| +5 Volts monitor |  |
| _ROLL_ROT | 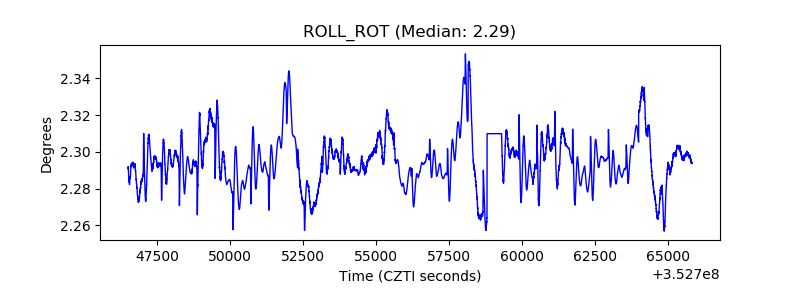 |
| _Roll_DEC | 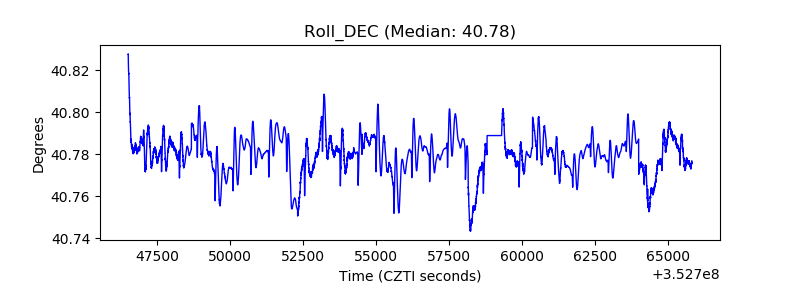 |
| _Roll_RA |  |
| Veto Counter | 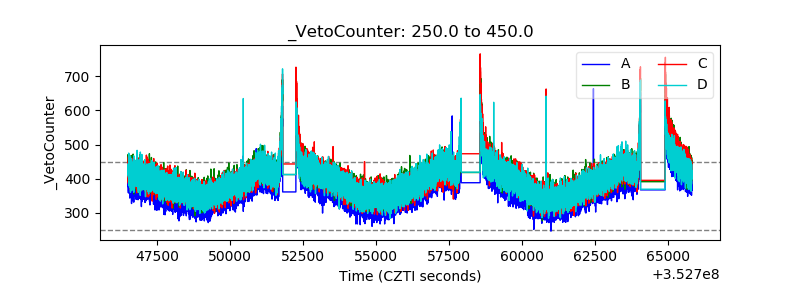 |