| Param | Original file | Final file |
|---|---|---|
| Filename | modeM0/AS1A10_102T11_9000004230_29408cztM0_level2.evt | modeM0/AS1A10_102T11_9000004230_29408cztM0_level2_quad_clean.evt |
| Size (bytes) | 574,873,920 | 100,967,040 |
| Size | 548.2 MB | 96.3 MB |
| Events in quadrant A | 3,110,796 | 664,353 |
| Events in quadrant B | 3,438,290 | 678,532 |
| Events in quadrant C | 3,823,430 | 653,541 |
| Events in quadrant D | 6,592,338 | 602,953 |
| Mode SS | |||
|---|---|---|---|
| Quadrant | BADHDUFLAG | Total packets | Discarded packets |
| A | 0 | 134 | 0 |
| B | 0 | 134 | 0 |
| C | 0 | 134 | 0 |
| D | 0 | 134 | 0 |
| Mode M0 | |||
|---|---|---|---|
| Quadrant | BADHDUFLAG | Total packets | Discarded packets |
| A | 0 | 13602 | 2 |
| B | 0 | 14439 | 2 |
| C | 0 | 15778 | 2 |
| D | 0 | 24220 | 7 |
| Mode M9 | |||
|---|---|---|---|
| Quadrant | BADHDUFLAG | Total packets | Discarded packets |
| A | 0 | 13 | 0 |
| B | 0 | 14 | 0 |
| C | 0 | 14 | 0 |
| D | 0 | 14 | 0 |
| Quadrant | Total seconds | Saturated seconds | Saturation percentage |
|---|---|---|---|
| A | 6570 | 11 | 0.167428% |
| B | 6570 | 67 | 1.019787% |
| C | 6570 | 188 | 2.861492% |
| D | 6569 | 696 | 10.595220% |
Noise dominated data is calculated using 1-second bins in cleaned event files. If a bin has >2000 counts, and if more than 50% of those come from <1% of pixels, then it is considered to be noise-dominated and hence unusable.
| Quadrant | # 1 sec bins | Bins with >0 counts | Bins with >2000 counts | High rate bins dominated by noise | Noise dominated (total time) | Noise dominated (detector-on time) | Marked lightcurve |
|---|---|---|---|---|---|---|---|
| A | 7580 | 6571 | 0 | 0 | 0.00% | 0.00% | 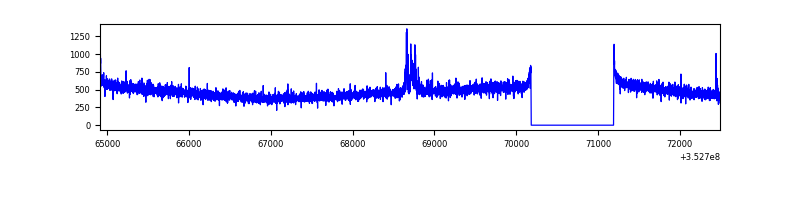 |
| B | 7580 | 6571 | 27 | 27 | 0.36% | 0.41% | 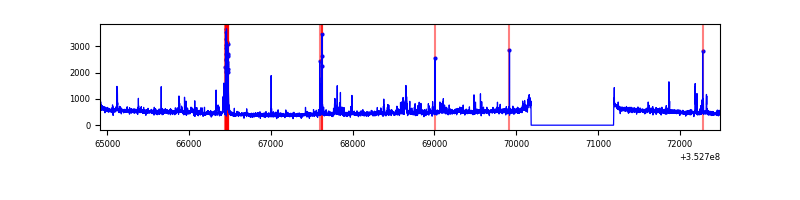 |
| C | 7580 | 6571 | 0 | 0 | 0.00% | 0.00% | 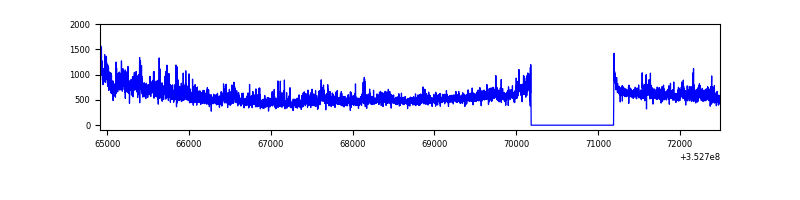 |
| D | 7579 | 6570 | 613 | 613 | 8.09% | 9.33% | 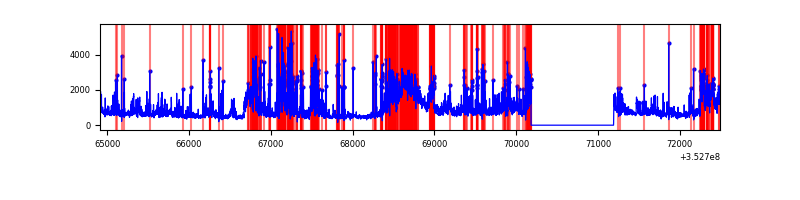 |
Top three noisy pixels from each quadrant. If the there are fewer than three noisy pixels in the level2.evt file, extra rows are filled as -1
| Pixel properties | Quadrant properties | ||||||
|---|---|---|---|---|---|---|---|
| Quadrant | DetID | PixID | Counts | Sigma | Mean | Median | Sigma |
| A | 0 | 13 | 41635 | 255.94 | 794 | 778 | 159.6 |
| A | 13 | 254 | 10602 | 61.54 | 794 | 778 | 159.6 |
| A | 3 | 137 | 7973 | 45.07 | 794 | 778 | 159.6 |
| B | 5 | 255 | 126558 | 819.26 | 795 | 773 | 153.5 |
| B | 0 | 229 | 124145 | 803.54 | 795 | 773 | 153.5 |
| B | 10 | 245 | 33365 | 212.28 | 795 | 773 | 153.5 |
| C | 3 | 233 | 538114 | 2984.25 | 768 | 772 | 180.1 |
| C | 14 | 238 | 150882 | 833.67 | 768 | 772 | 180.1 |
| C | 10 | 9 | 96672 | 532.6 | 768 | 772 | 180.1 |
| D | 12 | 33 | 1720491 | 9784.86 | 742 | 723 | 175.8 |
| D | 1 | 52 | 1063433 | 6046.43 | 742 | 723 | 175.8 |
| D | 8 | 195 | 642720 | 3652.73 | 742 | 723 | 175.8 |
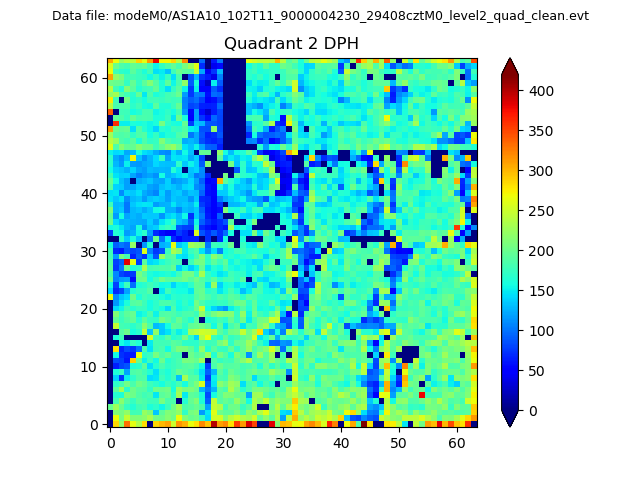
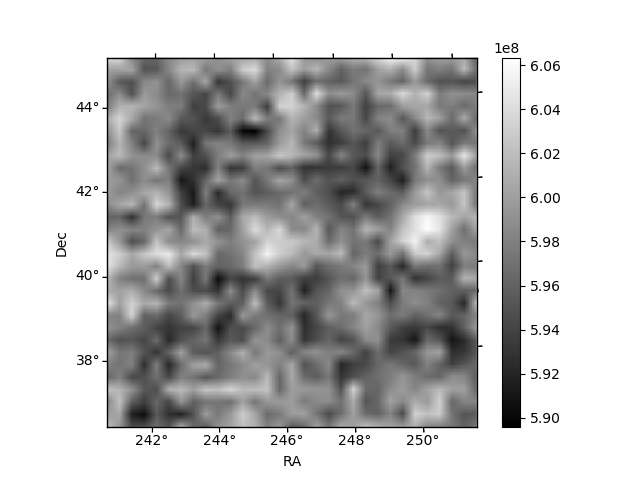
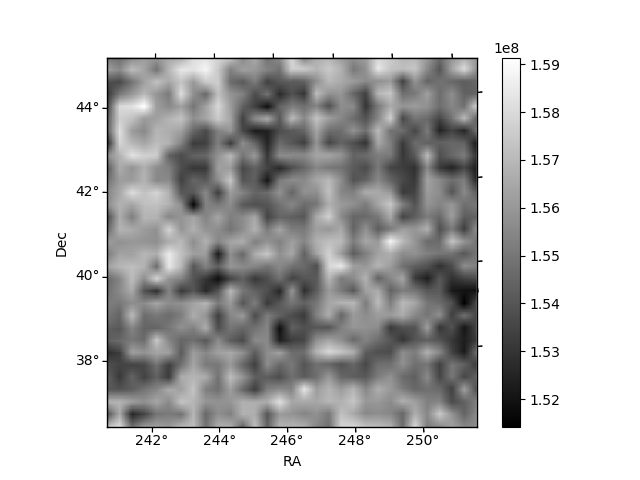
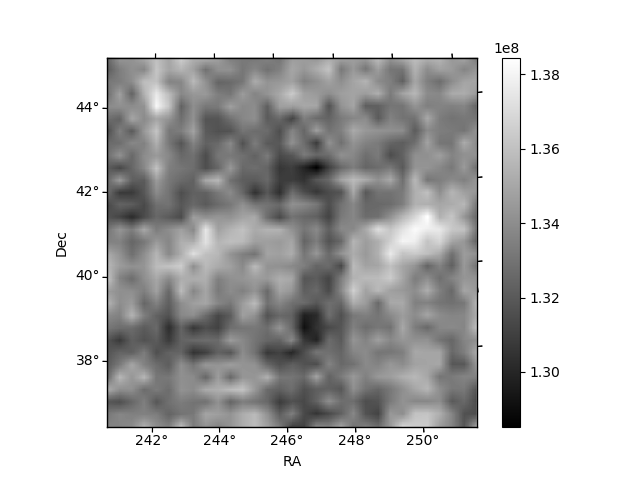
Histogram calculated using DETX and DETY for each event in the final _common_clean file
| Quadrant A | 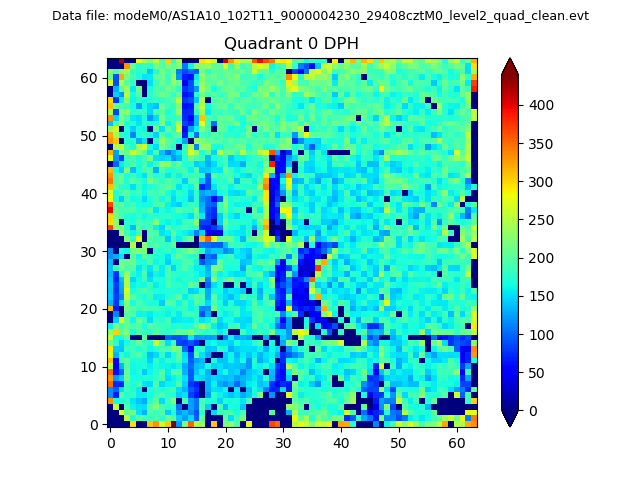 |
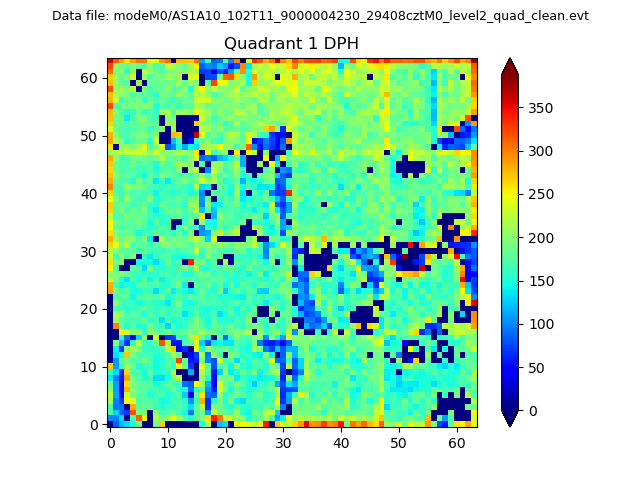 |
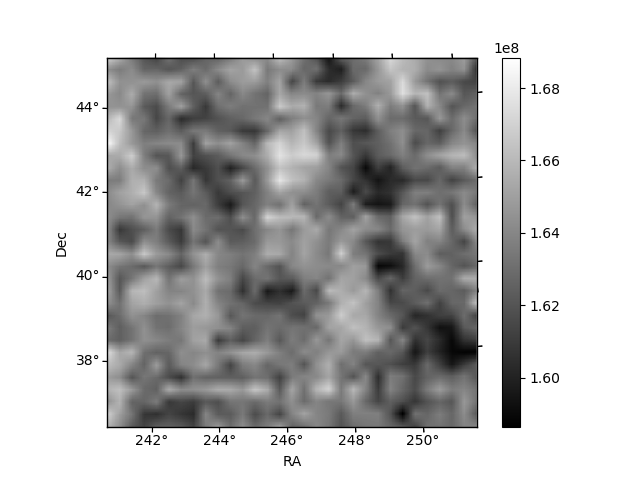
Quadrant B |
|---|---|---|---|
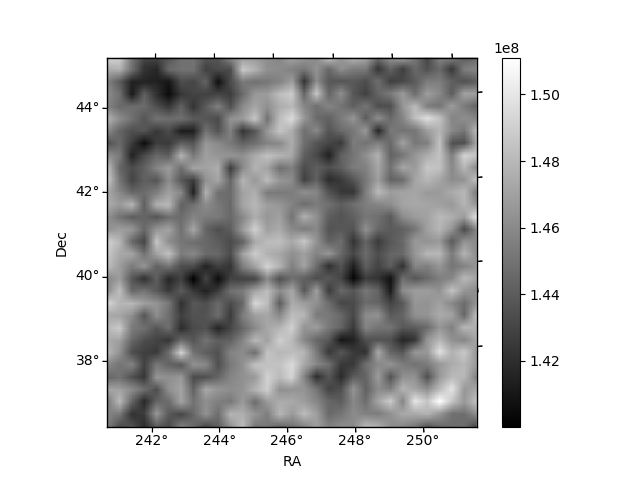
| Quadrant D | 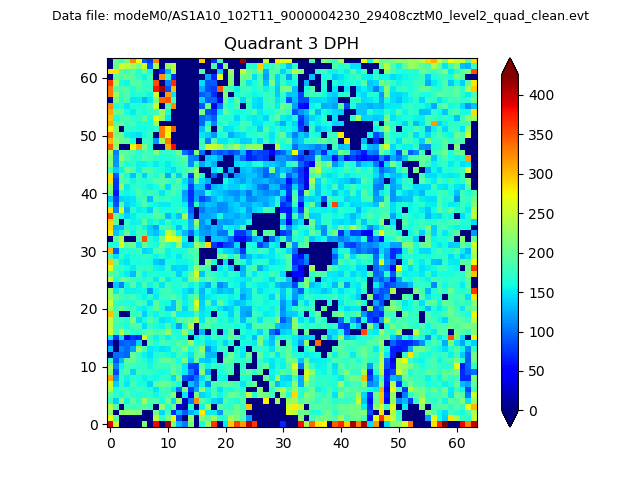 |
 |
Quadrant C |
| Plot type | Count rate plots | Images |
|---|---|---|
| Comparison with Poisson distribution Blue bars denote a histogram of data divided into 1 sec bins. Red curve is a Poisson curve with rate = median count rate of data. |
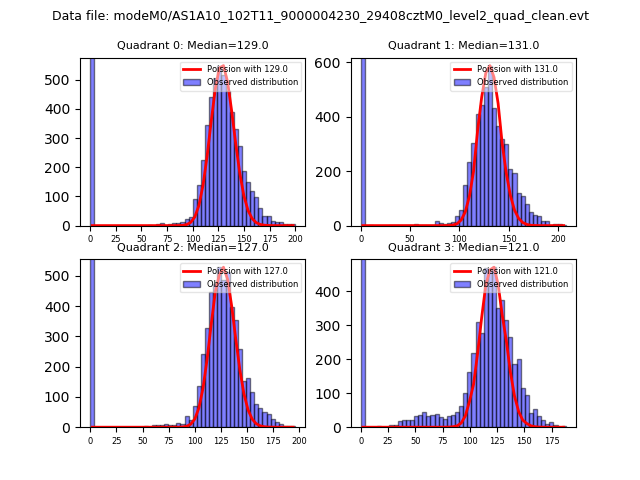 |
 |
| Quadrant-wise count rates Data is divided into 100 sec bins |
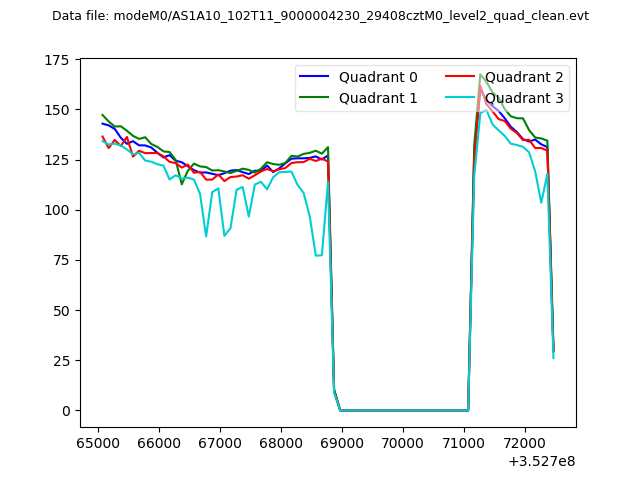 |
|
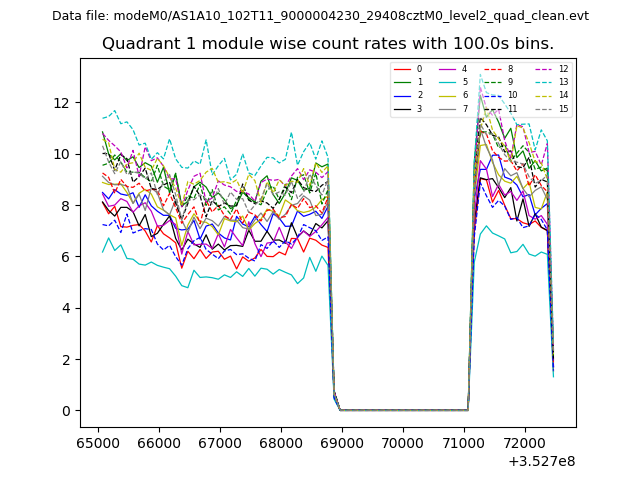
| Module-wise count rates for Quadrant A Data is divided into 100 sec bins |
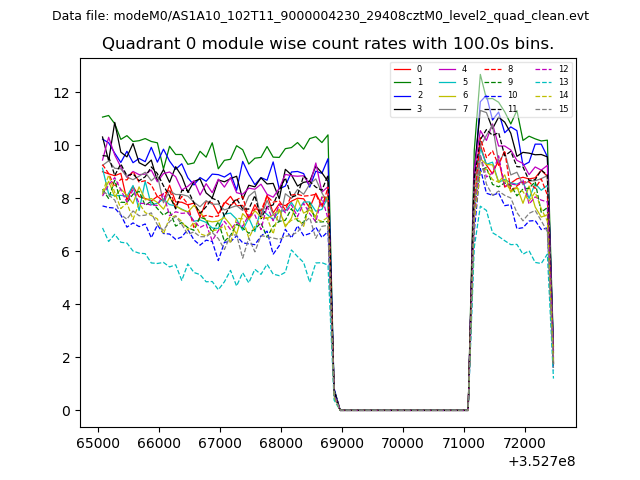 |
 |
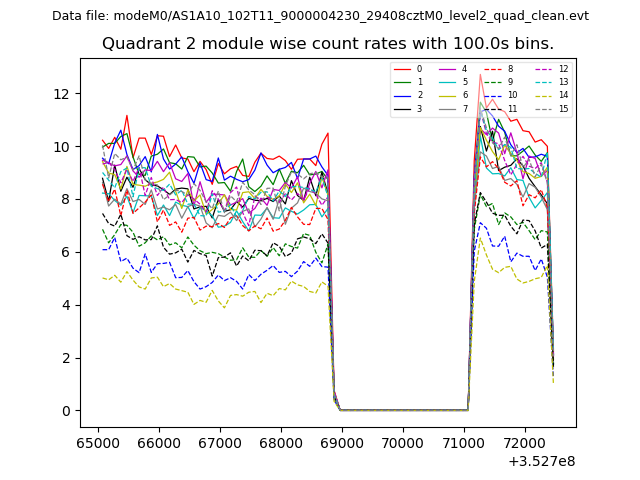
| Module-wise count rates for Quadrant B Data is divided into 100 sec bins |
 |
 |
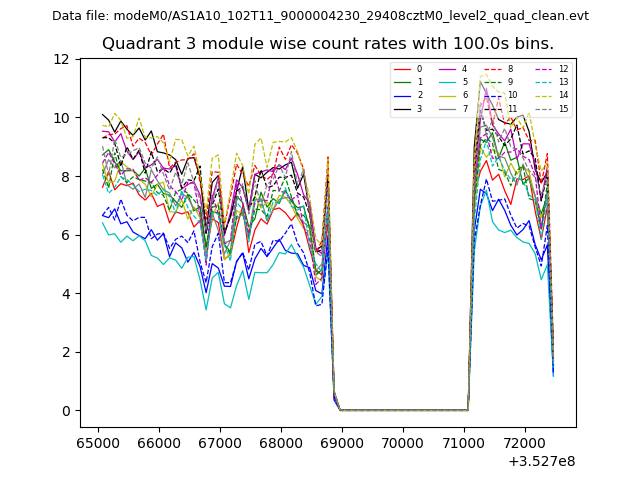
| Module-wise count rates for Quadrant C Data is divided into 100 sec bins |
 |
 |
| Module-wise count rates for Quadrant D Data is divided into 100 sec bins |
 |
 |
| Parameter | Plot |
|---|---|
| CZT HV Monitor | 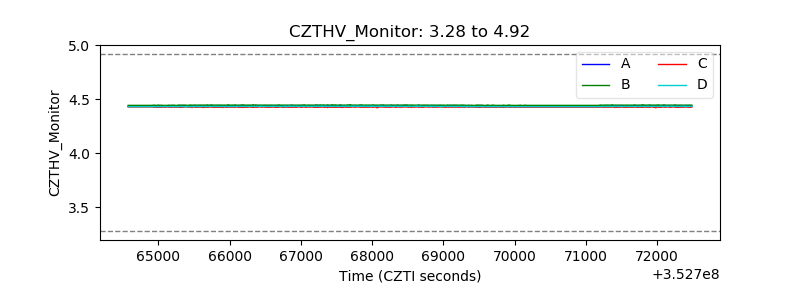 |
| D_VDD | 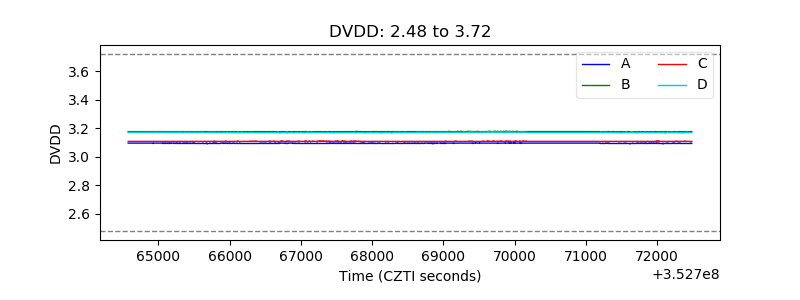 |
| Temperature 1 | 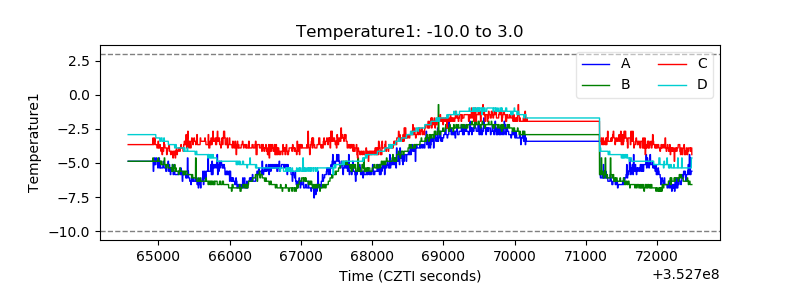 |
| Veto HV Monitor | 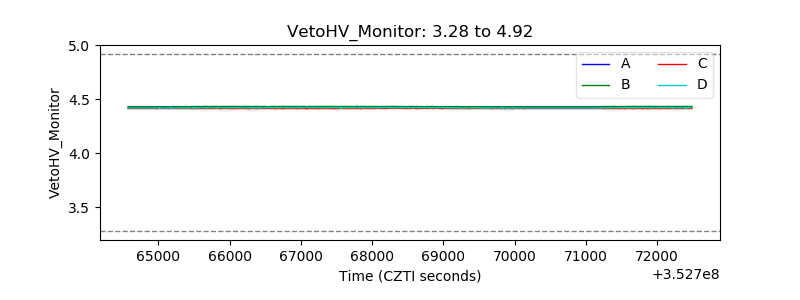 |
| Veto LLD | 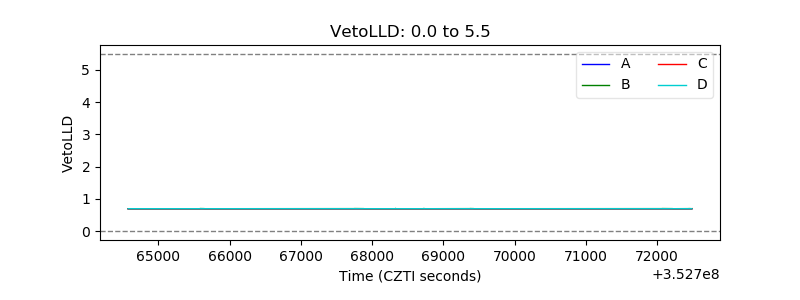 |
| Alpha Counter | 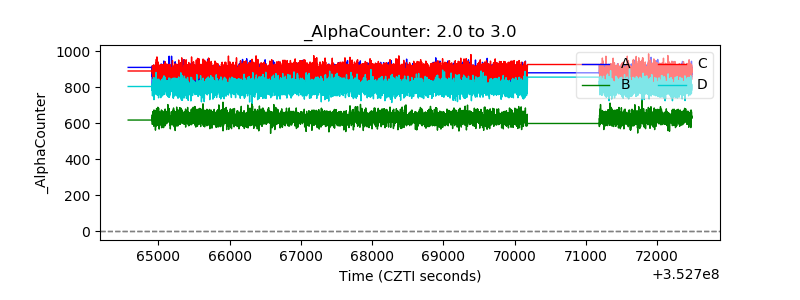 |
| _CPM_Rate | 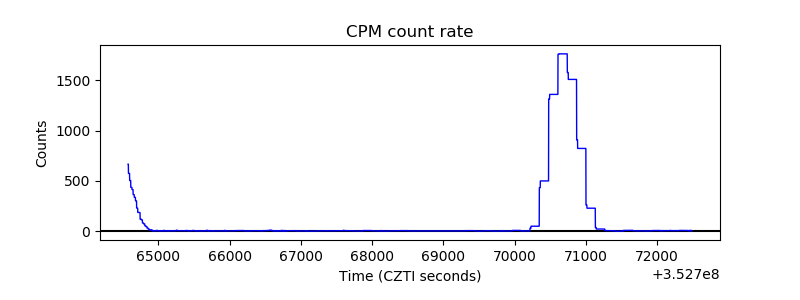 |
| CZT Counter | 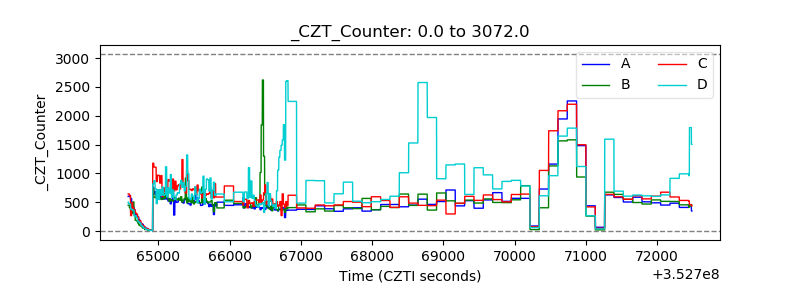 |
| +2.5 Volts monitor | 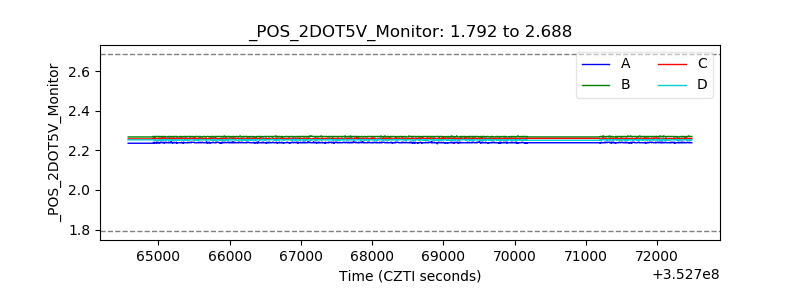 |
| +5 Volts monitor | 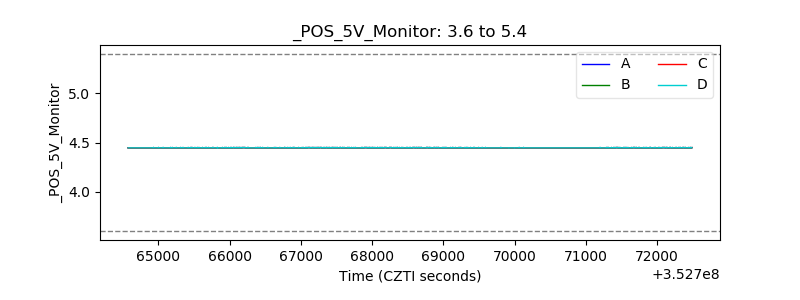 |
| _ROLL_ROT | 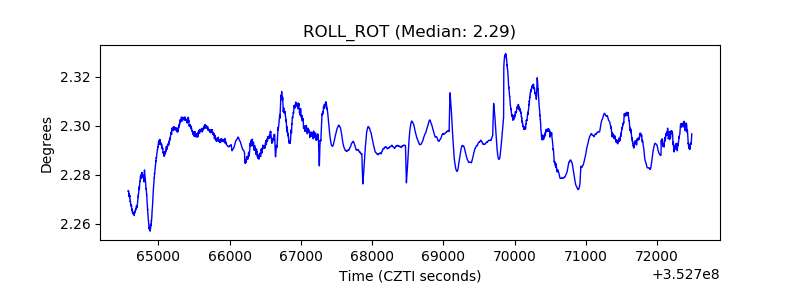 |
| _Roll_DEC | 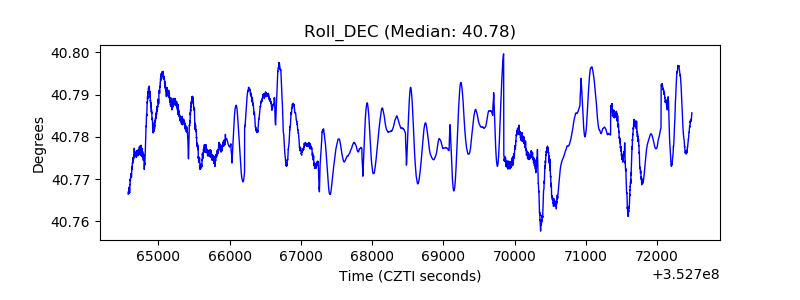 |
| _Roll_RA | 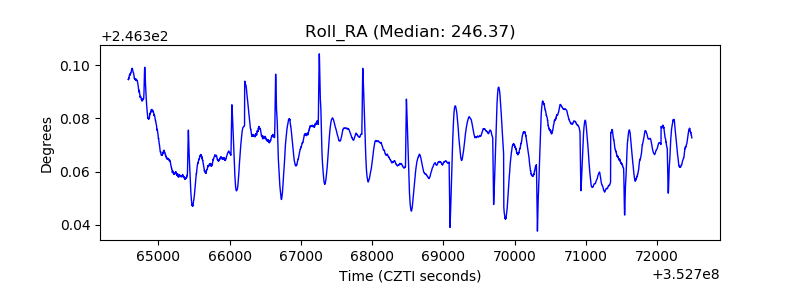 |
| Veto Counter | 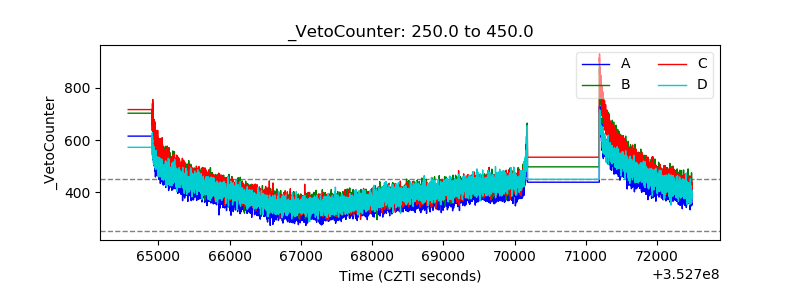 |