| Param | Original file | Final file |
|---|---|---|
| Filename | modeM0/AS1A10_102T11_9000004230_29411cztM0_level2.evt | modeM0/AS1A10_102T11_9000004230_29411cztM0_level2_quad_clean.evt |
| Size (bytes) | 571,348,800 | 98,507,520 |
| Size | 544.9 MB | 93.9 MB |
| Events in quadrant A | 3,065,523 | 647,385 |
| Events in quadrant B | 3,328,561 | 671,309 |
| Events in quadrant C | 3,786,780 | 631,504 |
| Events in quadrant D | 6,698,677 | 596,427 |
| Mode SS | |||
|---|---|---|---|
| Quadrant | BADHDUFLAG | Total packets | Discarded packets |
| A | 0 | 128 | 0 |
| B | 0 | 128 | 0 |
| C | 0 | 128 | 0 |
| D | 0 | 128 | 0 |
| Mode M0 | |||
|---|---|---|---|
| Quadrant | BADHDUFLAG | Total packets | Discarded packets |
| A | 0 | 13022 | 2 |
| B | 0 | 13830 | 2 |
| C | 0 | 15489 | 2 |
| D | 0 | 24195 | 2 |
| Mode M9 | |||
|---|---|---|---|
| Quadrant | BADHDUFLAG | Total packets | Discarded packets |
| A | 0 | 18 | 0 |
| B | 0 | 19 | 0 |
| C | 0 | 19 | 0 |
| D | 0 | 19 | 0 |
| Quadrant | Total seconds | Saturated seconds | Saturation percentage |
|---|---|---|---|
| A | 6254 | 8 | 0.127918% |
| B | 6254 | 42 | 0.671570% |
| C | 6254 | 102 | 1.630956% |
| D | 6254 | 1031 | 16.485449% |
Noise dominated data is calculated using 1-second bins in cleaned event files. If a bin has >2000 counts, and if more than 50% of those come from <1% of pixels, then it is considered to be noise-dominated and hence unusable.
| Quadrant | # 1 sec bins | Bins with >0 counts | Bins with >2000 counts | High rate bins dominated by noise | Noise dominated (total time) | Noise dominated (detector-on time) | Marked lightcurve |
|---|---|---|---|---|---|---|---|
| A | 7534 | 6255 | 0 | 0 | 0.00% | 0.00% | 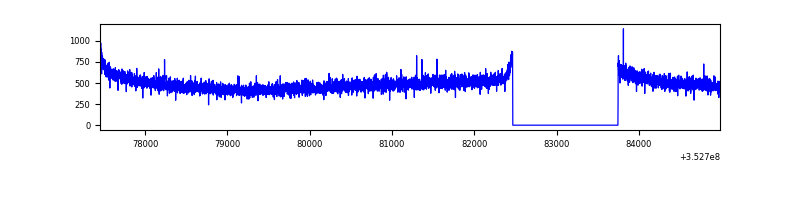 |
| B | 7534 | 6255 | 1 | 1 | 0.01% | 0.02% | 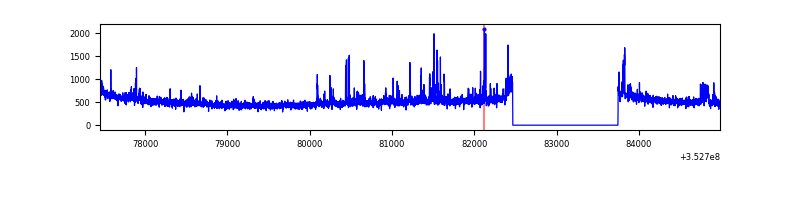 |
| C | 7534 | 6255 | 1 | 1 | 0.01% | 0.02% | 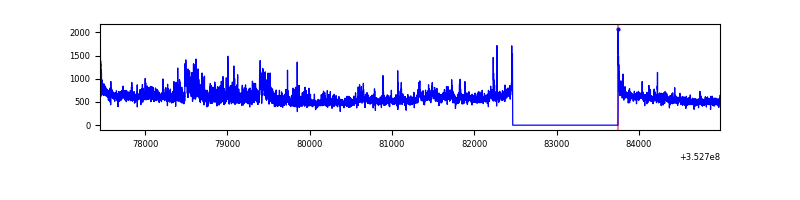 |
| D | 7534 | 6255 | 787 | 787 | 10.45% | 12.58% | 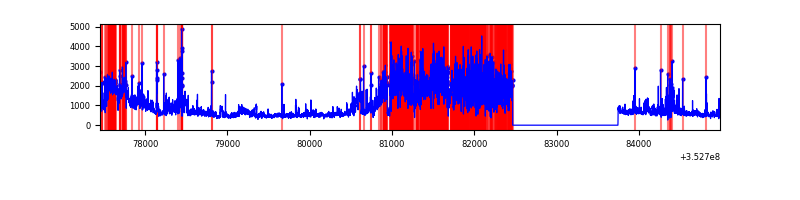 |
Top three noisy pixels from each quadrant. If the there are fewer than three noisy pixels in the level2.evt file, extra rows are filled as -1
| Pixel properties | Quadrant properties | ||||||
|---|---|---|---|---|---|---|---|
| Quadrant | DetID | PixID | Counts | Sigma | Mean | Median | Sigma |
| A | 13 | 254 | 11271 | 66.47 | 794 | 779 | 157.8 |
| A | 3 | 137 | 7222 | 40.82 | 794 | 779 | 157.8 |
| A | 0 | 226 | 6704 | 37.54 | 794 | 779 | 157.8 |
| B | 0 | 229 | 156079 | 1045.66 | 794 | 775 | 148.5 |
| B | 5 | 255 | 43928 | 290.55 | 794 | 775 | 148.5 |
| B | 12 | 111 | 17699 | 113.95 | 794 | 775 | 148.5 |
| C | 3 | 233 | 599267 | 3399.88 | 760 | 767 | 176.0 |
| C | 14 | 238 | 132347 | 747.46 | 760 | 767 | 176.0 |
| C | 10 | 9 | 61264 | 343.66 | 760 | 767 | 176.0 |
| D | 1 | 52 | 1485584 | 8849.41 | 714 | 695 | 167.8 |
| D | 12 | 33 | 824649 | 4910.47 | 714 | 695 | 167.8 |
| D | 7 | 80 | 798867 | 4756.82 | 714 | 695 | 167.8 |
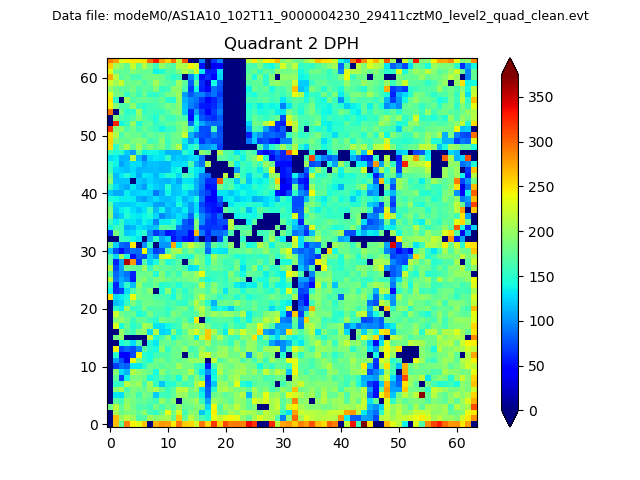
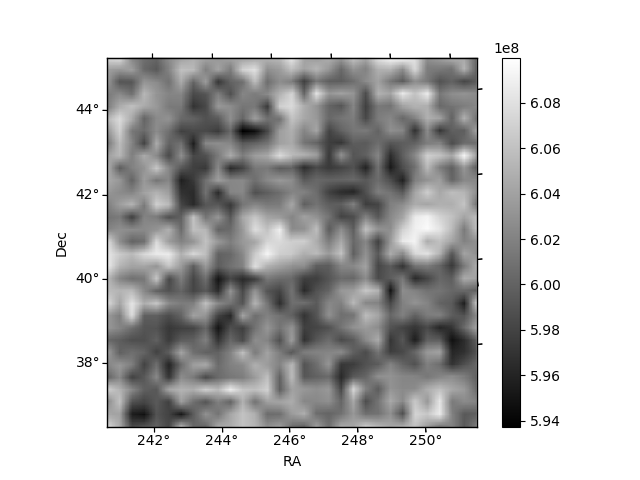
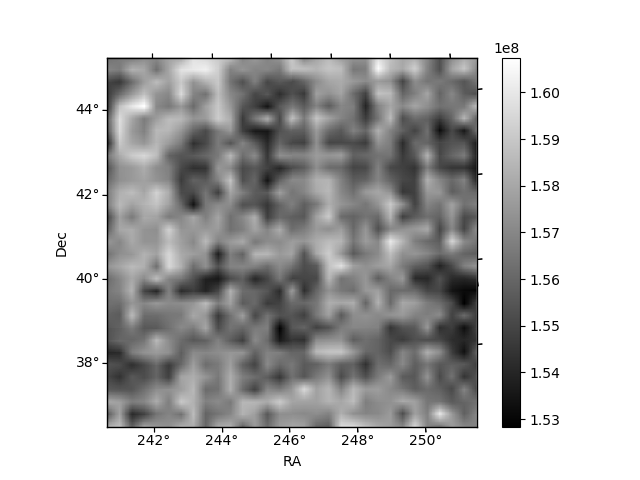
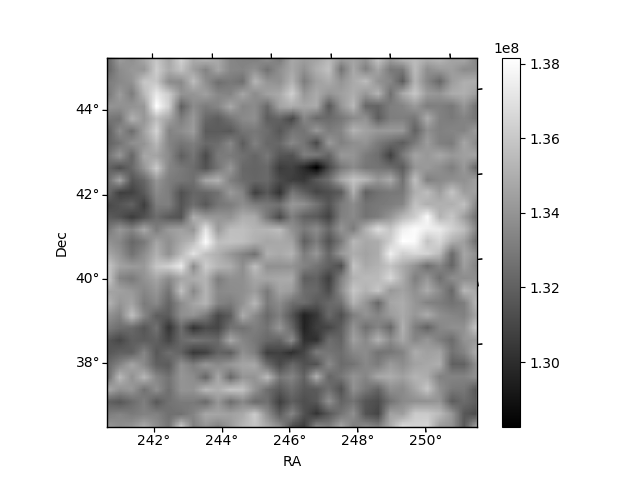
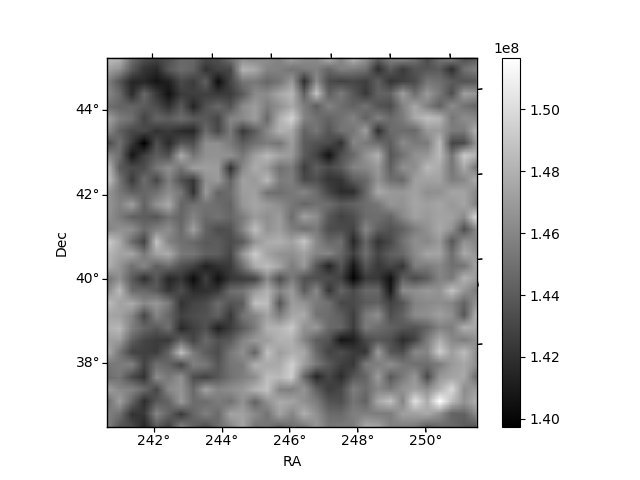
Histogram calculated using DETX and DETY for each event in the final _common_clean file
| Quadrant A | 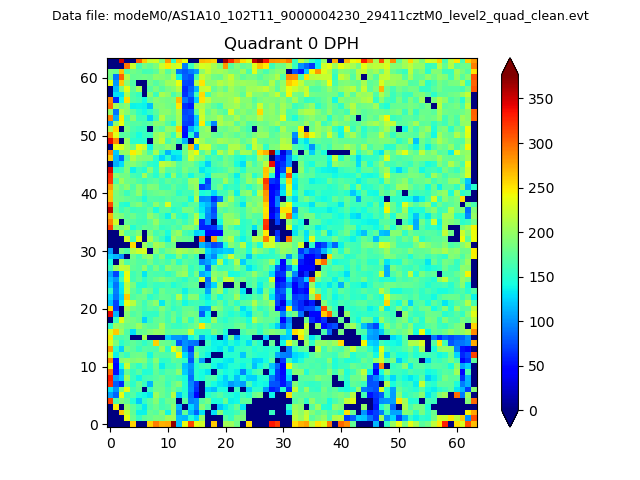 |
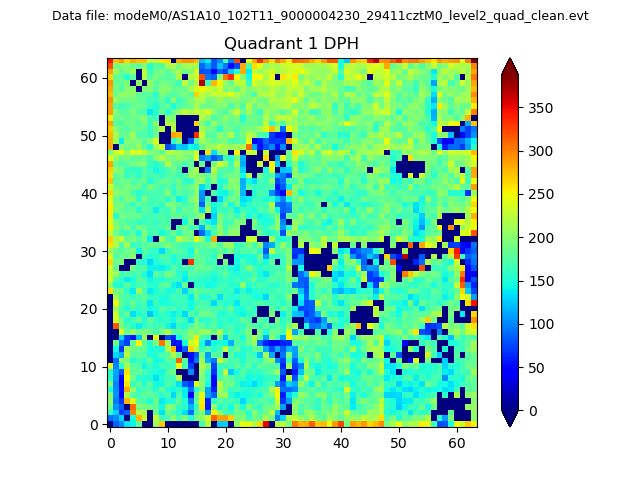 |
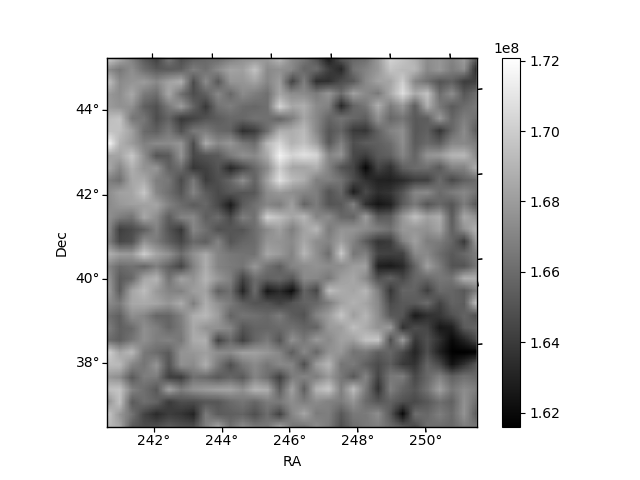
Quadrant B |
|---|---|---|---|
| Quadrant D | 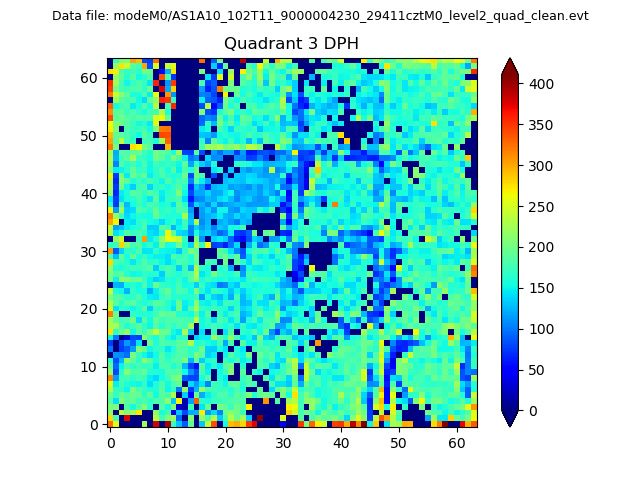 |
 |
Quadrant C |
| Plot type | Count rate plots | Images |
|---|---|---|
| Comparison with Poisson distribution Blue bars denote a histogram of data divided into 1 sec bins. Red curve is a Poisson curve with rate = median count rate of data. |
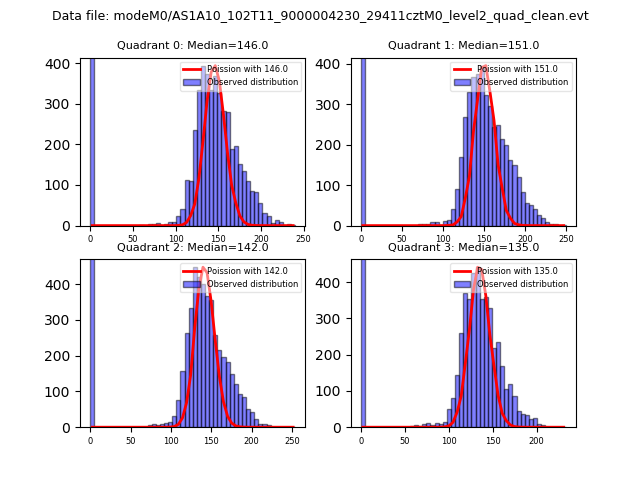 |
 |
| Quadrant-wise count rates Data is divided into 100 sec bins |
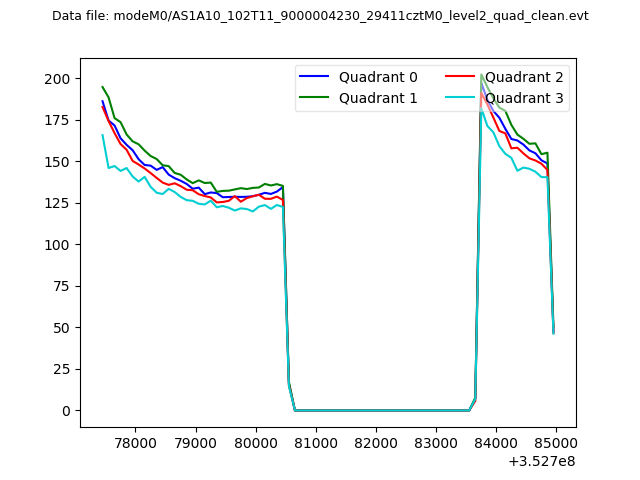 |
|
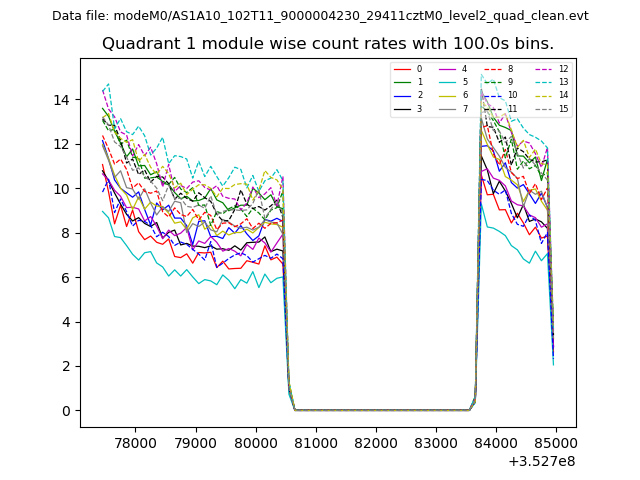
| Module-wise count rates for Quadrant A Data is divided into 100 sec bins |
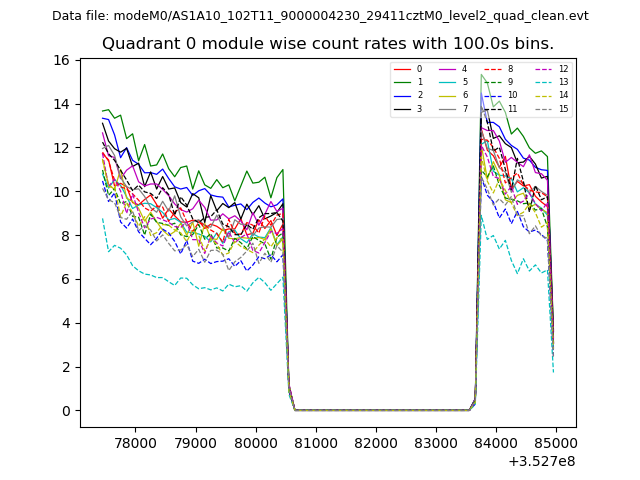 |
 |
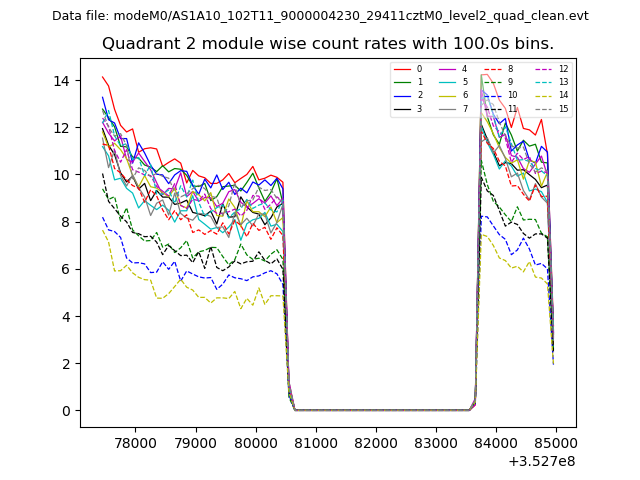
| Module-wise count rates for Quadrant B Data is divided into 100 sec bins |
 |
 |
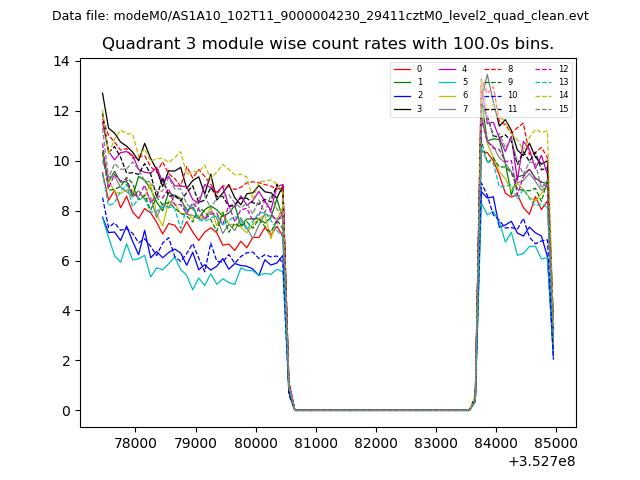
| Module-wise count rates for Quadrant C Data is divided into 100 sec bins |
 |
 |
| Module-wise count rates for Quadrant D Data is divided into 100 sec bins |
 |
 |
| Parameter | Plot |
|---|---|
| CZT HV Monitor | 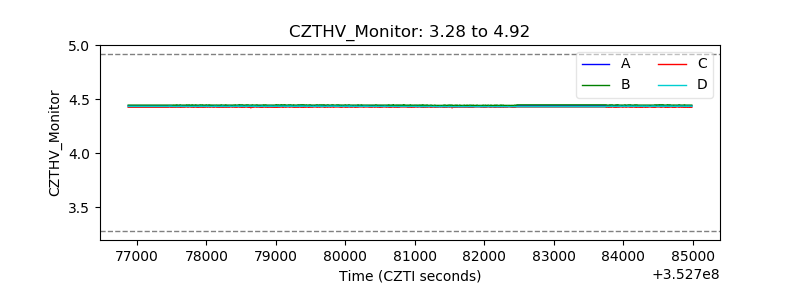 |
| D_VDD | 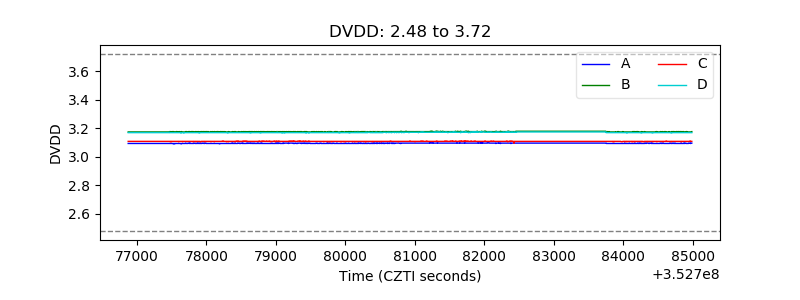 |
| Temperature 1 | 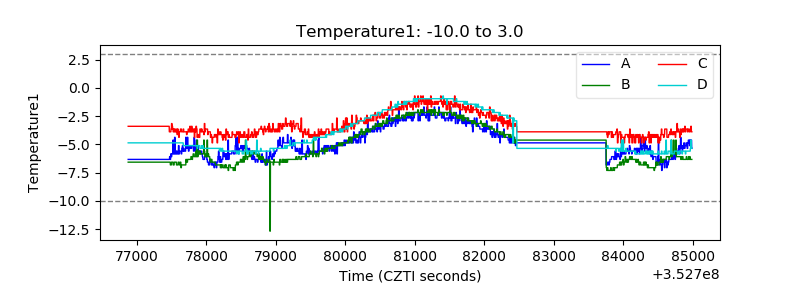 |
| Veto HV Monitor | 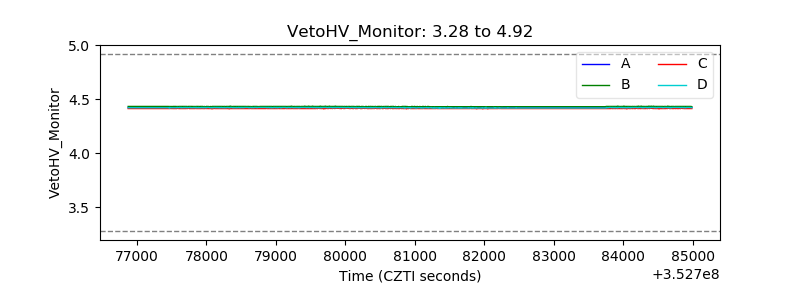 |
| Veto LLD | 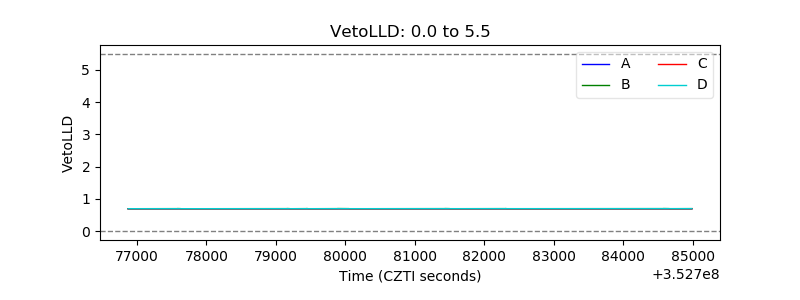 |
| Alpha Counter | 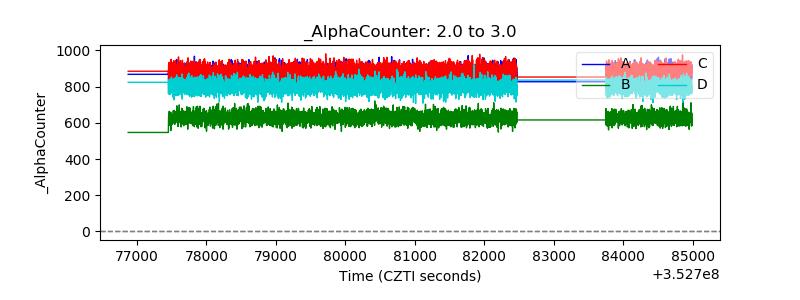 |
| _CPM_Rate | 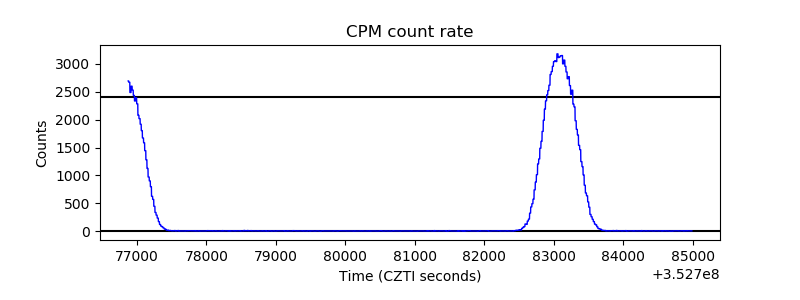 |
| CZT Counter | 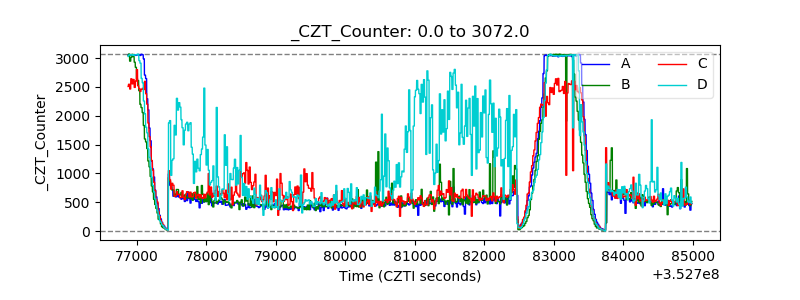 |
| +2.5 Volts monitor | 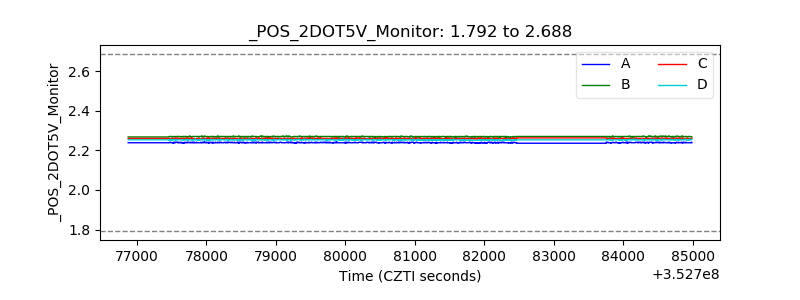 |
| +5 Volts monitor | 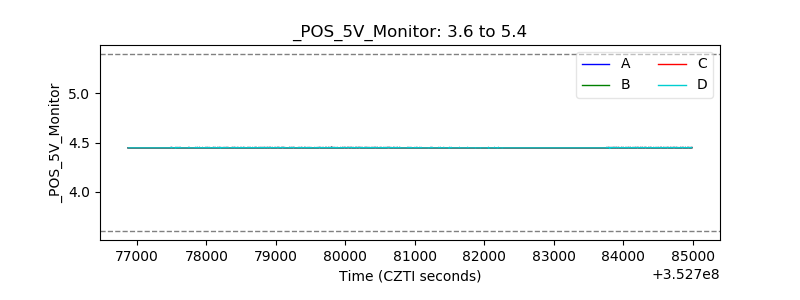 |
| _ROLL_ROT | 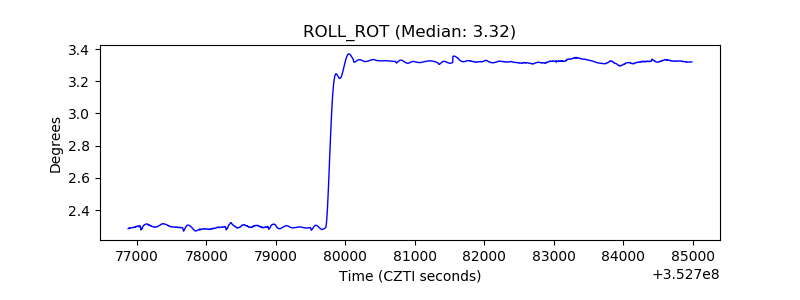 |
| _Roll_DEC | 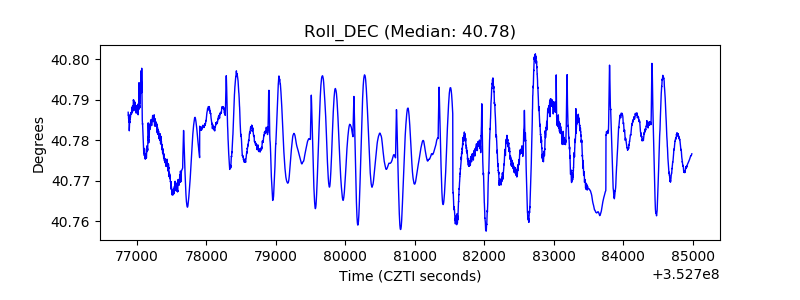 |
| _Roll_RA | 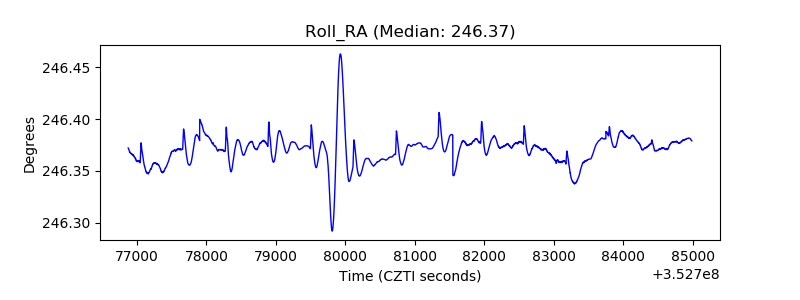 |
| Veto Counter | 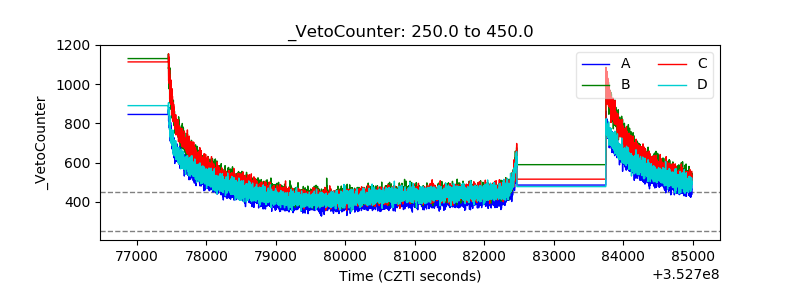 |