| Param | Original file | Final file |
|---|---|---|
| Filename | modeM0/AS1A10_102T11_9000004230_29413cztM0_level2.evt | modeM0/AS1A10_102T11_9000004230_29413cztM0_level2_quad_clean.evt |
| Size (bytes) | 636,114,240 | 82,160,640 |
| Size | 606.6 MB | 78.4 MB |
| Events in quadrant A | 2,844,510 | 550,230 |
| Events in quadrant B | 4,216,809 | 531,336 |
| Events in quadrant C | 7,090,093 | 506,658 |
| Events in quadrant D | 4,739,922 | 512,703 |
| Mode SS | |||
|---|---|---|---|
| Quadrant | BADHDUFLAG | Total packets | Discarded packets |
| A | 0 | 112 | 0 |
| B | 0 | 112 | 0 |
| C | 0 | 112 | 0 |
| D | 0 | 112 | 0 |
| Mode M0 | |||
|---|---|---|---|
| Quadrant | BADHDUFLAG | Total packets | Discarded packets |
| A | 0 | 11539 | 1 |
| B | 0 | 15766 | 1 |
| C | 0 | 24994 | 1 |
| D | 0 | 17895 | 1 |
| Mode M9 | |||
|---|---|---|---|
| Quadrant | BADHDUFLAG | Total packets | Discarded packets |
| A | 0 | 14 | 0 |
| B | 0 | 14 | 0 |
| C | 0 | 14 | 0 |
| D | 0 | 14 | 0 |
| Quadrant | Total seconds | Saturated seconds | Saturation percentage |
|---|---|---|---|
| A | 5528 | 29 | 0.524602% |
| B | 5529 | 607 | 10.978477% |
| C | 5529 | 1199 | 21.685657% |
| D | 5529 | 376 | 6.800506% |
Noise dominated data is calculated using 1-second bins in cleaned event files. If a bin has >2000 counts, and if more than 50% of those come from <1% of pixels, then it is considered to be noise-dominated and hence unusable.
| Quadrant | # 1 sec bins | Bins with >0 counts | Bins with >2000 counts | High rate bins dominated by noise | Noise dominated (total time) | Noise dominated (detector-on time) | Marked lightcurve |
|---|---|---|---|---|---|---|---|
| A | 6858 | 5529 | 0 | 0 | 0.00% | 0.00% | 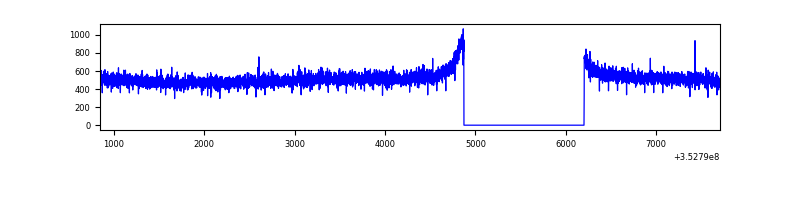 |
| B | 6859 | 5530 | 419 | 419 | 6.11% | 7.58% | 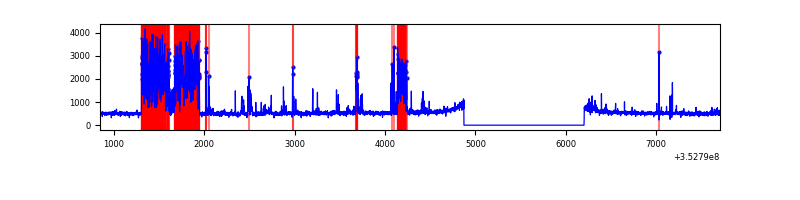 |
| C | 6859 | 5530 | 622 | 622 | 9.07% | 11.25% | 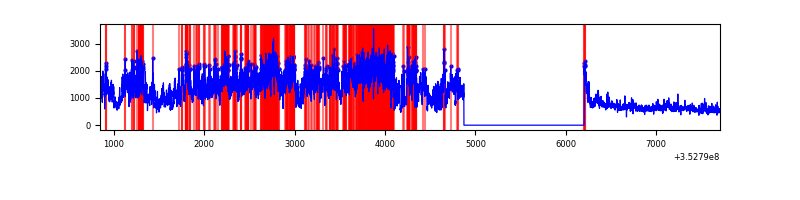 |
| D | 6859 | 5530 | 234 | 234 | 3.41% | 4.23% | 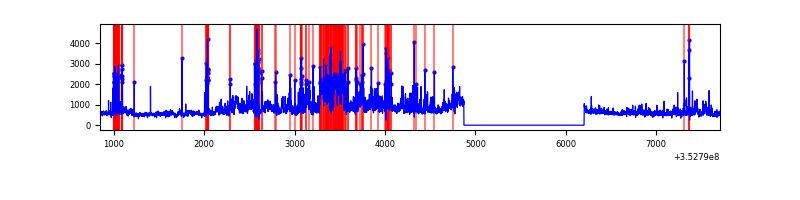 |
Top three noisy pixels from each quadrant. If the there are fewer than three noisy pixels in the level2.evt file, extra rows are filled as -1
| Pixel properties | Quadrant properties | ||||||
|---|---|---|---|---|---|---|---|
| Quadrant | DetID | PixID | Counts | Sigma | Mean | Median | Sigma |
| A | 13 | 254 | 9808 | 61.97 | 736 | 724 | 146.6 |
| A | 3 | 137 | 6591 | 40.03 | 736 | 724 | 146.6 |
| A | 0 | 226 | 6405 | 38.76 | 736 | 724 | 146.6 |
| B | 10 | 245 | 1280975 | 9811.76 | 701 | 685 | 130.5 |
| B | 0 | 229 | 129799 | 989.49 | 701 | 685 | 130.5 |
| B | 5 | 255 | 35679 | 268.18 | 701 | 685 | 130.5 |
| C | 3 | 233 | 4393511 | 28861.01 | 660 | 666 | 152.2 |
| C | 14 | 238 | 107651 | 702.89 | 660 | 666 | 152.2 |
| C | 2 | 114 | 12468 | 77.54 | 660 | 666 | 152.2 |
| D | 8 | 195 | 890947 | 5453.69 | 690 | 673 | 163.2 |
| D | 1 | 52 | 782252 | 4787.84 | 690 | 673 | 163.2 |
| D | 7 | 80 | 294464 | 1799.72 | 690 | 673 | 163.2 |
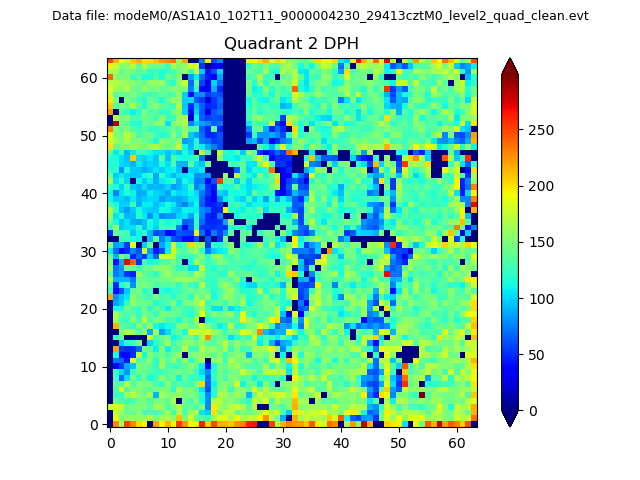
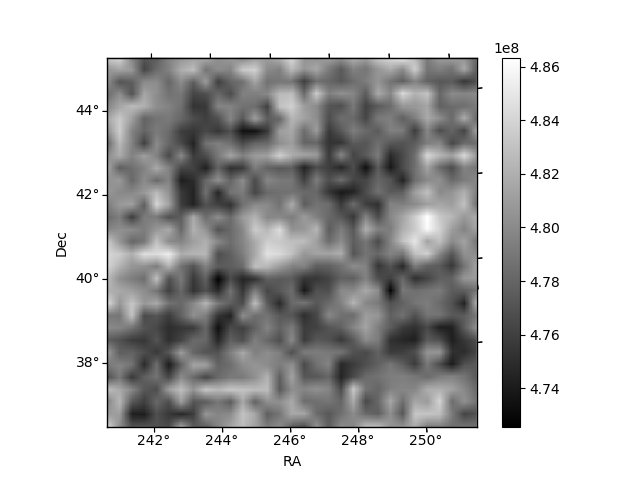
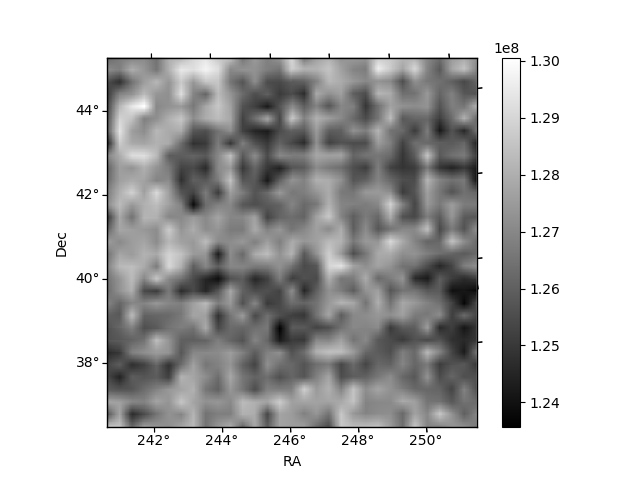
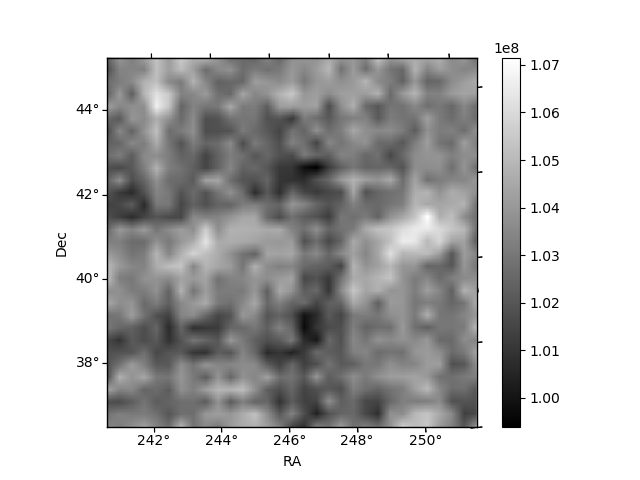
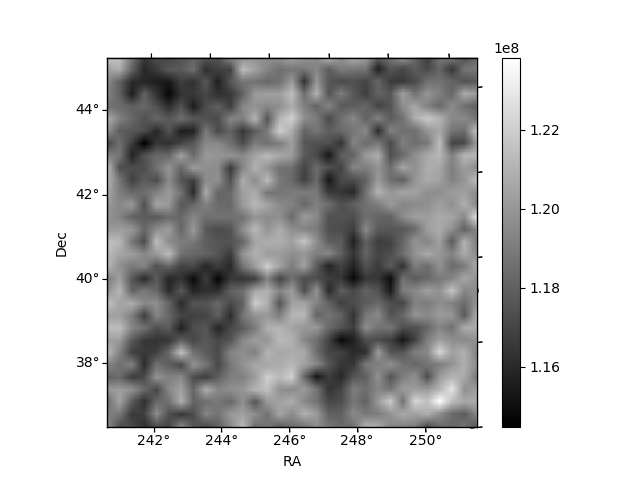
Histogram calculated using DETX and DETY for each event in the final _common_clean file
| Quadrant A | 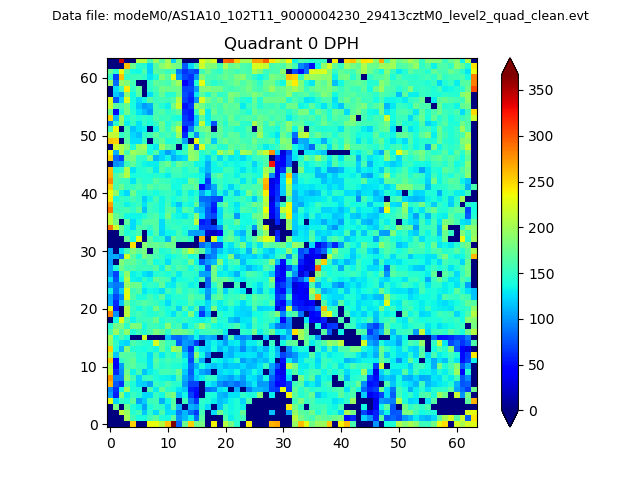 |
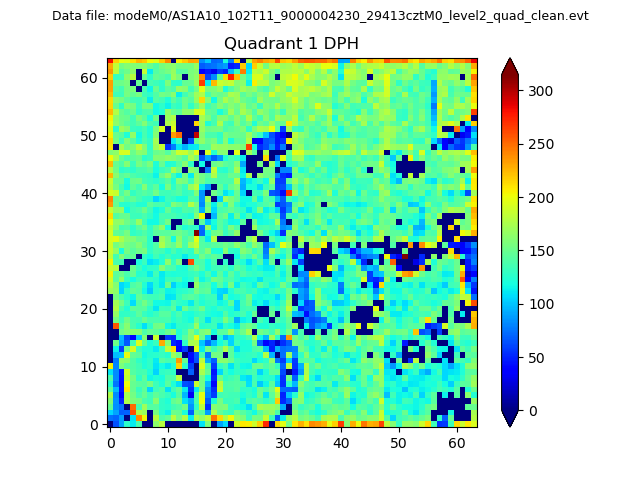 |
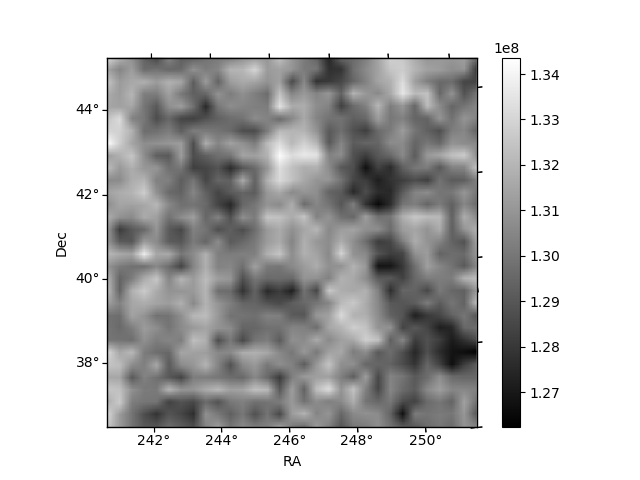
Quadrant B |
|---|---|---|---|
| Quadrant D | 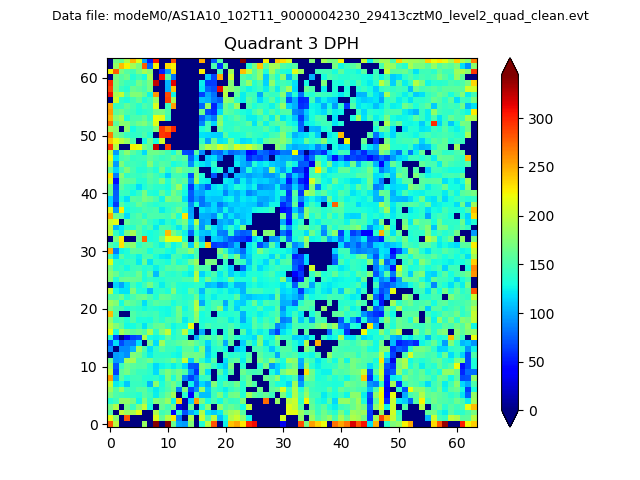 |
 |
Quadrant C |
| Plot type | Count rate plots | Images |
|---|---|---|
| Comparison with Poisson distribution Blue bars denote a histogram of data divided into 1 sec bins. Red curve is a Poisson curve with rate = median count rate of data. |
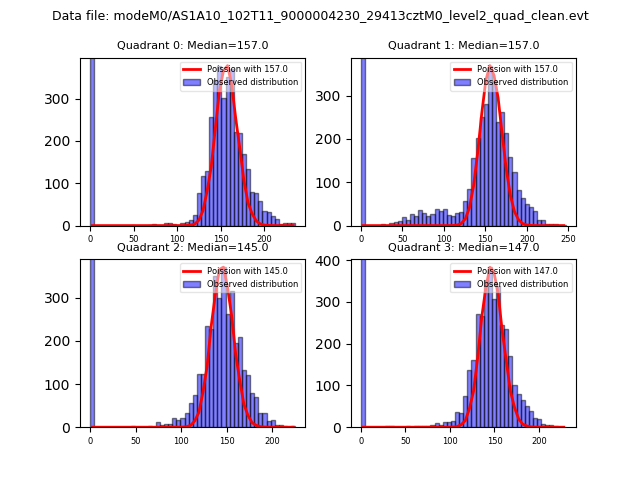 |
 |
| Quadrant-wise count rates Data is divided into 100 sec bins |
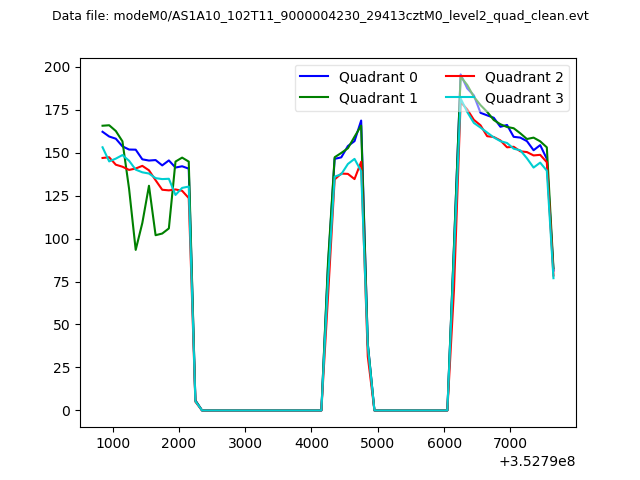 |
|
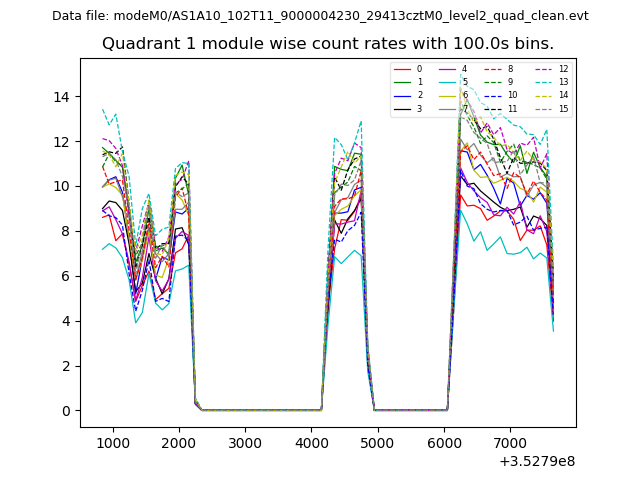
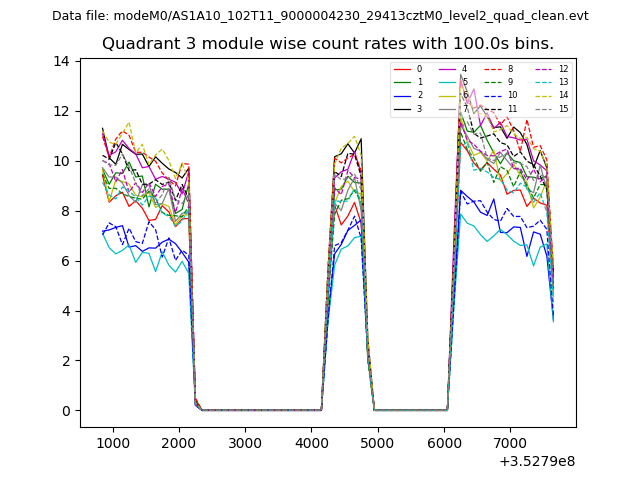
| Module-wise count rates for Quadrant A Data is divided into 100 sec bins |
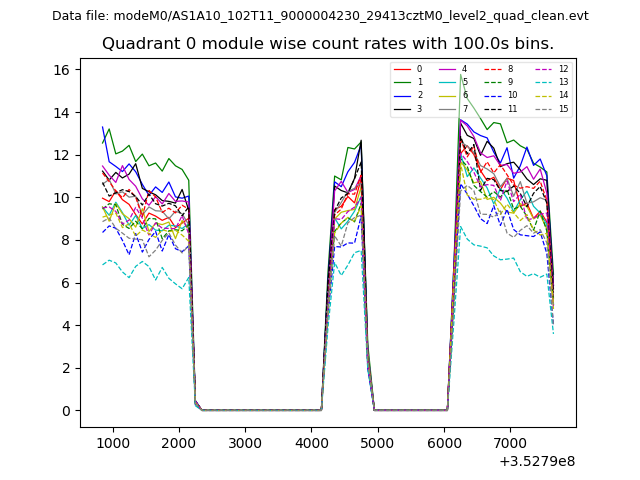 |
 |
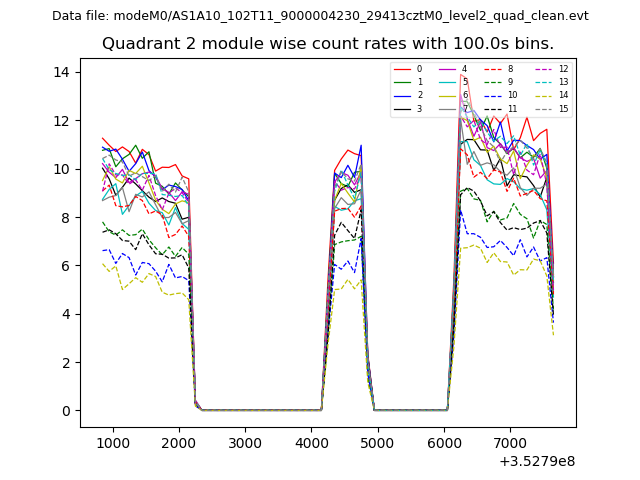
| Module-wise count rates for Quadrant B Data is divided into 100 sec bins |
 |
 |
| Module-wise count rates for Quadrant C Data is divided into 100 sec bins |
 |
 |
| Module-wise count rates for Quadrant D Data is divided into 100 sec bins |
 |
 |
| Parameter | Plot |
|---|---|
| CZT HV Monitor | 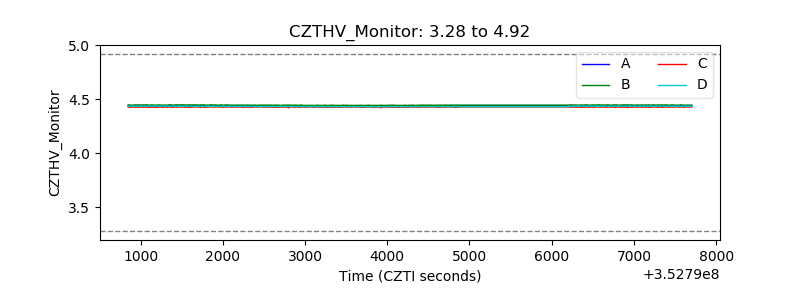 |
| D_VDD | 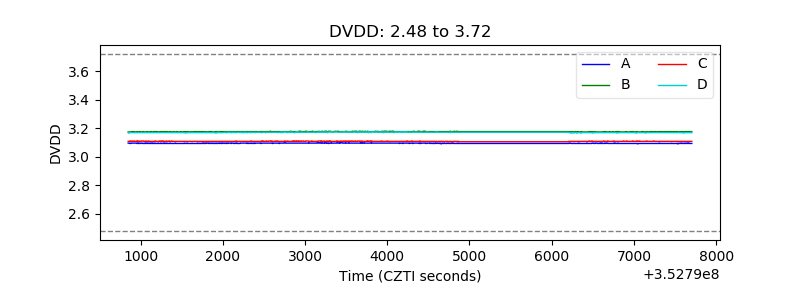 |
| Temperature 1 | 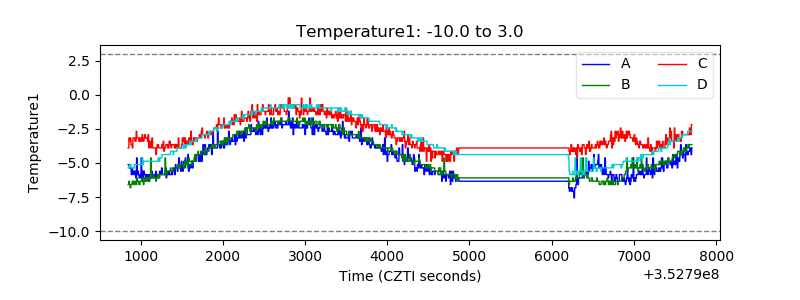 |
| Veto HV Monitor | 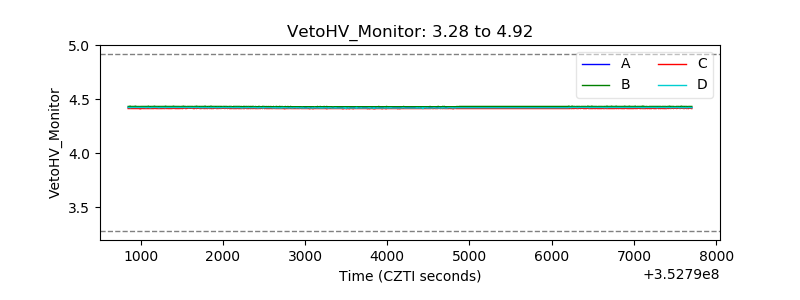 |
| Veto LLD | 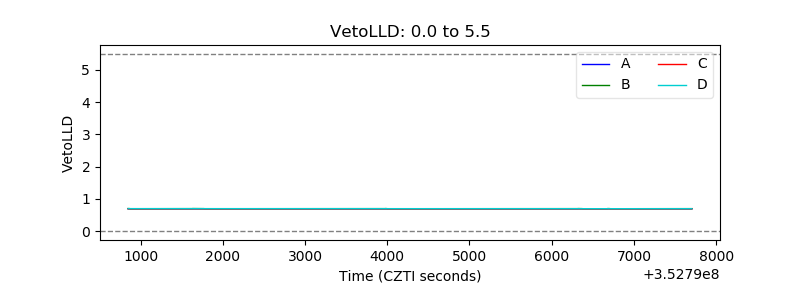 |
| Alpha Counter | 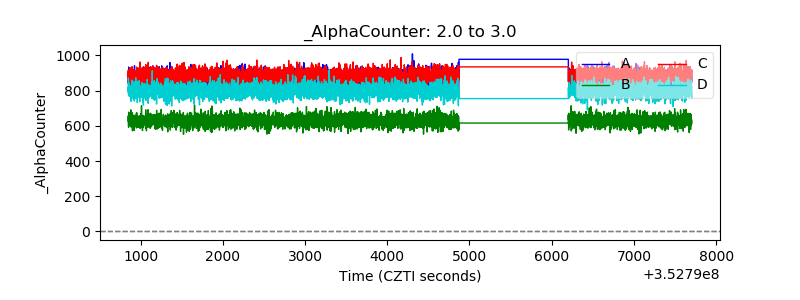 |
| _CPM_Rate | 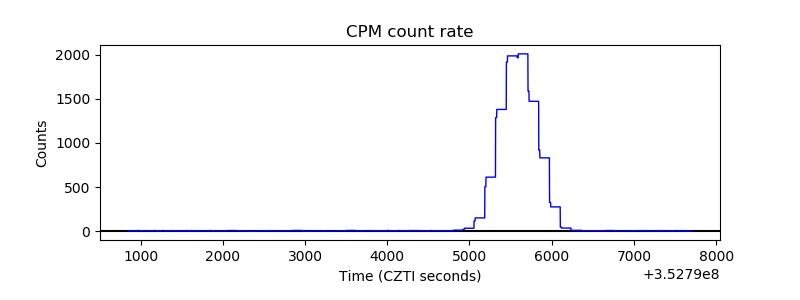 |
| CZT Counter | 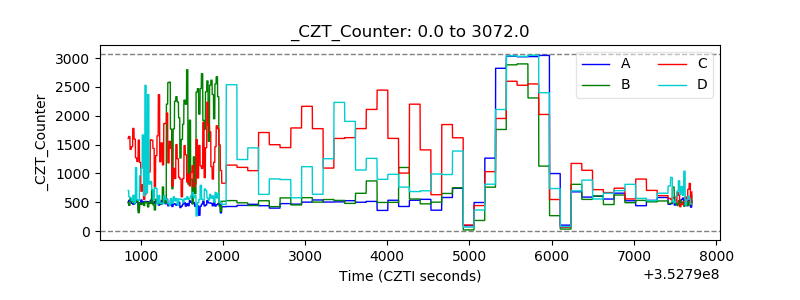 |
| +2.5 Volts monitor | 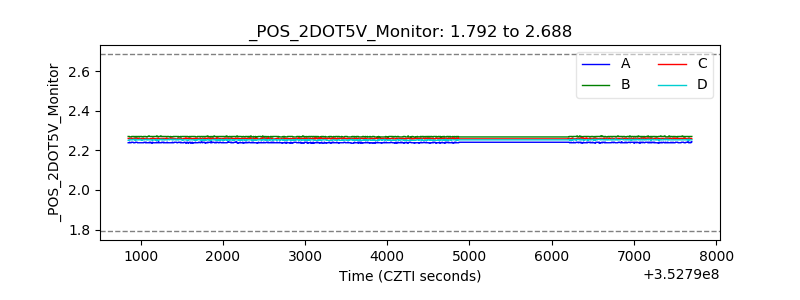 |
| +5 Volts monitor | 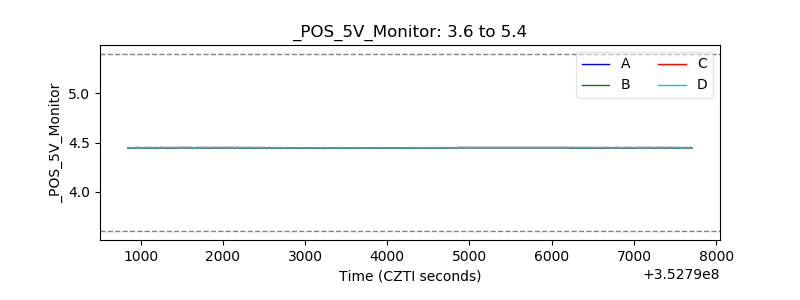 |
| _ROLL_ROT | 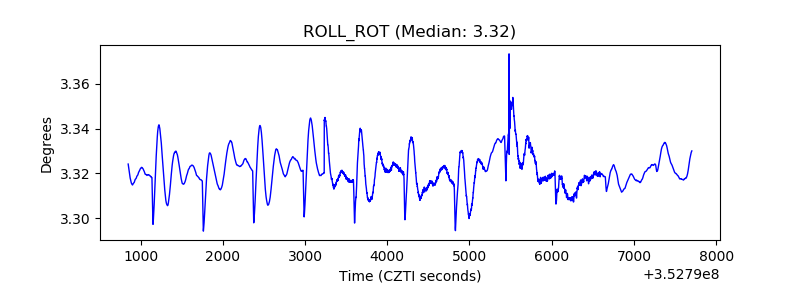 |
| _Roll_DEC | 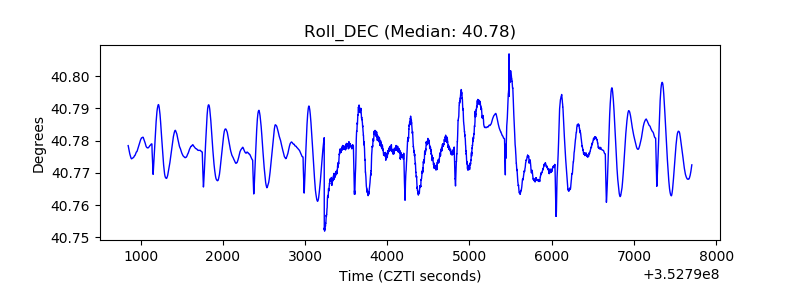 |
| _Roll_RA | 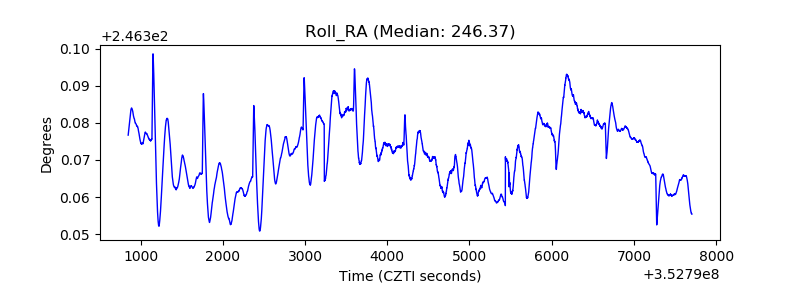 |
| Veto Counter | 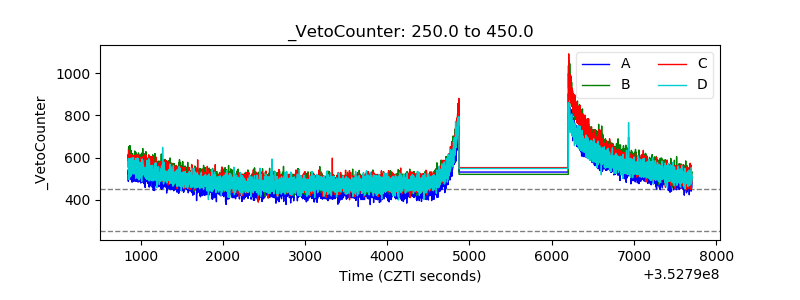 |