| Param | Original file | Final file |
|---|---|---|
| Filename | modeM0/AS1A10_102T11_9000004230_29414cztM0_level2.evt | modeM0/AS1A10_102T11_9000004230_29414cztM0_level2_quad_clean.evt |
| Size (bytes) | 588,026,880 | 94,924,800 |
| Size | 560.8 MB | 90.5 MB |
| Events in quadrant A | 3,146,165 | 630,776 |
| Events in quadrant B | 3,993,880 | 633,830 |
| Events in quadrant C | 5,192,539 | 595,552 |
| Events in quadrant D | 5,062,640 | 587,707 |
| Mode SS | |||
|---|---|---|---|
| Quadrant | BADHDUFLAG | Total packets | Discarded packets |
| A | 0 | 126 | 0 |
| B | 0 | 126 | 0 |
| C | 0 | 126 | 0 |
| D | 0 | 126 | 0 |
| Mode M0 | |||
|---|---|---|---|
| Quadrant | BADHDUFLAG | Total packets | Discarded packets |
| A | 0 | 12692 | 1 |
| B | 0 | 15608 | 1 |
| C | 0 | 19821 | 1 |
| D | 0 | 19191 | 1 |
| Mode M9 | |||
|---|---|---|---|
| Quadrant | BADHDUFLAG | Total packets | Discarded packets |
| A | 0 | 12 | 0 |
| B | 0 | 12 | 0 |
| C | 0 | 12 | 0 |
| D | 0 | 12 | 0 |
| Quadrant | Total seconds | Saturated seconds | Saturation percentage |
|---|---|---|---|
| A | 6104 | 98 | 1.605505% |
| B | 6105 | 270 | 4.422604% |
| C | 6105 | 325 | 5.323505% |
| D | 6105 | 330 | 5.405405% |
Noise dominated data is calculated using 1-second bins in cleaned event files. If a bin has >2000 counts, and if more than 50% of those come from <1% of pixels, then it is considered to be noise-dominated and hence unusable.
| Quadrant | # 1 sec bins | Bins with >0 counts | Bins with >2000 counts | High rate bins dominated by noise | Noise dominated (total time) | Noise dominated (detector-on time) | Marked lightcurve |
|---|---|---|---|---|---|---|---|
| A | 7329 | 6105 | 0 | 0 | 0.00% | 0.00% | 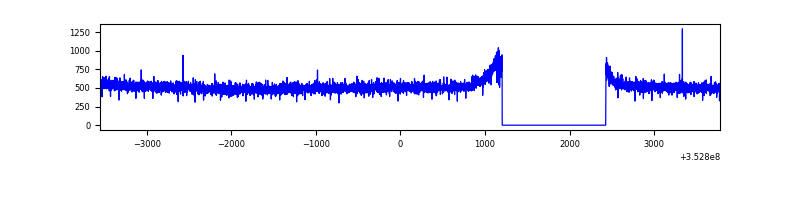 |
| B | 7330 | 6106 | 98 | 98 | 1.34% | 1.60% | 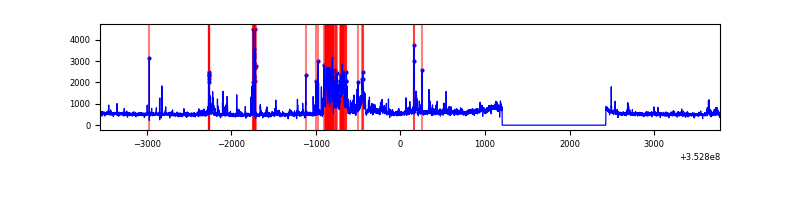 |
| C | 7330 | 6106 | 20 | 20 | 0.27% | 0.33% | 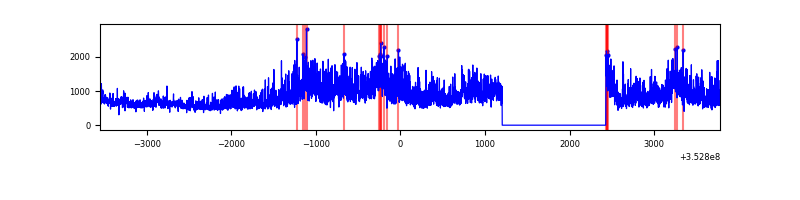 |
| D | 7330 | 6106 | 213 | 213 | 2.91% | 3.49% | 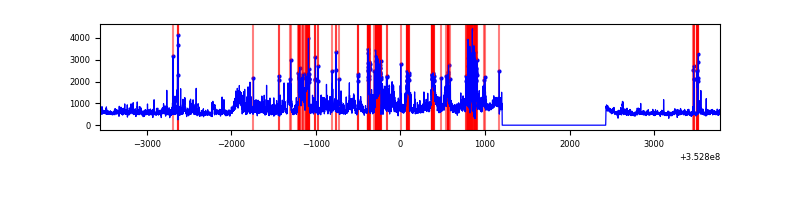 |
Top three noisy pixels from each quadrant. If the there are fewer than three noisy pixels in the level2.evt file, extra rows are filled as -1
| Pixel properties | Quadrant properties | ||||||
|---|---|---|---|---|---|---|---|
| Quadrant | DetID | PixID | Counts | Sigma | Mean | Median | Sigma |
| A | 13 | 254 | 11301 | 64.56 | 815 | 802 | 162.6 |
| A | 3 | 137 | 7386 | 40.49 | 815 | 802 | 162.6 |
| A | 0 | 226 | 7021 | 38.24 | 815 | 802 | 162.6 |
| B | 10 | 245 | 633926 | 4262.06 | 789 | 772 | 148.6 |
| B | 0 | 229 | 183741 | 1231.65 | 789 | 772 | 148.6 |
| B | 0 | 190 | 29909 | 196.14 | 789 | 772 | 148.6 |
| C | 3 | 233 | 2094977 | 12070.62 | 756 | 764 | 173.5 |
| C | 14 | 238 | 129232 | 740.46 | 756 | 764 | 173.5 |
| C | 2 | 114 | 14118 | 76.97 | 756 | 764 | 173.5 |
| D | 8 | 195 | 1011765 | 5596.16 | 769 | 750 | 180.7 |
| D | 1 | 52 | 514617 | 2844.35 | 769 | 750 | 180.7 |
| D | 7 | 80 | 389472 | 2151.65 | 769 | 750 | 180.7 |
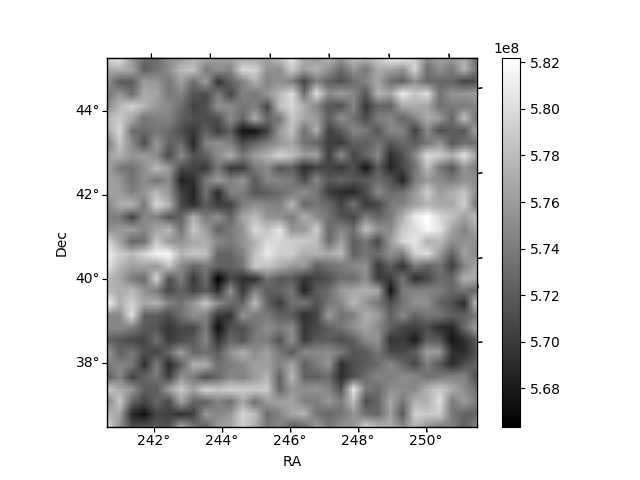
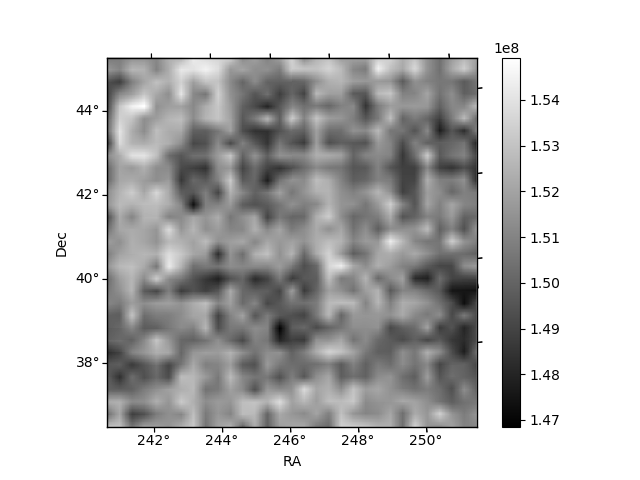
Histogram calculated using DETX and DETY for each event in the final _common_clean file
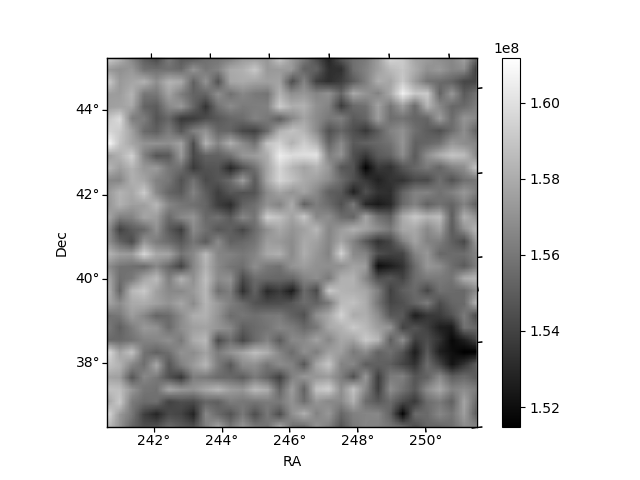
| Quadrant A | 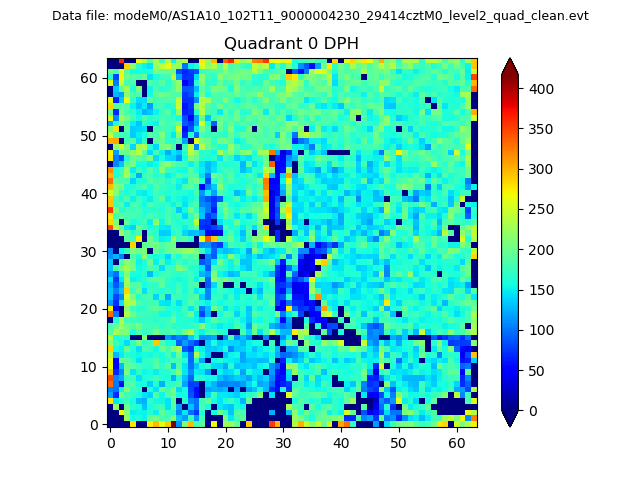 |
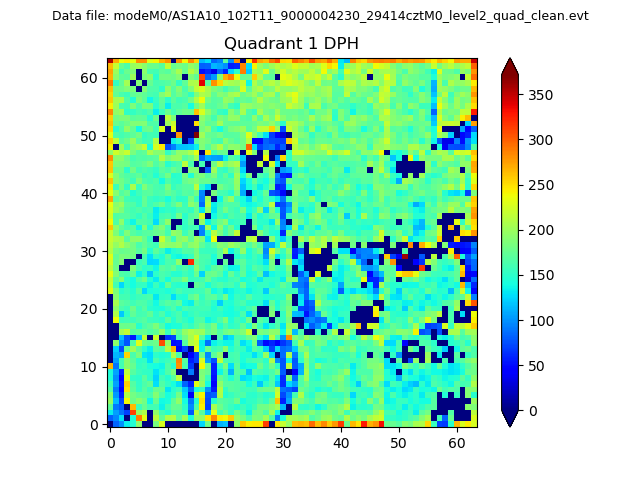 |
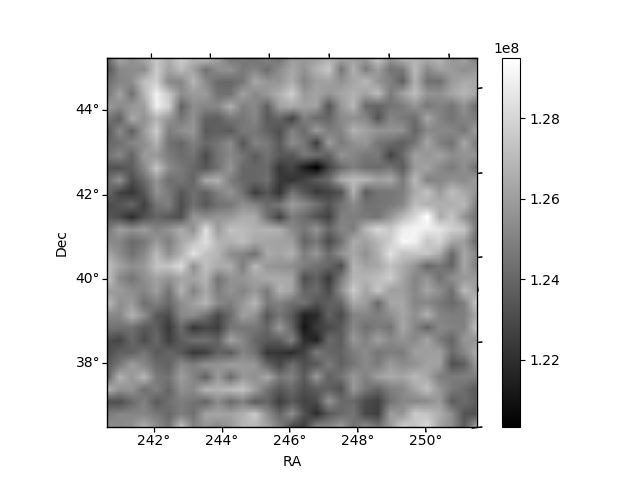
Quadrant B |
|---|---|---|---|
| Quadrant D | 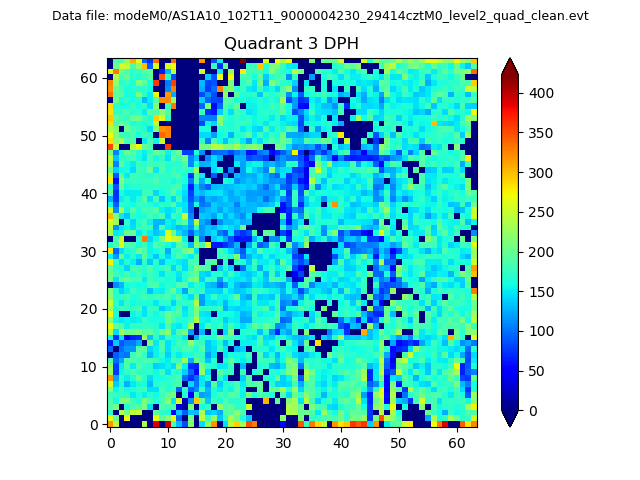 |
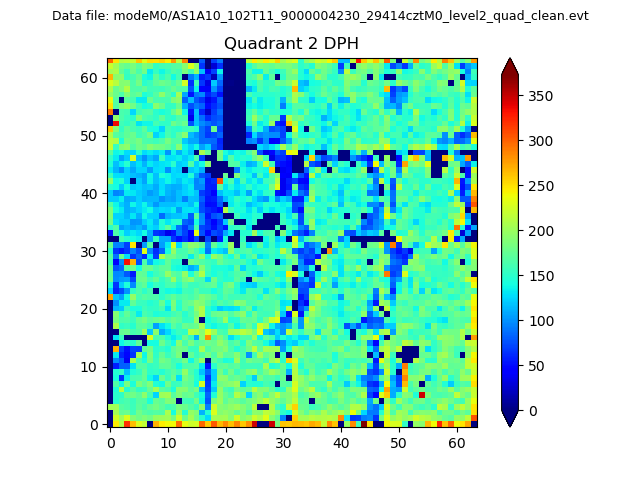 |
Quadrant C |
| Plot type | Count rate plots | Images |
|---|---|---|
| Comparison with Poisson distribution Blue bars denote a histogram of data divided into 1 sec bins. Red curve is a Poisson curve with rate = median count rate of data. |
 |
 |
| Quadrant-wise count rates Data is divided into 100 sec bins |
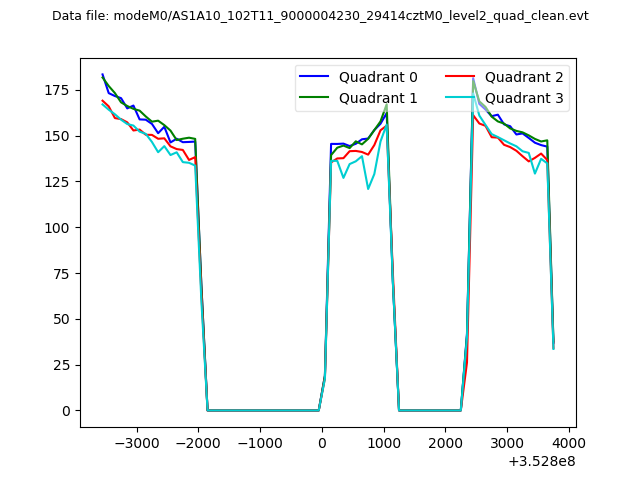 |
|
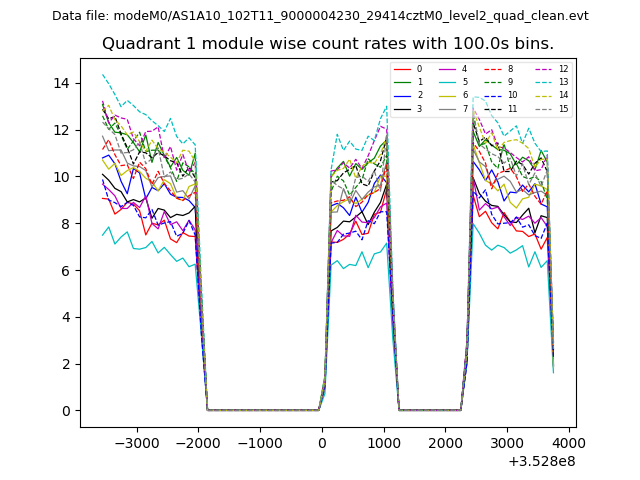
| Module-wise count rates for Quadrant A Data is divided into 100 sec bins |
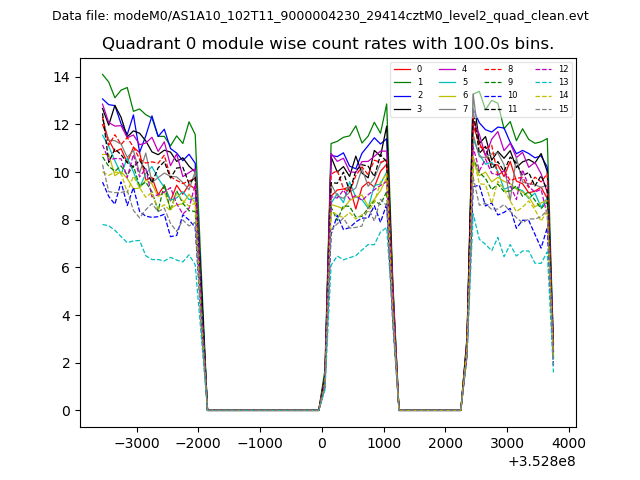 |
 |
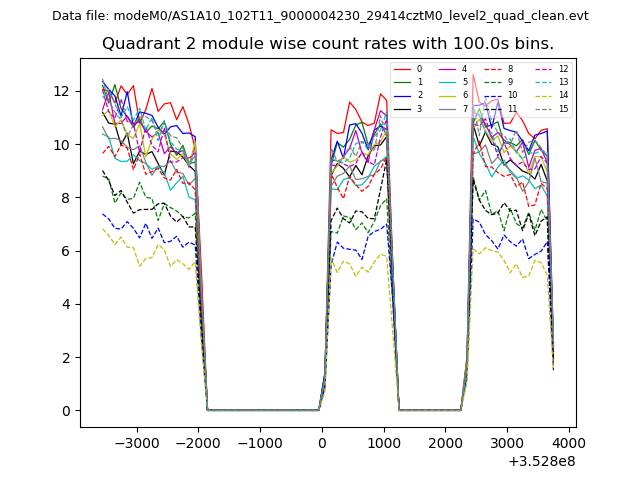
| Module-wise count rates for Quadrant B Data is divided into 100 sec bins |
 |
 |
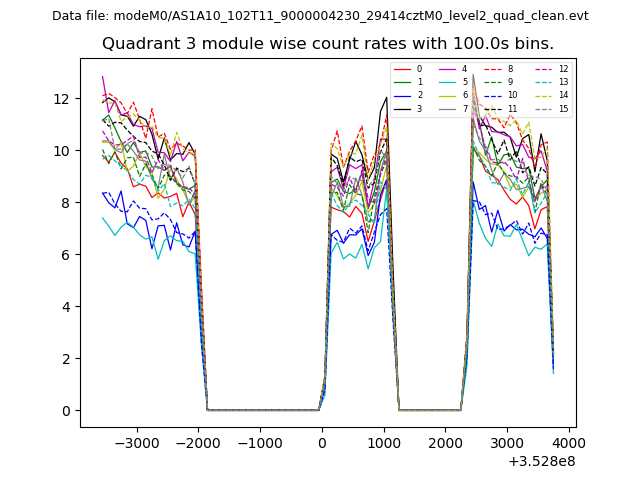
| Module-wise count rates for Quadrant C Data is divided into 100 sec bins |
 |
 |
| Module-wise count rates for Quadrant D Data is divided into 100 sec bins |
 |
 |
| Parameter | Plot |
|---|---|
| CZT HV Monitor | 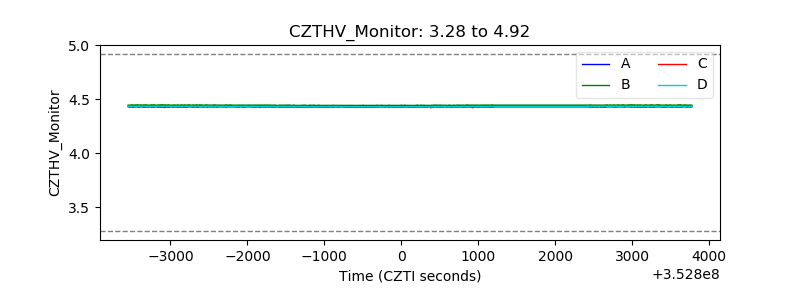 |
| D_VDD | 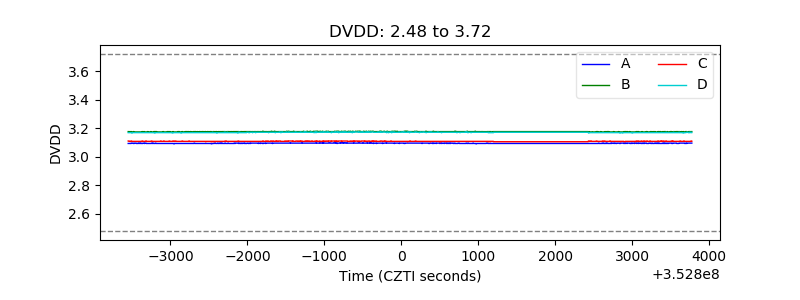 |
| Temperature 1 | 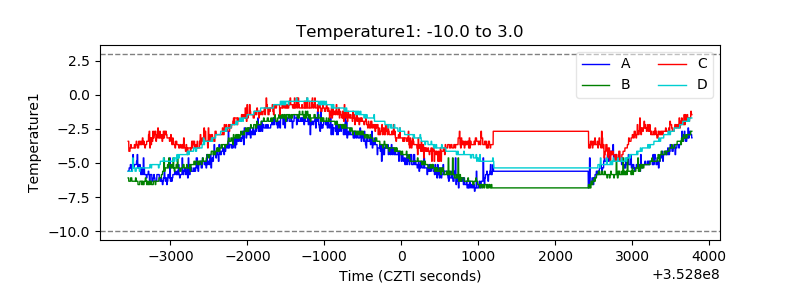 |
| Veto HV Monitor | 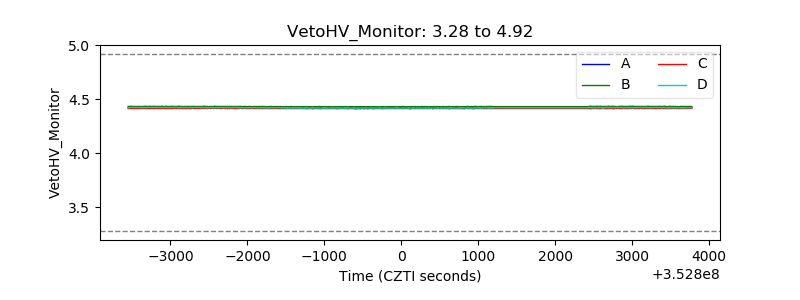 |
| Veto LLD | 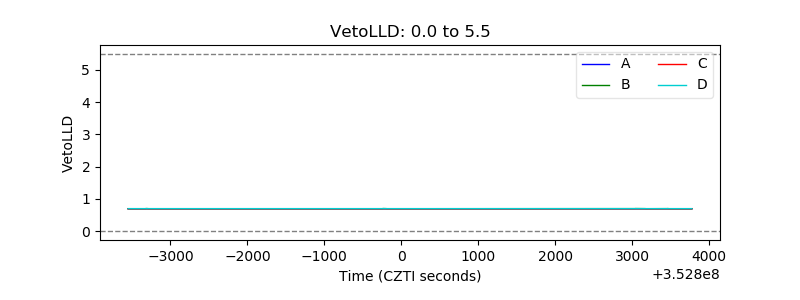 |
| Alpha Counter | 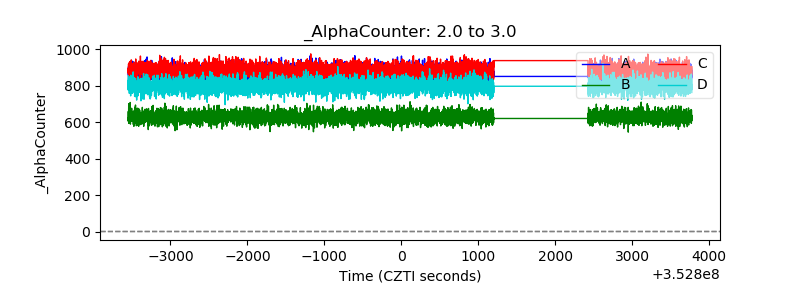 |
| _CPM_Rate | 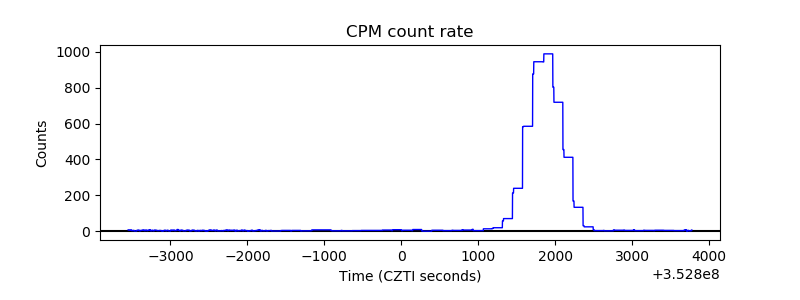 |
| CZT Counter | 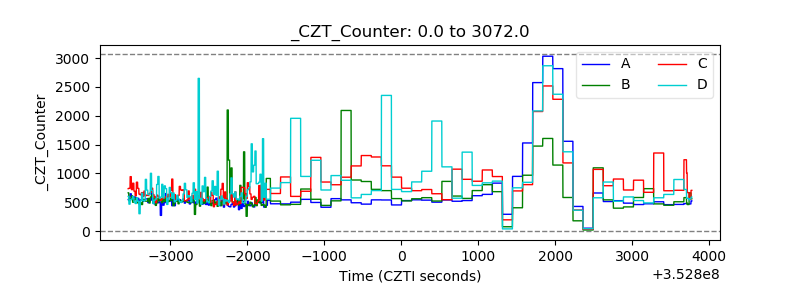 |
| +2.5 Volts monitor |  |
| +5 Volts monitor |  |
| _ROLL_ROT | 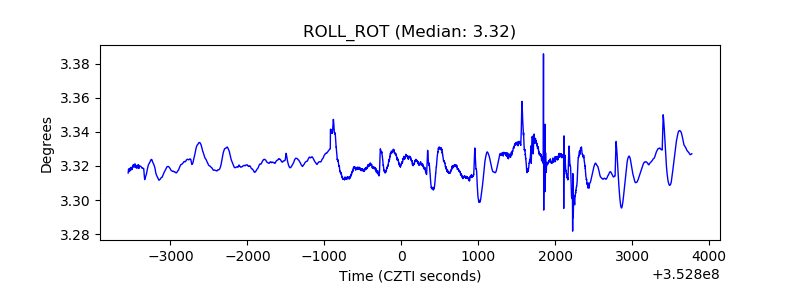 |
| _Roll_DEC | 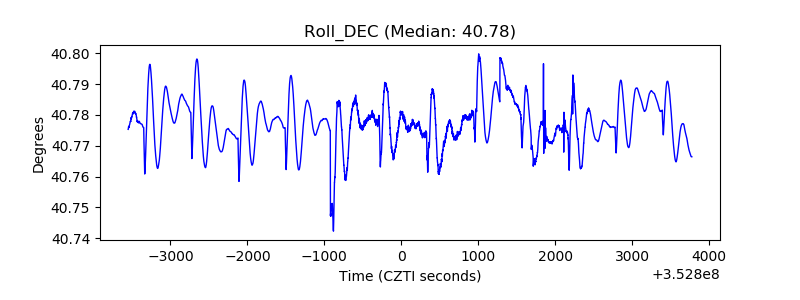 |
| _Roll_RA | 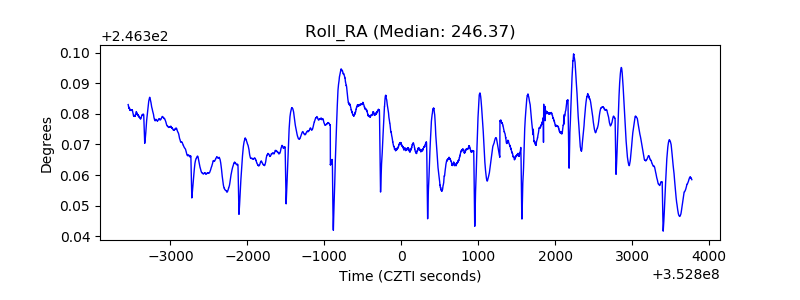 |
| Veto Counter | 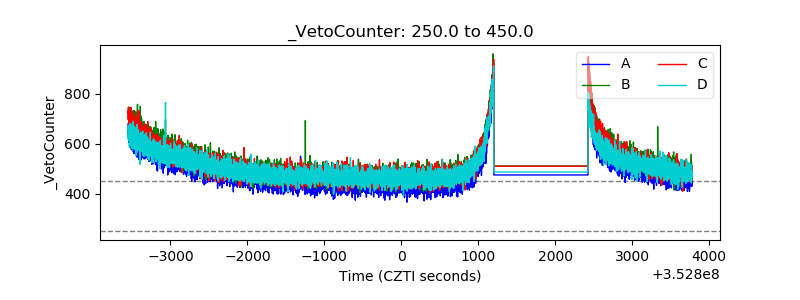 |