| Param | Original file | Final file |
|---|---|---|
| Filename | modeM0/AS1A10_102T11_9000004230_29415cztM0_level2.evt | modeM0/AS1A10_102T11_9000004230_29415cztM0_level2_quad_clean.evt |
| Size (bytes) | 685,981,440 | 93,360,960 |
| Size | 654.2 MB | 89.0 MB |
| Events in quadrant A | 3,256,107 | 621,319 |
| Events in quadrant B | 3,566,959 | 628,145 |
| Events in quadrant C | 7,449,950 | 565,636 |
| Events in quadrant D | 6,064,094 | 559,525 |
| Mode SS | |||
|---|---|---|---|
| Quadrant | BADHDUFLAG | Total packets | Discarded packets |
| A | 0 | 132 | 0 |
| B | 0 | 132 | 0 |
| C | 0 | 132 | 0 |
| D | 0 | 132 | 0 |
| Mode M0 | |||
|---|---|---|---|
| Quadrant | BADHDUFLAG | Total packets | Discarded packets |
| A | 0 | 13394 | 2 |
| B | 0 | 14369 | 2 |
| C | 0 | 26800 | 2 |
| D | 0 | 22461 | 2 |
| Mode M9 | |||
|---|---|---|---|
| Quadrant | BADHDUFLAG | Total packets | Discarded packets |
| A | 0 | 10 | 0 |
| B | 0 | 10 | 0 |
| C | 0 | 10 | 0 |
| D | 0 | 10 | 0 |
| Quadrant | Total seconds | Saturated seconds | Saturation percentage |
|---|---|---|---|
| A | 6479 | 84 | 1.296496% |
| B | 6479 | 124 | 1.913876% |
| C | 6479 | 961 | 14.832536% |
| D | 6479 | 854 | 13.181046% |
Noise dominated data is calculated using 1-second bins in cleaned event files. If a bin has >2000 counts, and if more than 50% of those come from <1% of pixels, then it is considered to be noise-dominated and hence unusable.
| Quadrant | # 1 sec bins | Bins with >0 counts | Bins with >2000 counts | High rate bins dominated by noise | Noise dominated (total time) | Noise dominated (detector-on time) | Marked lightcurve |
|---|---|---|---|---|---|---|---|
| A | 7534 | 6480 | 0 | 0 | 0.00% | 0.00% | 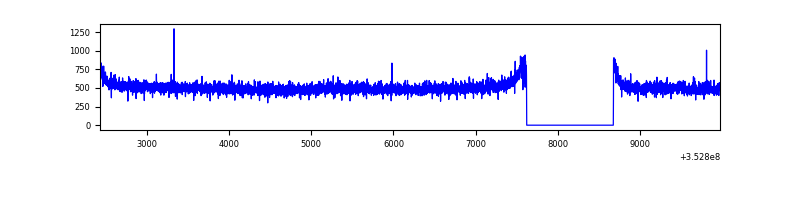 |
| B | 7534 | 6480 | 20 | 20 | 0.27% | 0.31% | 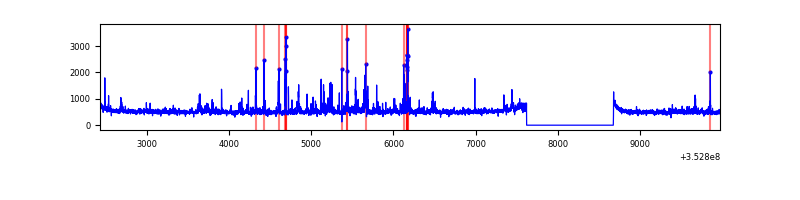 |
| C | 7534 | 6480 | 173 | 173 | 2.30% | 2.67% | 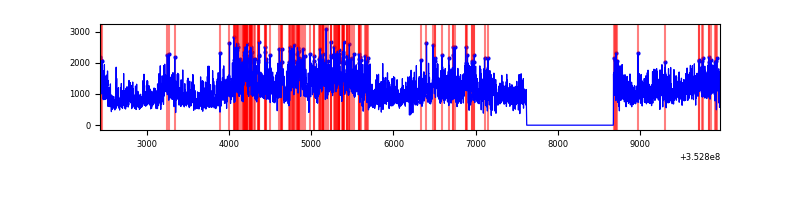 |
| D | 7534 | 6480 | 223 | 223 | 2.96% | 3.44% | 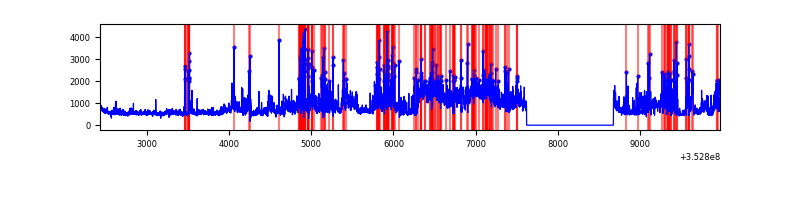 |
Top three noisy pixels from each quadrant. If the there are fewer than three noisy pixels in the level2.evt file, extra rows are filled as -1
| Pixel properties | Quadrant properties | ||||||
|---|---|---|---|---|---|---|---|
| Quadrant | DetID | PixID | Counts | Sigma | Mean | Median | Sigma |
| A | 13 | 254 | 12414 | 69.68 | 840 | 824 | 166.3 |
| A | 5 | 203 | 8845 | 48.22 | 840 | 824 | 166.3 |
| A | 3 | 137 | 7823 | 42.08 | 840 | 824 | 166.3 |
| B | 0 | 229 | 243148 | 1564.81 | 821 | 802 | 154.9 |
| B | 10 | 245 | 40617 | 257.08 | 821 | 802 | 154.9 |
| B | 0 | 190 | 21670 | 134.74 | 821 | 802 | 154.9 |
| C | 3 | 233 | 4202995 | 24103.94 | 757 | 761 | 174.3 |
| C | 14 | 238 | 187706 | 1072.31 | 757 | 761 | 174.3 |
| C | 14 | 254 | 90766 | 516.27 | 757 | 761 | 174.3 |
| D | 1 | 52 | 1694926 | 9255.52 | 778 | 758 | 183.0 |
| D | 8 | 195 | 714641 | 3900.06 | 778 | 758 | 183.0 |
| D | 7 | 80 | 320573 | 1747.2 | 778 | 758 | 183.0 |
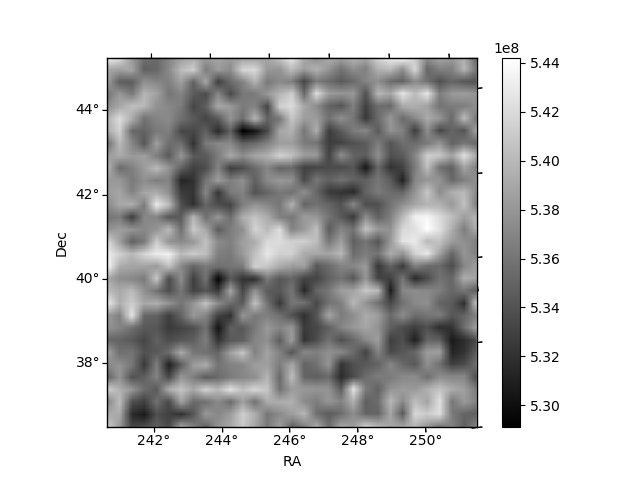
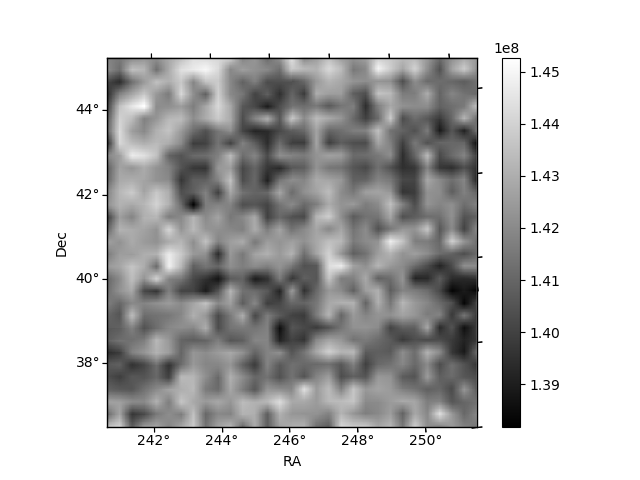
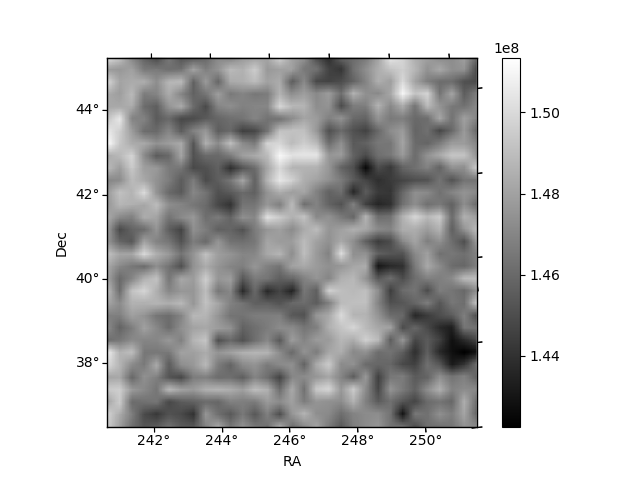
Histogram calculated using DETX and DETY for each event in the final _common_clean file
| Quadrant A | 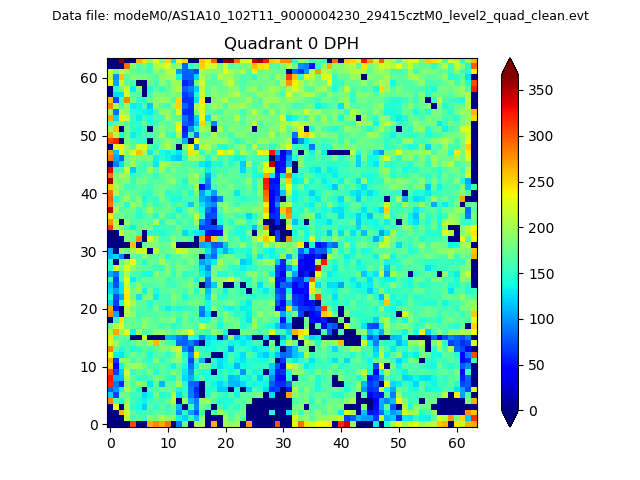 |
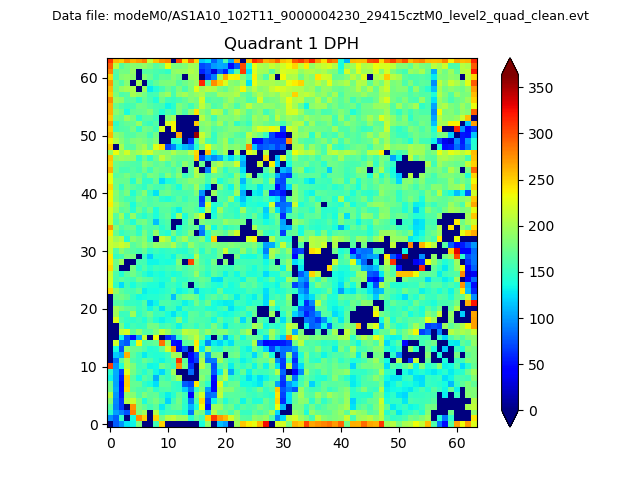 |
Quadrant B |
|---|---|---|---|
| Quadrant D |  |
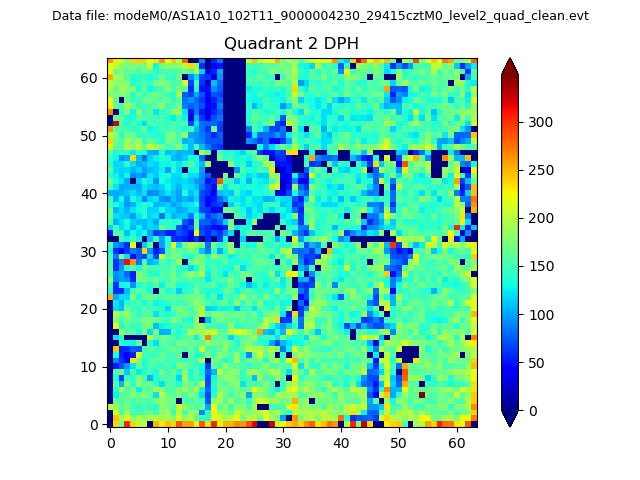 |
Quadrant C |
| Plot type | Count rate plots | Images |
|---|---|---|
| Comparison with Poisson distribution Blue bars denote a histogram of data divided into 1 sec bins. Red curve is a Poisson curve with rate = median count rate of data. |
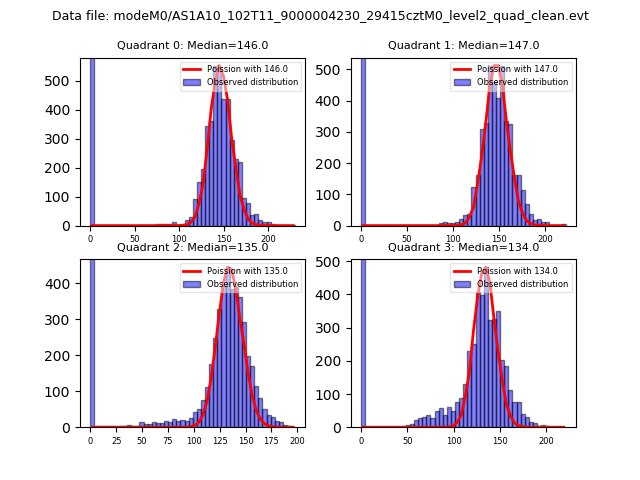 |
 |
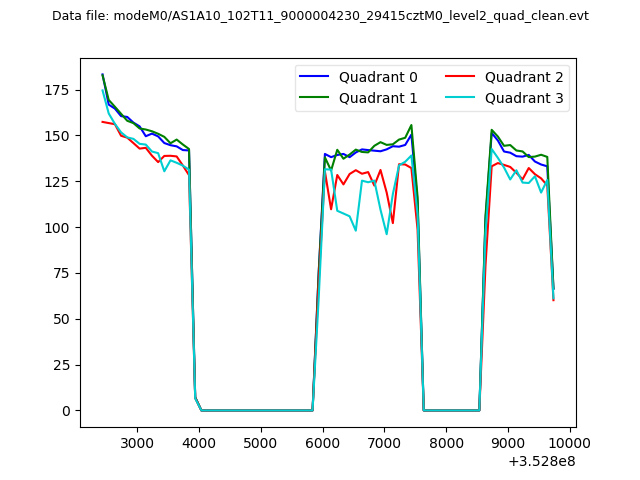
| Quadrant-wise count rates Data is divided into 100 sec bins |
 |
|
| Module-wise count rates for Quadrant A Data is divided into 100 sec bins |
 |
 |
| Module-wise count rates for Quadrant B Data is divided into 100 sec bins |
 |
 |
| Module-wise count rates for Quadrant C Data is divided into 100 sec bins |
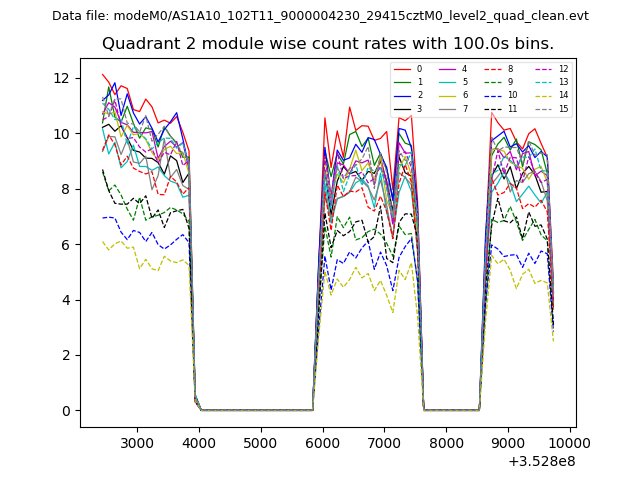 |
 |
| Module-wise count rates for Quadrant D Data is divided into 100 sec bins |
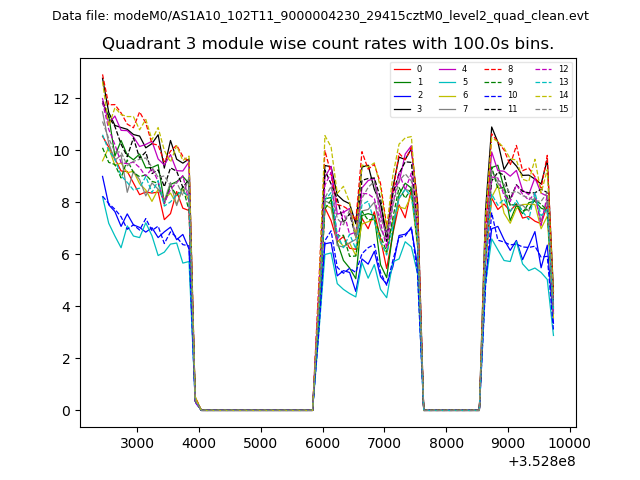 |
 |
| Parameter | Plot |
|---|---|
| CZT HV Monitor |  |
| D_VDD | 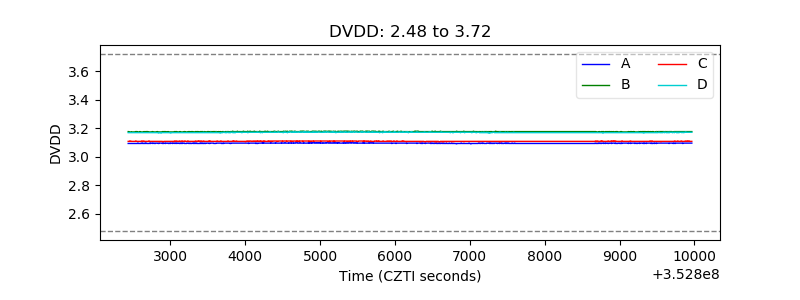 |
| Temperature 1 | 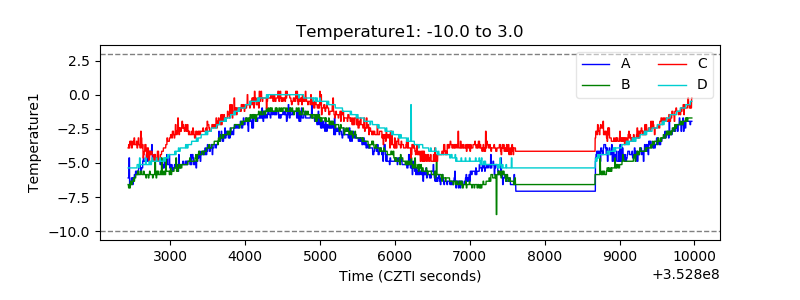 |
| Veto HV Monitor | 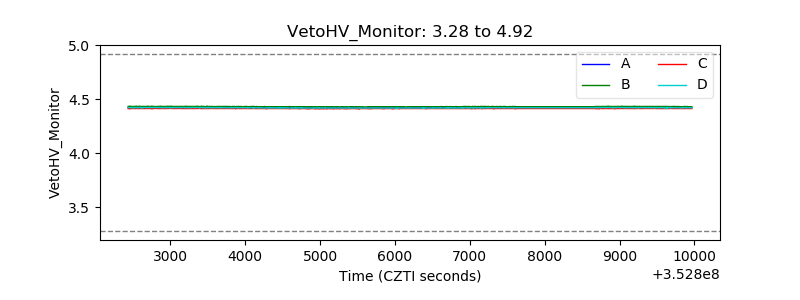 |
| Veto LLD | 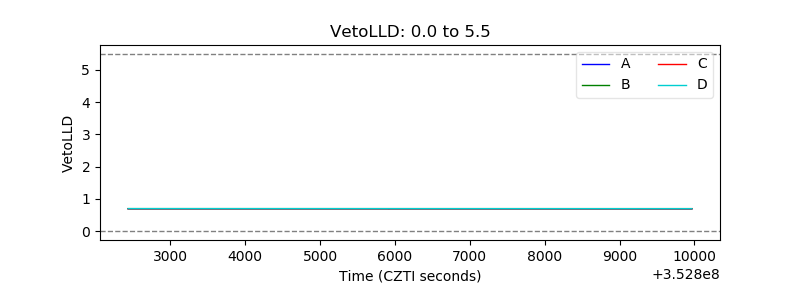 |
| Alpha Counter | 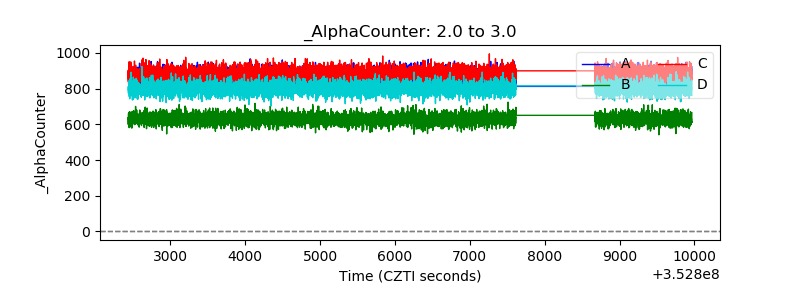 |
| _CPM_Rate | 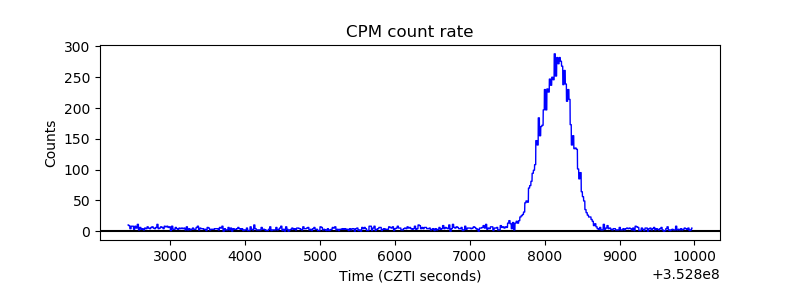 |
| CZT Counter | 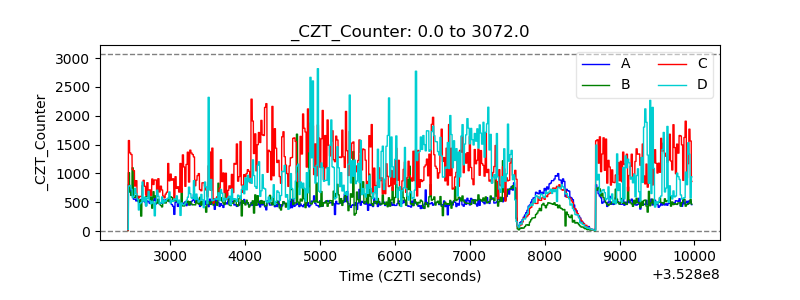 |
| +2.5 Volts monitor |  |
| +5 Volts monitor | 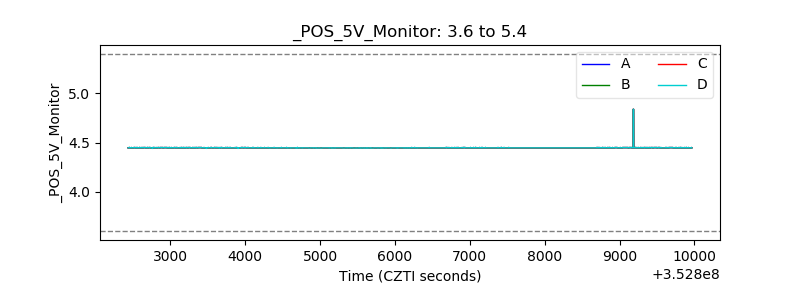 |
| _ROLL_ROT | 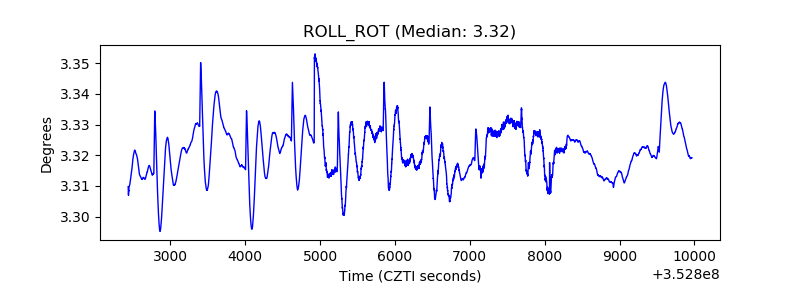 |
| _Roll_DEC | 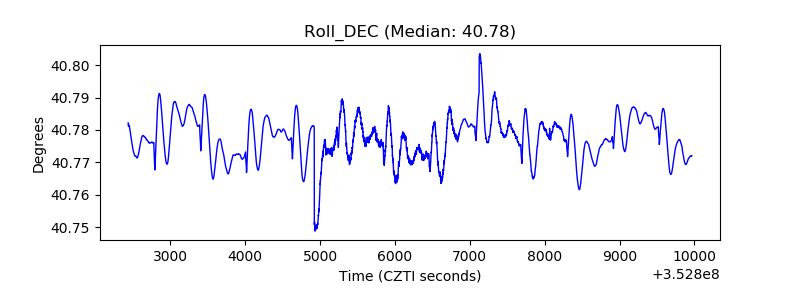 |
| _Roll_RA | 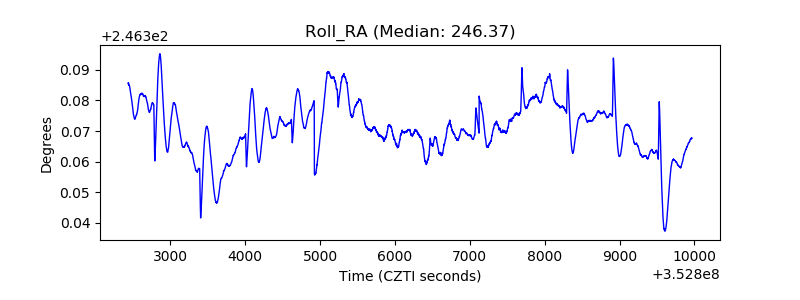 |
| Veto Counter | 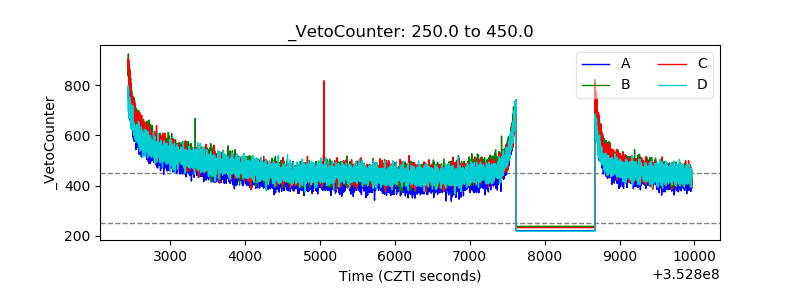 |