| Param | Original file | Final file |
|---|---|---|
| Filename | modeM0/AS1A10_102T11_9000004230_29416cztM0_level2.evt | modeM0/AS1A10_102T11_9000004230_29416cztM0_level2_quad_clean.evt |
| Size (bytes) | 684,797,760 | 91,261,440 |
| Size | 653.1 MB | 87.0 MB |
| Events in quadrant A | 3,450,963 | 583,625 |
| Events in quadrant B | 3,724,013 | 590,754 |
| Events in quadrant C | 6,240,969 | 551,822 |
| Events in quadrant D | 6,843,828 | 542,885 |
| Mode SS | |||
|---|---|---|---|
| Quadrant | BADHDUFLAG | Total packets | Discarded packets |
| A | 0 | 146 | 0 |
| B | 0 | 146 | 0 |
| C | 0 | 146 | 0 |
| D | 0 | 146 | 0 |
| Mode M0 | |||
|---|---|---|---|
| Quadrant | BADHDUFLAG | Total packets | Discarded packets |
| A | 0 | 14601 | 2 |
| B | 0 | 15298 | 2 |
| C | 0 | 23556 | 2 |
| D | 0 | 25236 | 5 |
| Mode M9 | |||
|---|---|---|---|
| Quadrant | BADHDUFLAG | Total packets | Discarded packets |
| A | 0 | 6 | 0 |
| B | 0 | 6 | 0 |
| C | 0 | 6 | 0 |
| D | 0 | 6 | 0 |
| Quadrant | Total seconds | Saturated seconds | Saturation percentage |
|---|---|---|---|
| A | 7086 | 142 | 2.003951% |
| B | 7087 | 164 | 2.314096% |
| C | 7087 | 412 | 5.813461% |
| D | 7086 | 821 | 11.586226% |
Noise dominated data is calculated using 1-second bins in cleaned event files. If a bin has >2000 counts, and if more than 50% of those come from <1% of pixels, then it is considered to be noise-dominated and hence unusable.
| Quadrant | # 1 sec bins | Bins with >0 counts | Bins with >2000 counts | High rate bins dominated by noise | Noise dominated (total time) | Noise dominated (detector-on time) | Marked lightcurve |
|---|---|---|---|---|---|---|---|
| A | 7716 | 7087 | 0 | 0 | 0.00% | 0.00% | 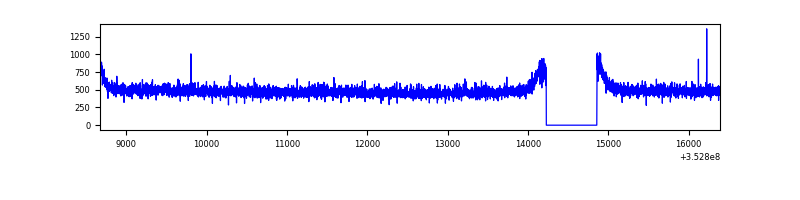 |
| B | 7717 | 7088 | 15 | 15 | 0.19% | 0.21% | 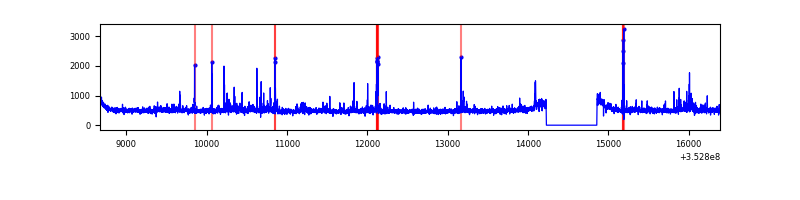 |
| C | 7717 | 7088 | 26 | 26 | 0.34% | 0.37% | 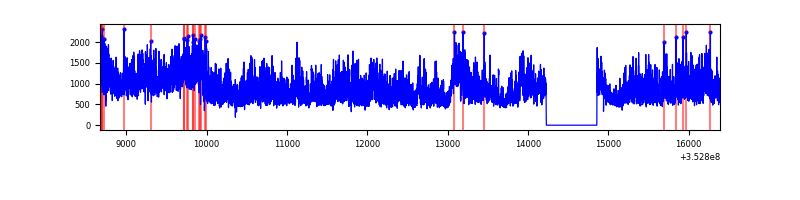 |
| D | 7716 | 7087 | 445 | 445 | 5.77% | 6.28% | 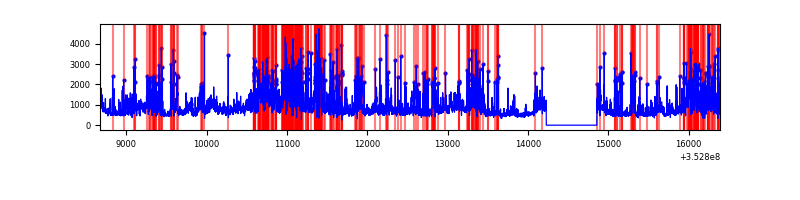 |
Top three noisy pixels from each quadrant. If the there are fewer than three noisy pixels in the level2.evt file, extra rows are filled as -1
| Pixel properties | Quadrant properties | ||||||
|---|---|---|---|---|---|---|---|
| Quadrant | DetID | PixID | Counts | Sigma | Mean | Median | Sigma |
| A | 13 | 254 | 13822 | 71.95 | 892 | 873 | 180.0 |
| A | 3 | 137 | 8663 | 43.28 | 892 | 873 | 180.0 |
| A | 0 | 226 | 7776 | 38.35 | 892 | 873 | 180.0 |
| B | 0 | 229 | 157282 | 930.33 | 877 | 853 | 168.1 |
| B | 10 | 245 | 55907 | 327.42 | 877 | 853 | 168.1 |
| B | 0 | 190 | 21148 | 120.7 | 877 | 853 | 168.1 |
| C | 3 | 233 | 2825235 | 14593.15 | 833 | 837 | 193.5 |
| C | 14 | 238 | 139345 | 715.65 | 833 | 837 | 193.5 |
| C | 2 | 114 | 16882 | 82.9 | 833 | 837 | 193.5 |
| D | 1 | 52 | 2015200 | 10186.8 | 827 | 803 | 197.7 |
| D | 8 | 195 | 987877 | 4991.63 | 827 | 803 | 197.7 |
| D | 7 | 80 | 344086 | 1735.98 | 827 | 803 | 197.7 |
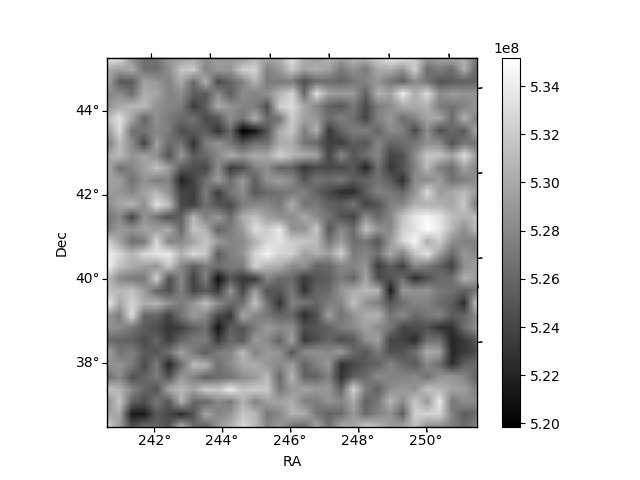
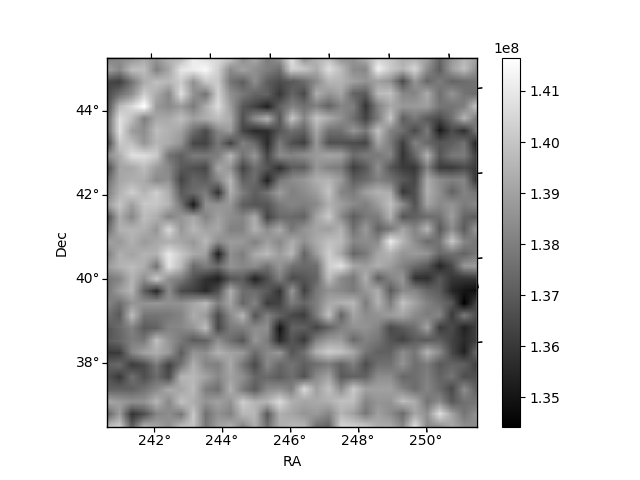
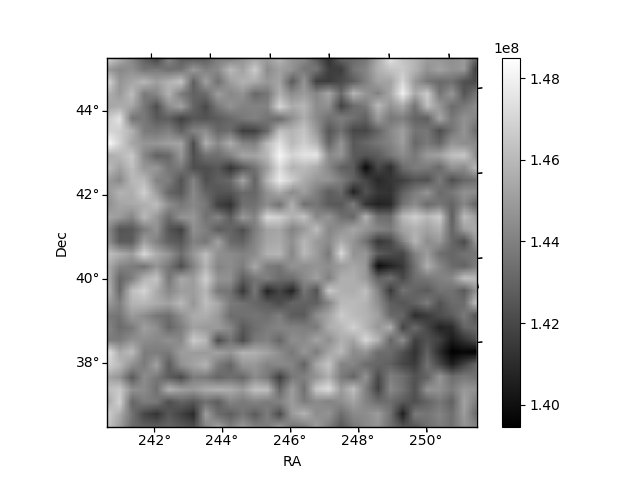
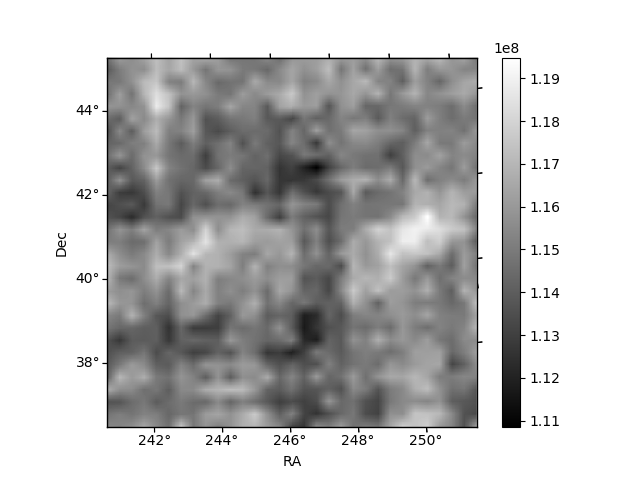
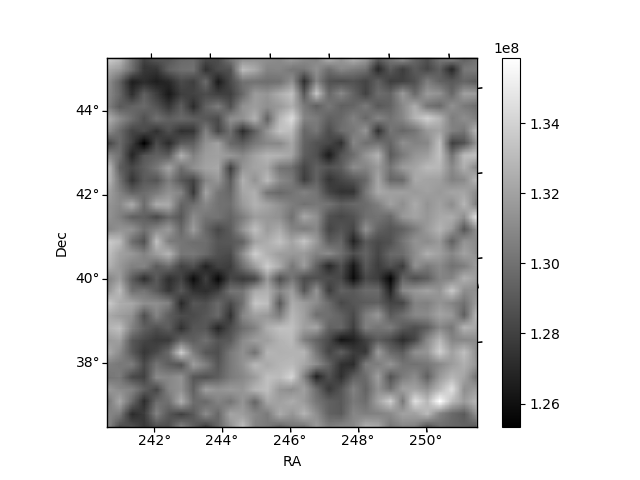
Histogram calculated using DETX and DETY for each event in the final _common_clean file
| Quadrant A | 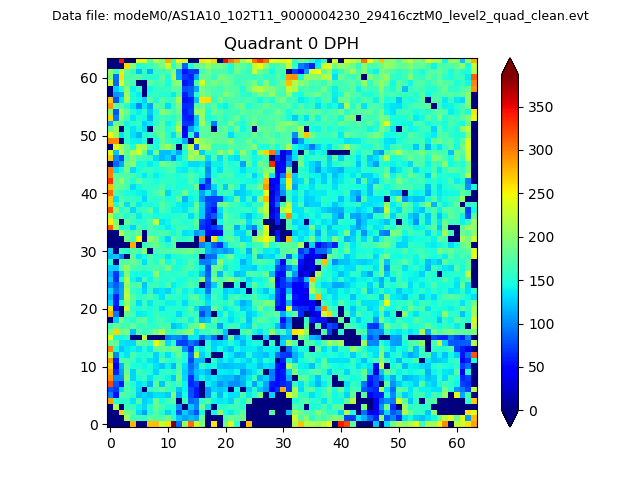 |
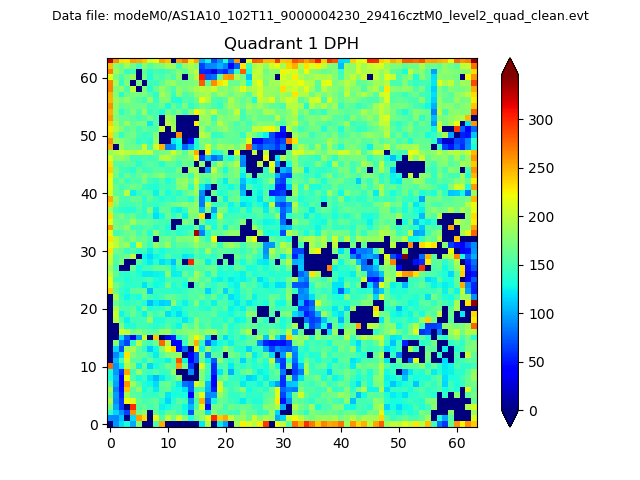 |
Quadrant B |
|---|---|---|---|
| Quadrant D | 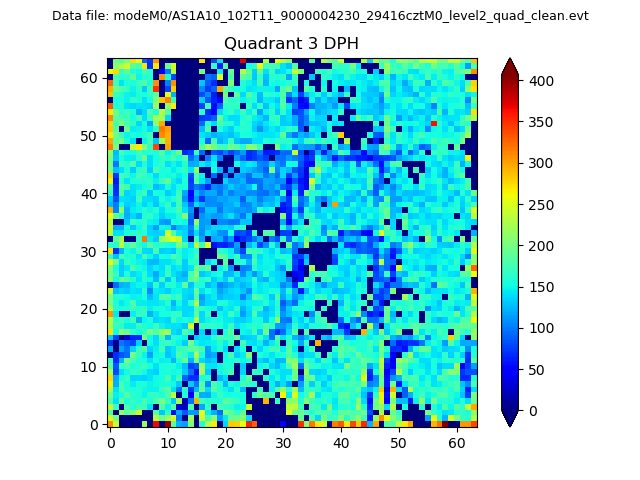 |
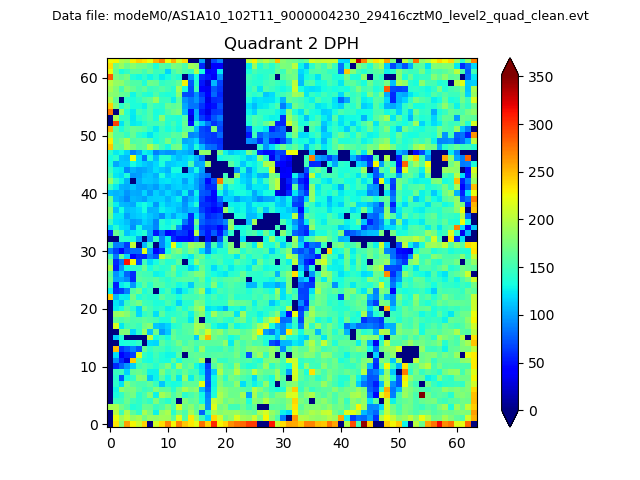 |
Quadrant C |
| Plot type | Count rate plots | Images |
|---|---|---|
| Comparison with Poisson distribution Blue bars denote a histogram of data divided into 1 sec bins. Red curve is a Poisson curve with rate = median count rate of data. |
 |
 |
| Quadrant-wise count rates Data is divided into 100 sec bins |
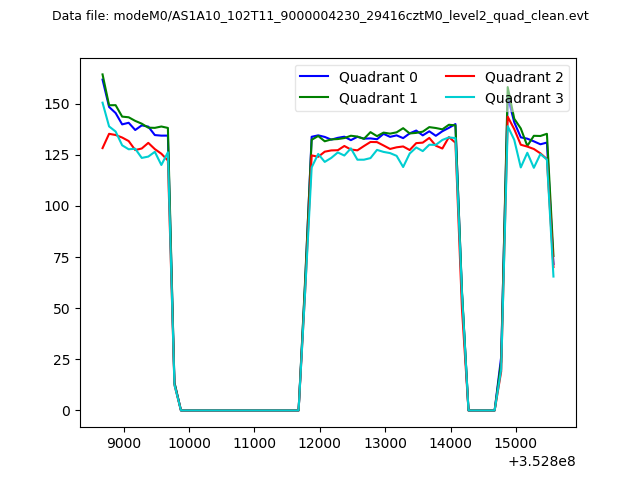 |
|
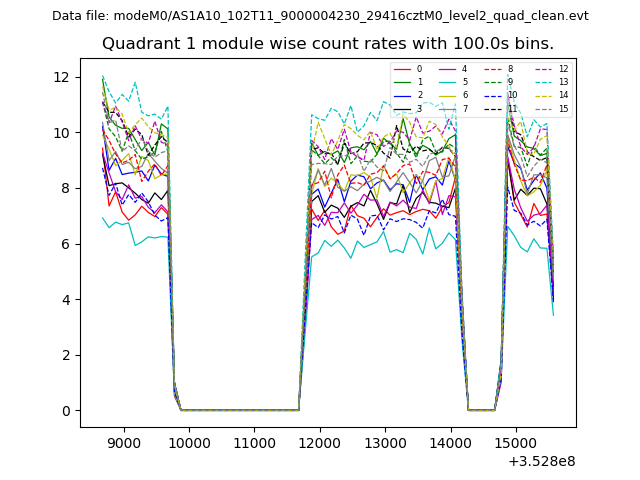
| Module-wise count rates for Quadrant A Data is divided into 100 sec bins |
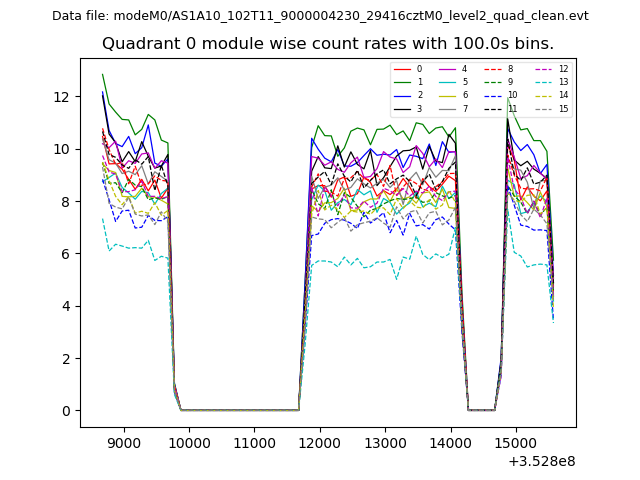 |
 |
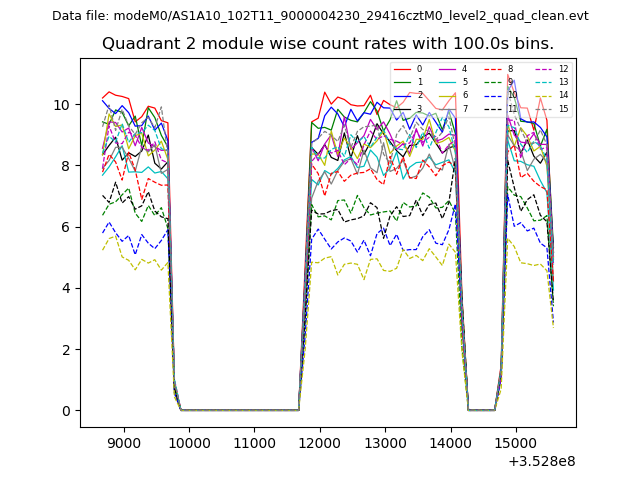
| Module-wise count rates for Quadrant B Data is divided into 100 sec bins |
 |
 |
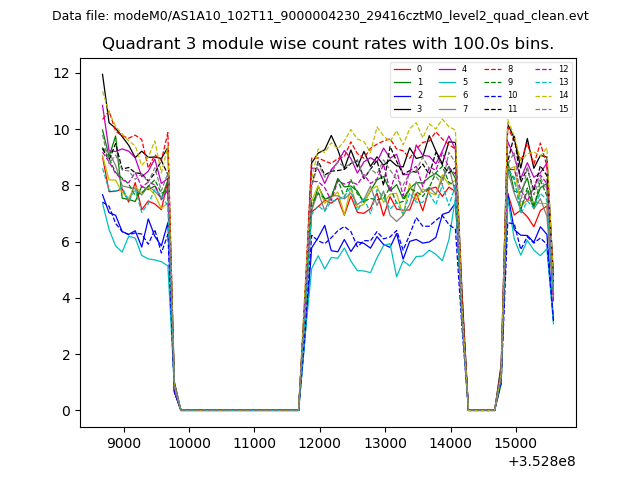
| Module-wise count rates for Quadrant C Data is divided into 100 sec bins |
 |
 |
| Module-wise count rates for Quadrant D Data is divided into 100 sec bins |
 |
 |
| Parameter | Plot |
|---|---|
| CZT HV Monitor | 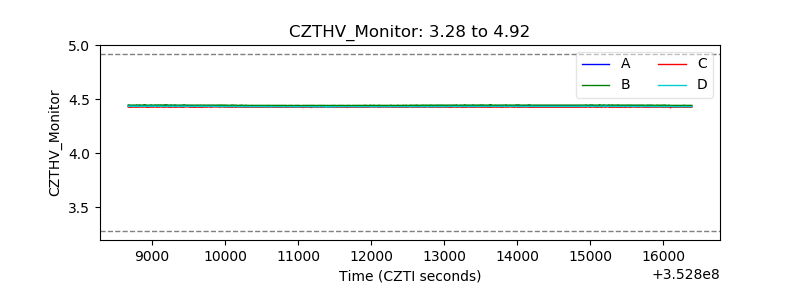 |
| D_VDD | 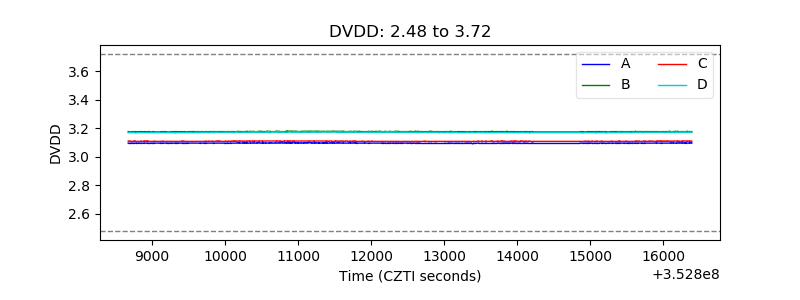 |
| Temperature 1 | 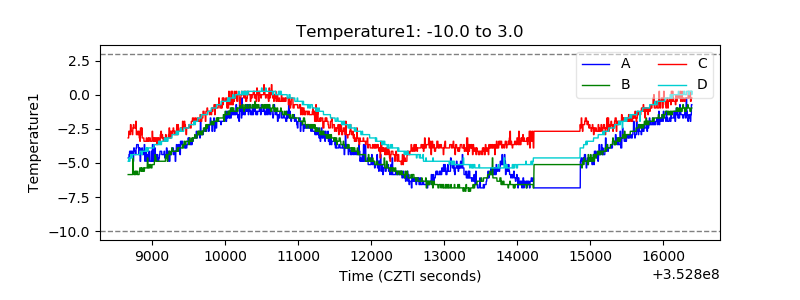 |
| Veto HV Monitor | 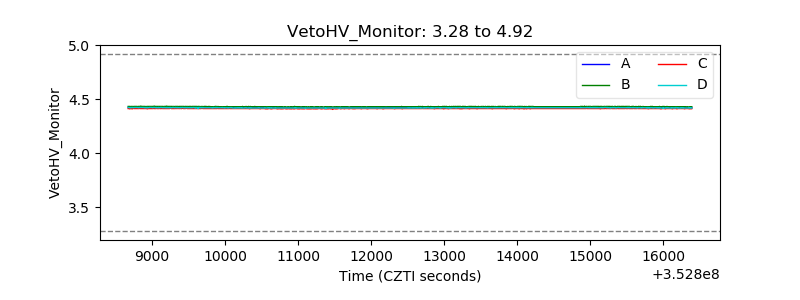 |
| Veto LLD | 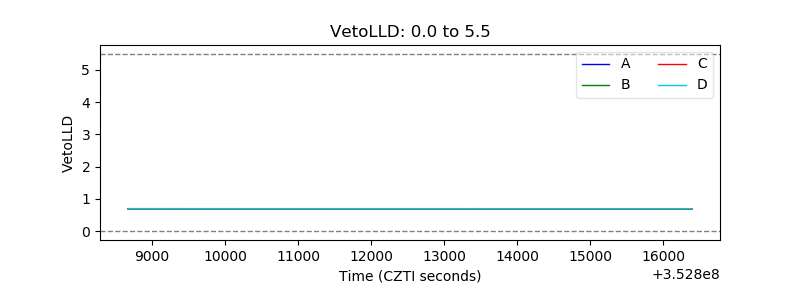 |
| Alpha Counter | 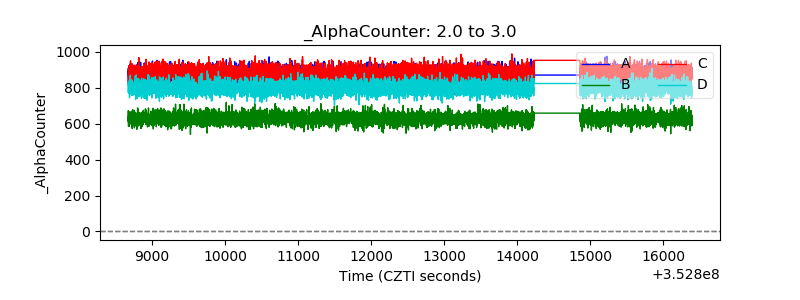 |
| _CPM_Rate | 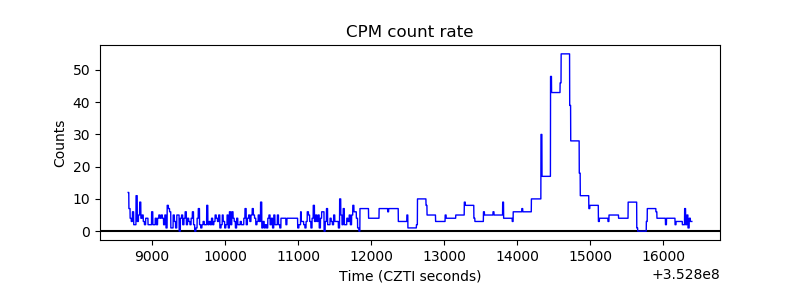 |
| CZT Counter | 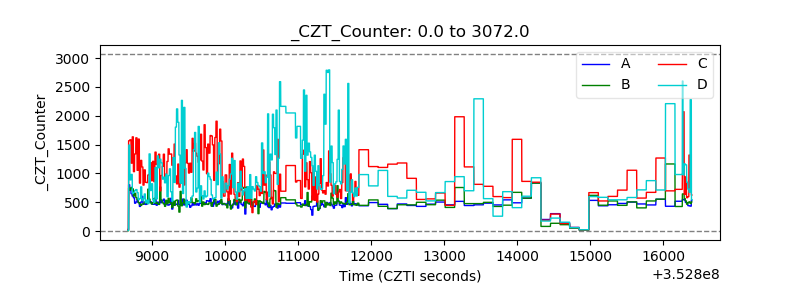 |
| +2.5 Volts monitor |  |
| +5 Volts monitor |  |
| _ROLL_ROT | 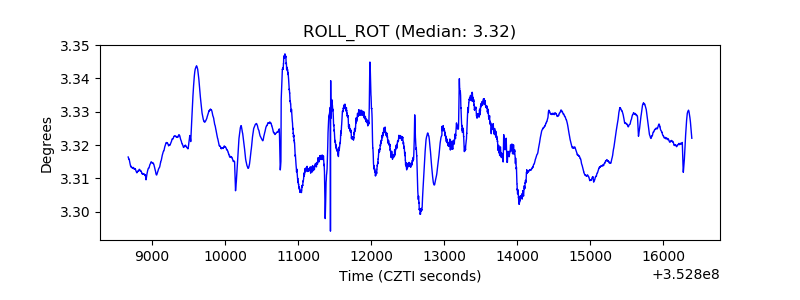 |
| _Roll_DEC | 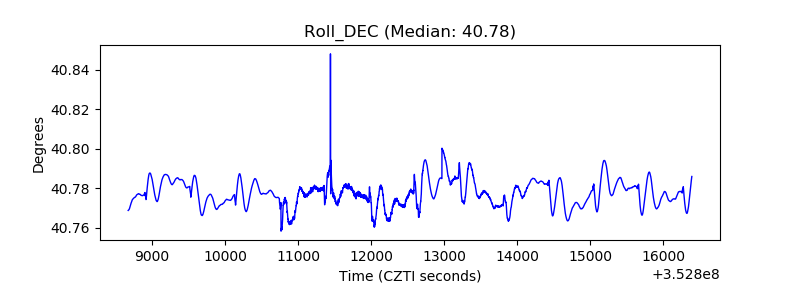 |
| _Roll_RA | 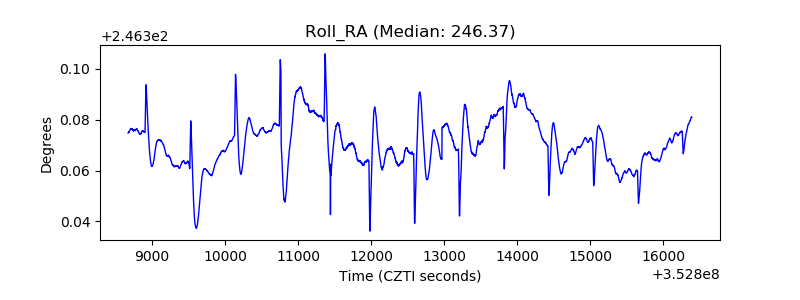 |
| Veto Counter | 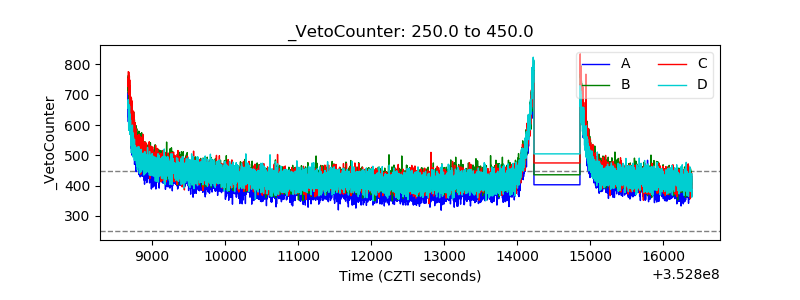 |