| Param | Original file | Final file |
|---|---|---|
| Filename | modeM0/AS1A10_102T11_9000004230_29418cztM0_level2.evt | modeM0/AS1A10_102T11_9000004230_29418cztM0_level2_quad_clean.evt |
| Size (bytes) | 769,236,480 | 77,400,000 |
| Size | 733.6 MB | 73.8 MB |
| Events in quadrant A | 3,497,884 | 475,084 |
| Events in quadrant B | 4,141,479 | 479,412 |
| Events in quadrant C | 8,454,383 | 450,208 |
| Events in quadrant D | 6,715,037 | 436,213 |
| Mode SS | |||
|---|---|---|---|
| Quadrant | BADHDUFLAG | Total packets | Discarded packets |
| A | 0 | 146 | 0 |
| B | 0 | 146 | 0 |
| C | 0 | 146 | 0 |
| D | 0 | 146 | 0 |
| Mode M0 | |||
|---|---|---|---|
| Quadrant | BADHDUFLAG | Total packets | Discarded packets |
| A | 0 | 14954 | 1 |
| B | 0 | 16855 | 1 |
| C | 0 | 30357 | 1 |
| D | 0 | 24838 | 3 |
| Quadrant | Total seconds | Saturated seconds | Saturation percentage |
|---|---|---|---|
| A | 7208 | 183 | 2.538846% |
| B | 7209 | 292 | 4.050492% |
| C | 7209 | 1549 | 21.487030% |
| D | 7208 | 1065 | 14.775250% |
Noise dominated data is calculated using 1-second bins in cleaned event files. If a bin has >2000 counts, and if more than 50% of those come from <1% of pixels, then it is considered to be noise-dominated and hence unusable.
| Quadrant | # 1 sec bins | Bins with >0 counts | Bins with >2000 counts | High rate bins dominated by noise | Noise dominated (total time) | Noise dominated (detector-on time) | Marked lightcurve |
|---|---|---|---|---|---|---|---|
| A | 7298 | 7209 | 1 | 1 | 0.01% | 0.01% | 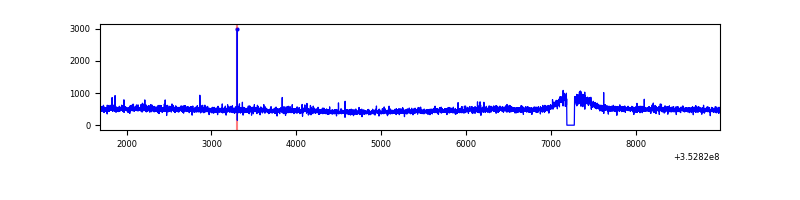 |
| B | 7299 | 7210 | 42 | 42 | 0.58% | 0.58% | 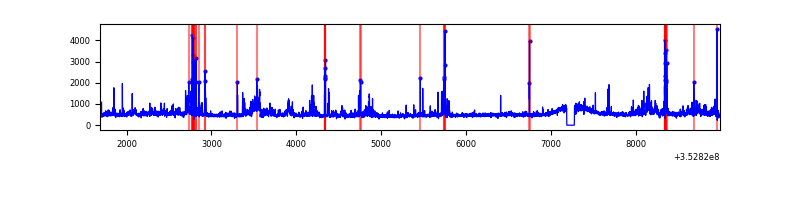 |
| C | 7299 | 7210 | 747 | 747 | 10.23% | 10.36% | 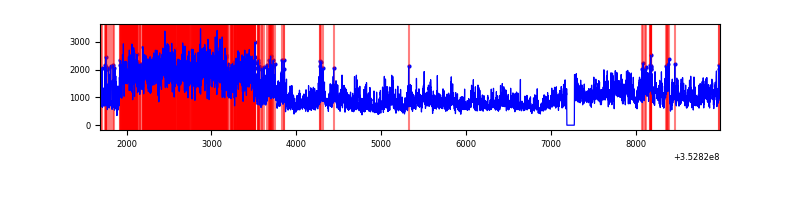 |
| D | 7297 | 7207 | 636 | 636 | 8.72% | 8.82% | 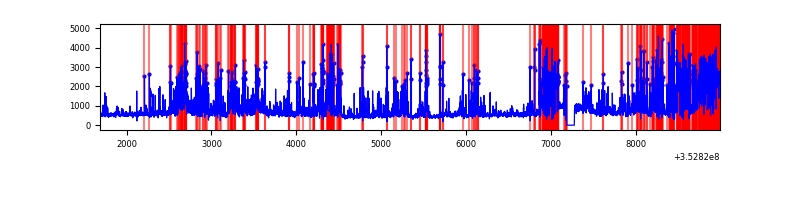 |
Top three noisy pixels from each quadrant. If the there are fewer than three noisy pixels in the level2.evt file, extra rows are filled as -1
| Pixel properties | Quadrant properties | ||||||
|---|---|---|---|---|---|---|---|
| Quadrant | DetID | PixID | Counts | Sigma | Mean | Median | Sigma |
| A | 0 | 13 | 49902 | 269.75 | 894 | 874 | 181.8 |
| A | 13 | 254 | 12920 | 66.28 | 894 | 874 | 181.8 |
| A | 3 | 137 | 8849 | 43.88 | 894 | 874 | 181.8 |
| B | 10 | 245 | 581781 | 3422.82 | 879 | 855 | 169.7 |
| B | 15 | 33 | 54004 | 313.15 | 879 | 855 | 169.7 |
| B | 12 | 111 | 20951 | 118.41 | 879 | 855 | 169.7 |
| C | 3 | 233 | 5121245 | 26846.12 | 811 | 812 | 190.7 |
| C | 14 | 238 | 128487 | 669.39 | 811 | 812 | 190.7 |
| C | 15 | 208 | 20128 | 101.27 | 811 | 812 | 190.7 |
| D | 1 | 52 | 1744676 | 9006.4 | 811 | 788 | 193.6 |
| D | 7 | 80 | 1167131 | 6023.64 | 811 | 788 | 193.6 |
| D | 8 | 195 | 310985 | 1602.03 | 811 | 788 | 193.6 |
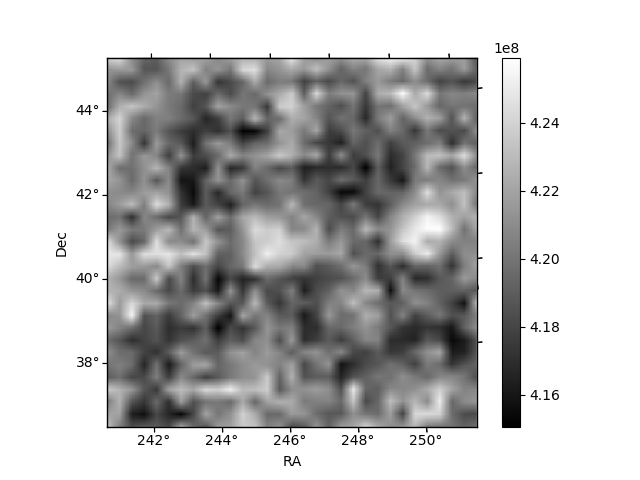
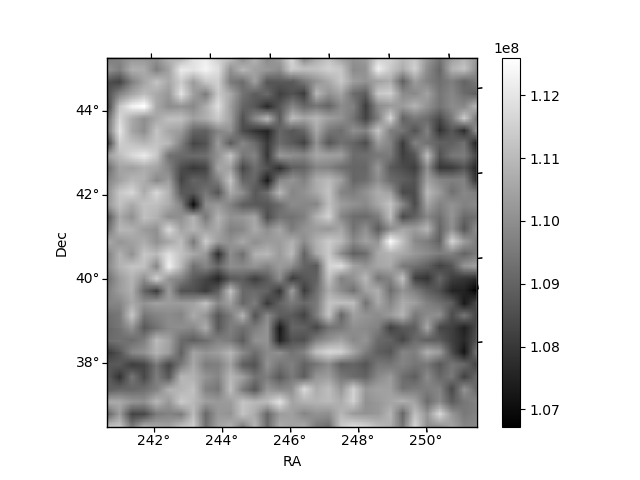
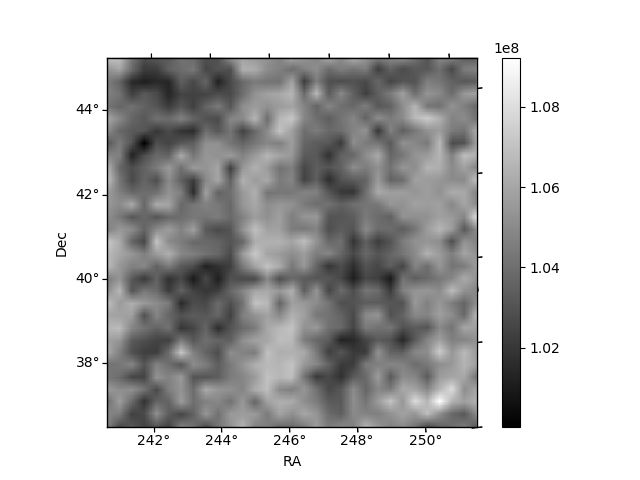
Histogram calculated using DETX and DETY for each event in the final _common_clean file
| Quadrant A | 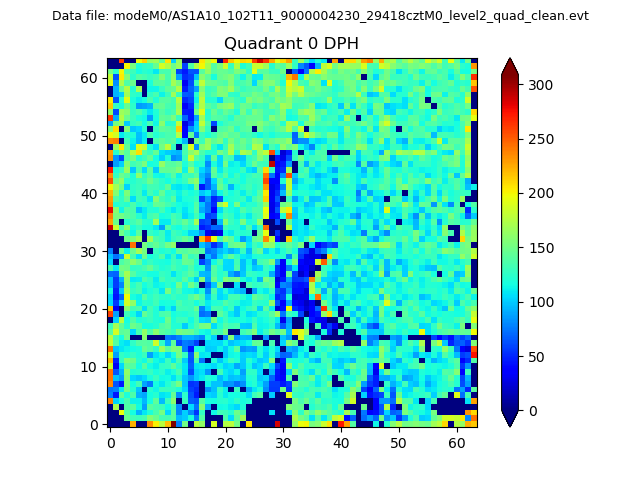 |
 |
Quadrant B |
|---|---|---|---|
| Quadrant D | 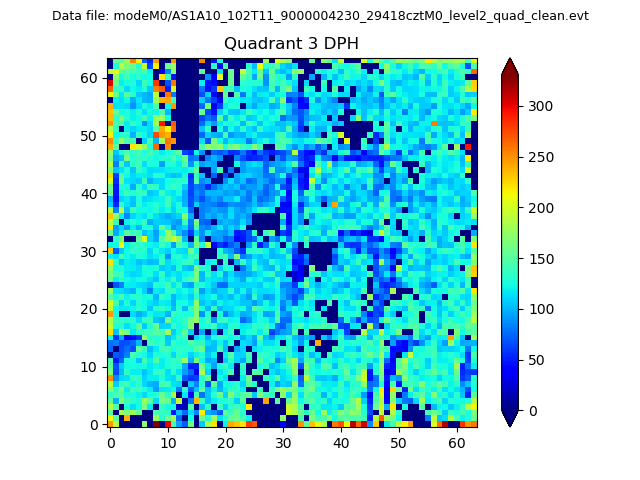 |
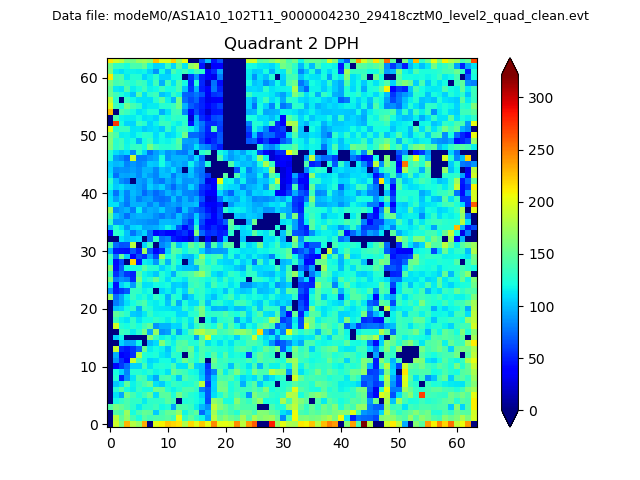 |
Quadrant C |
| Plot type | Count rate plots | Images |
|---|---|---|
| Comparison with Poisson distribution Blue bars denote a histogram of data divided into 1 sec bins. Red curve is a Poisson curve with rate = median count rate of data. |
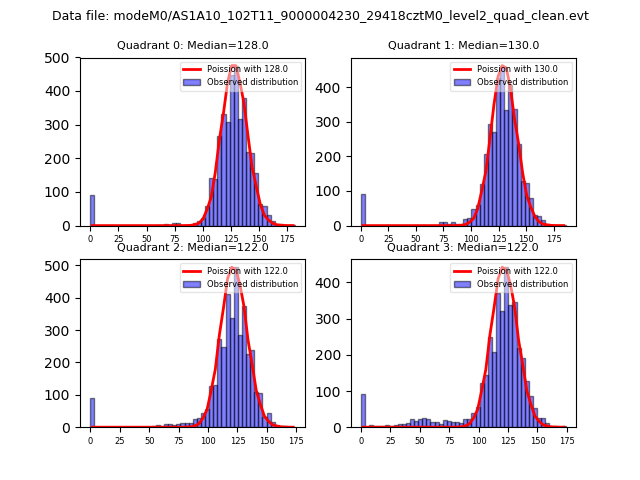 |
 |
| Quadrant-wise count rates Data is divided into 100 sec bins |
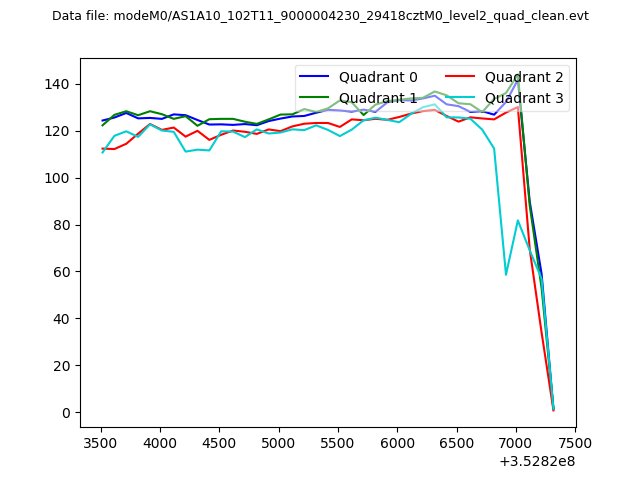 |
|
| Module-wise count rates for Quadrant A Data is divided into 100 sec bins |
 |
 |
| Module-wise count rates for Quadrant B Data is divided into 100 sec bins |
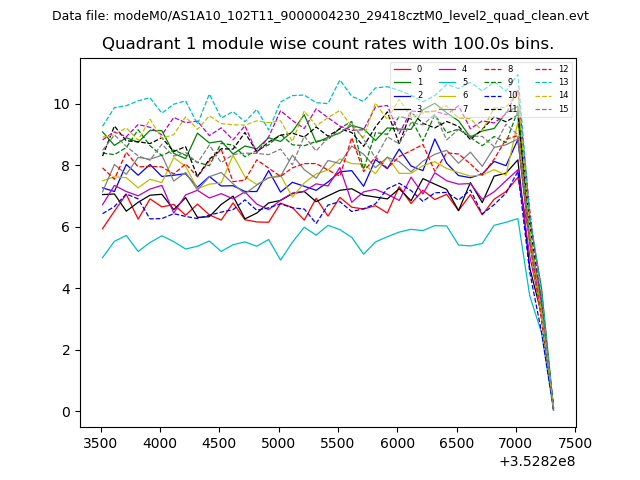 |
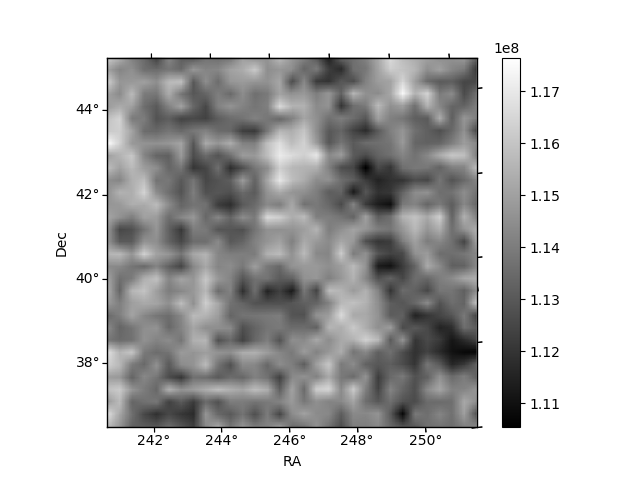 |
| Module-wise count rates for Quadrant C Data is divided into 100 sec bins |
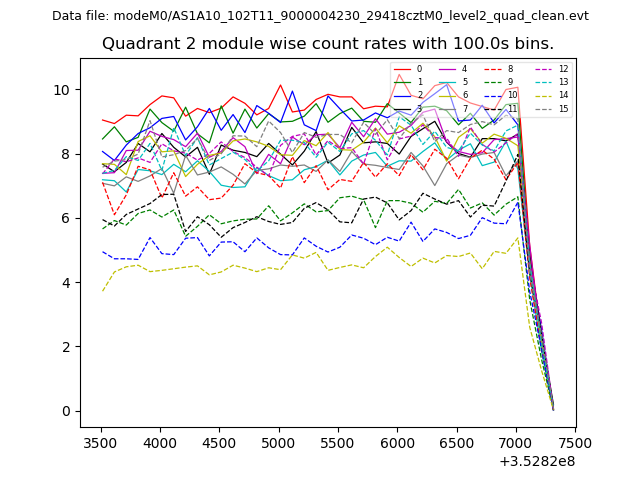 |
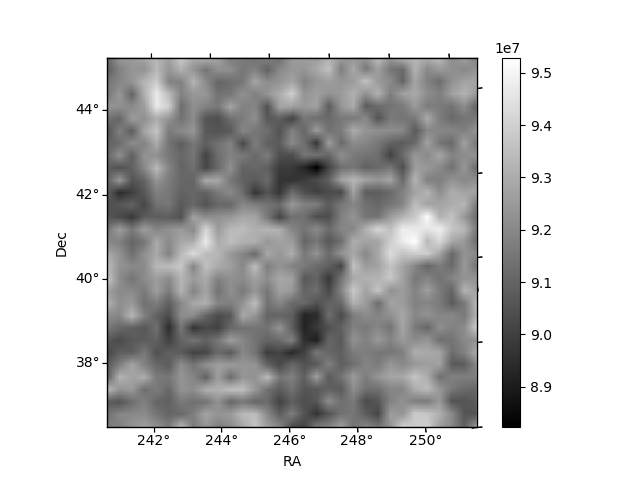 |
| Module-wise count rates for Quadrant D Data is divided into 100 sec bins |
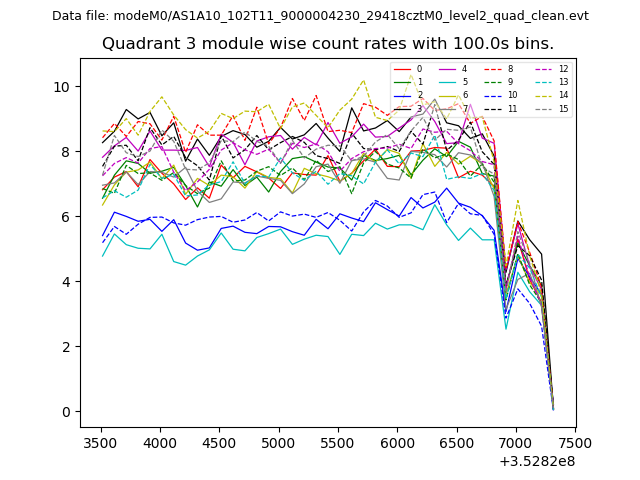 |
 |
| Parameter | Plot |
|---|---|
| CZT HV Monitor | 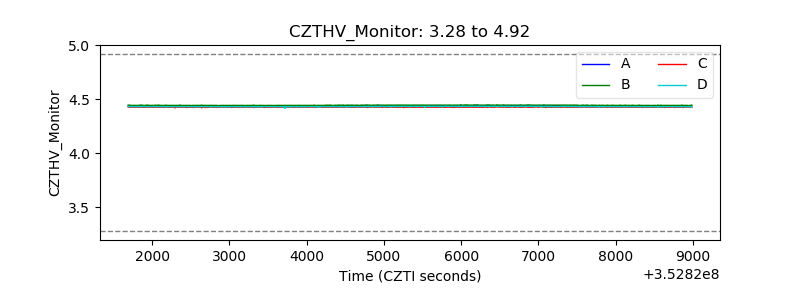 |
| D_VDD | 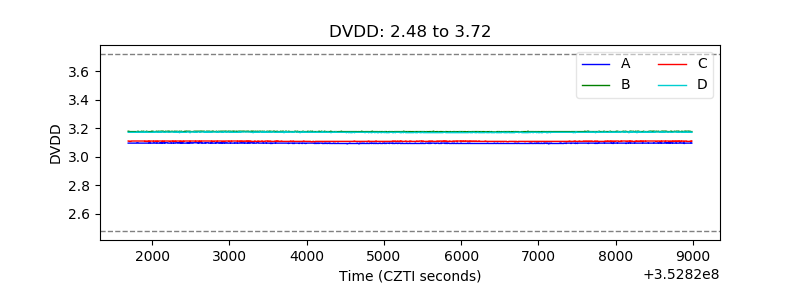 |
| Temperature 1 | 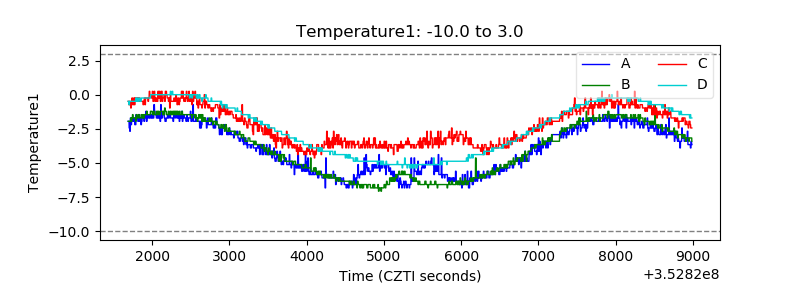 |
| Veto HV Monitor | 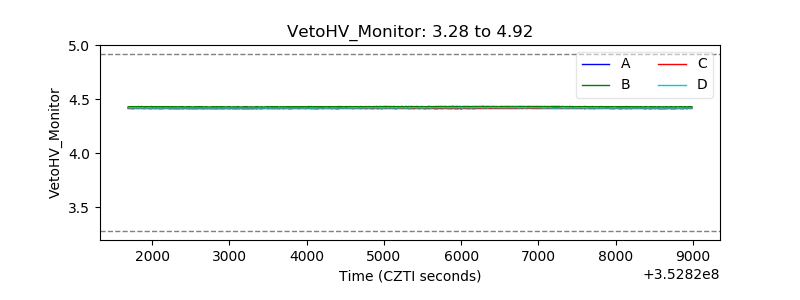 |
| Veto LLD | 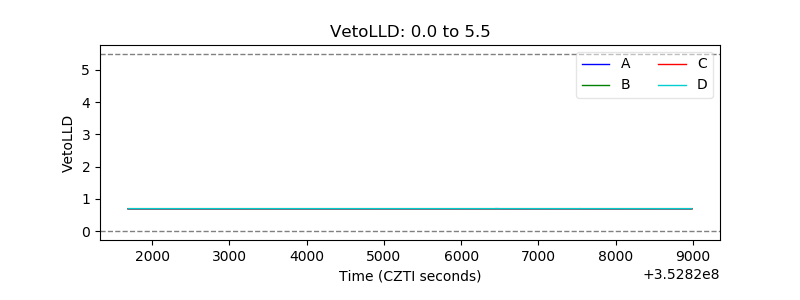 |
| Alpha Counter | 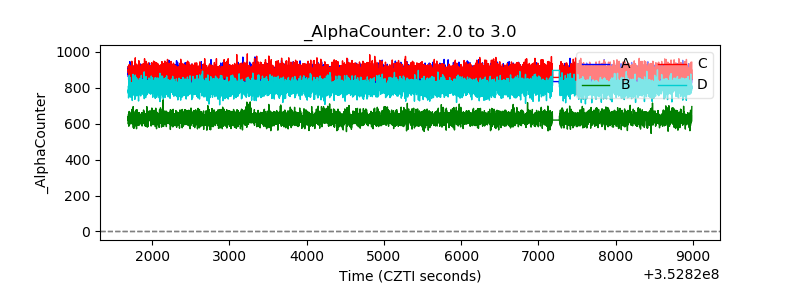 |
| _CPM_Rate | 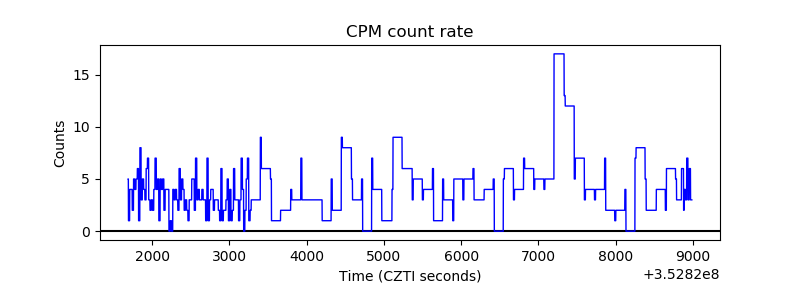 |
| CZT Counter | 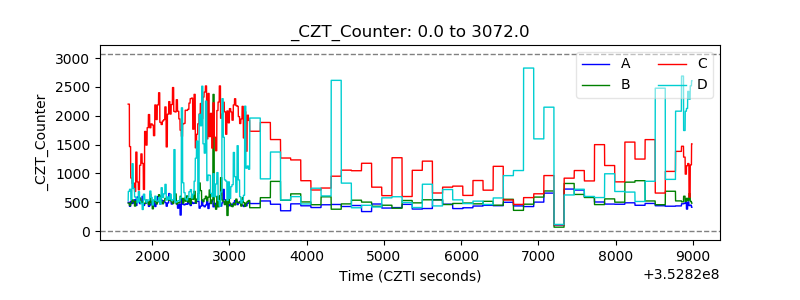 |
| +2.5 Volts monitor |  |
| +5 Volts monitor |  |
| _ROLL_ROT | 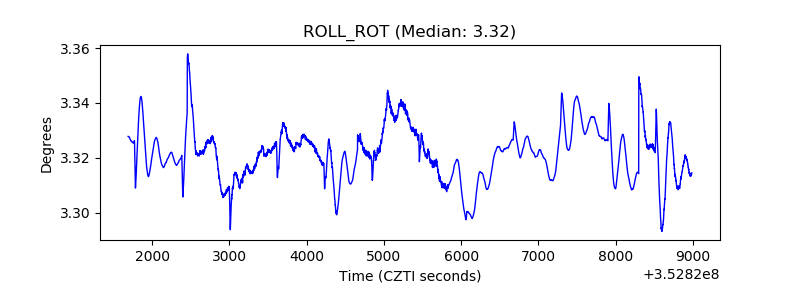 |
| _Roll_DEC | 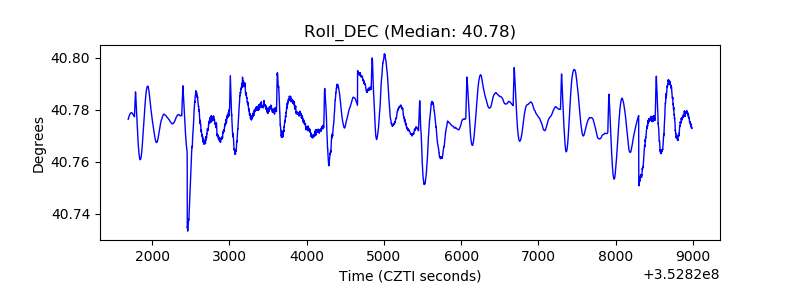 |
| _Roll_RA | 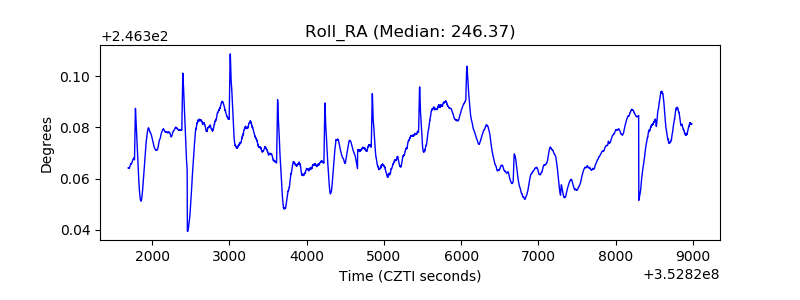 |
| Veto Counter | 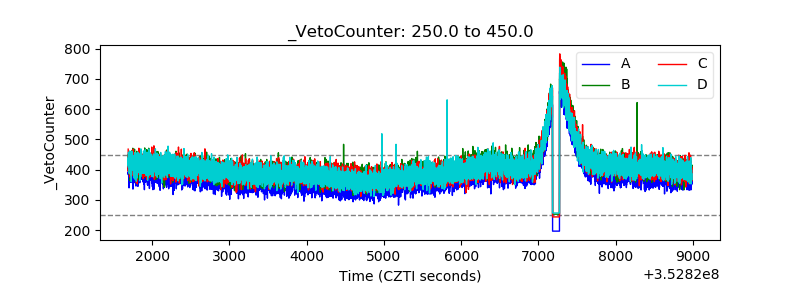 |