| Param | Original file | Final file |
|---|---|---|
| Filename | modeM0/AS1A10_102T11_9000004230_29419cztM0_level2.evt | modeM0/AS1A10_102T11_9000004230_29419cztM0_level2_quad_clean.evt |
| Size (bytes) | 1,015,519,680 | 74,957,760 |
| Size | 968.5 MB | 71.5 MB |
| Events in quadrant A | 3,402,196 | 496,495 |
| Events in quadrant B | 4,094,889 | 500,597 |
| Events in quadrant C | 12,624,230 | 368,921 |
| Events in quadrant D | 10,144,874 | 396,893 |
| Mode SS | |||
|---|---|---|---|
| Quadrant | BADHDUFLAG | Total packets | Discarded packets |
| A | 0 | 146 | 0 |
| B | 0 | 148 | 0 |
| C | 0 | 148 | 0 |
| D | 0 | 148 | 0 |
| Mode M0 | |||
|---|---|---|---|
| Quadrant | BADHDUFLAG | Total packets | Discarded packets |
| A | 0 | 14736 | 1 |
| B | 0 | 16711 | 1 |
| C | 0 | 42585 | 1 |
| D | 0 | 35209 | 2 |
| Mode M9 | |||
|---|---|---|---|
| Quadrant | BADHDUFLAG | Total packets | Discarded packets |
| A | 0 | 4 | 0 |
| B | 0 | 4 | 0 |
| C | 0 | 4 | 0 |
| D | 0 | 4 | 0 |
| Quadrant | Total seconds | Saturated seconds | Saturation percentage |
|---|---|---|---|
| A | 7254 | 46 | 0.634133% |
| B | 7254 | 148 | 2.040254% |
| C | 7255 | 3901 | 53.769814% |
| D | 7254 | 2593 | 35.745795% |
Noise dominated data is calculated using 1-second bins in cleaned event files. If a bin has >2000 counts, and if more than 50% of those come from <1% of pixels, then it is considered to be noise-dominated and hence unusable.
| Quadrant | # 1 sec bins | Bins with >0 counts | Bins with >2000 counts | High rate bins dominated by noise | Noise dominated (total time) | Noise dominated (detector-on time) | Marked lightcurve |
|---|---|---|---|---|---|---|---|
| A | 7674 | 7256 | 0 | 0 | 0.00% | 0.00% | 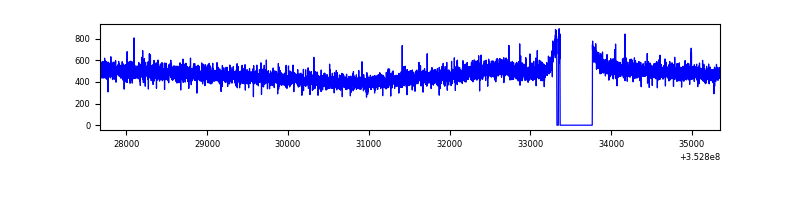 |
| B | 7674 | 7256 | 56 | 56 | 0.73% | 0.77% | 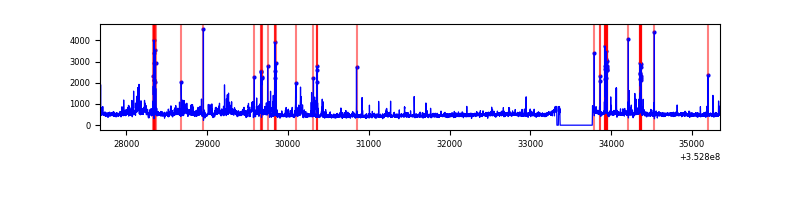 |
| C | 7675 | 7256 | 3010 | 3010 | 39.22% | 41.48% | 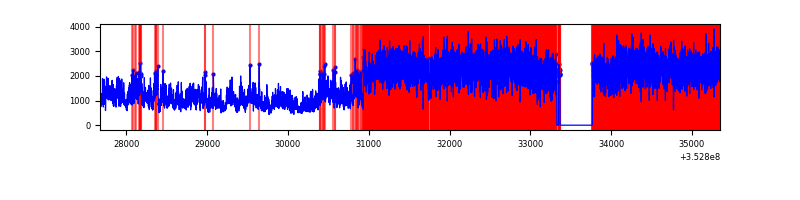 |
| D | 7674 | 7256 | 1904 | 1904 | 24.81% | 26.24% | 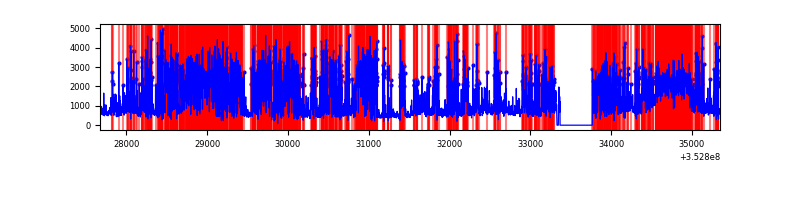 |
Top three noisy pixels from each quadrant. If the there are fewer than three noisy pixels in the level2.evt file, extra rows are filled as -1
| Pixel properties | Quadrant properties | ||||||
|---|---|---|---|---|---|---|---|
| Quadrant | DetID | PixID | Counts | Sigma | Mean | Median | Sigma |
| A | 13 | 254 | 14056 | 73.52 | 880 | 859 | 179.5 |
| A | 3 | 137 | 8688 | 43.61 | 880 | 859 | 179.5 |
| A | 0 | 226 | 7421 | 36.56 | 880 | 859 | 179.5 |
| B | 10 | 245 | 567804 | 3435.94 | 869 | 847 | 165.0 |
| B | 15 | 33 | 34369 | 203.15 | 869 | 847 | 165.0 |
| B | 0 | 156 | 26419 | 154.97 | 869 | 847 | 165.0 |
| C | 3 | 233 | 9899148 | 63294.15 | 666 | 667 | 156.4 |
| C | 14 | 238 | 102566 | 651.58 | 666 | 667 | 156.4 |
| C | 2 | 114 | 14732 | 89.94 | 666 | 667 | 156.4 |
| D | 1 | 52 | 4917990 | 29366.27 | 700 | 680 | 167.4 |
| D | 7 | 80 | 834626 | 4980.34 | 700 | 680 | 167.4 |
| D | 13 | 153 | 652872 | 3894.9 | 700 | 680 | 167.4 |
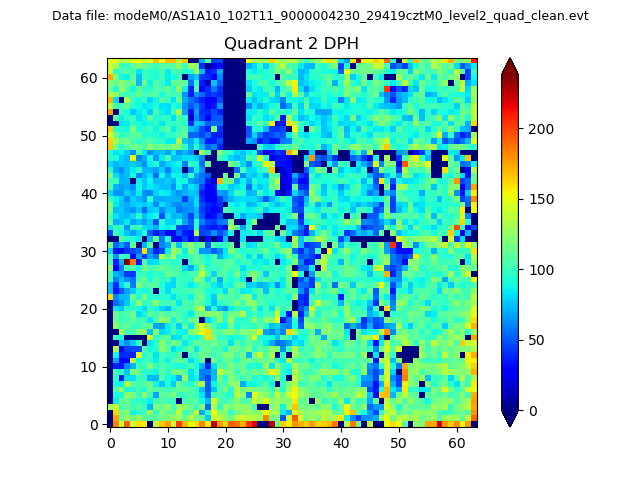
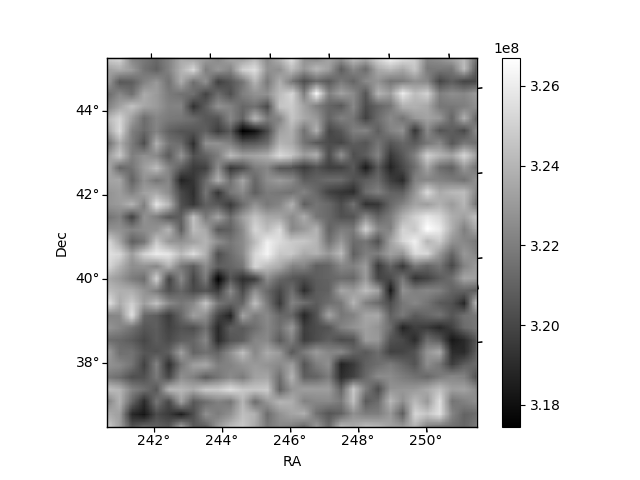
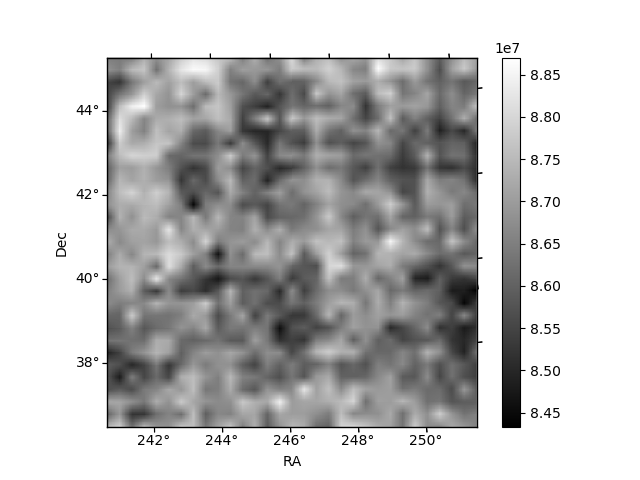
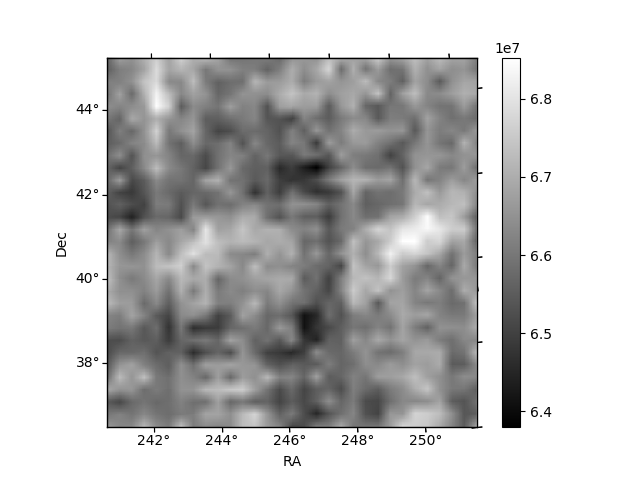
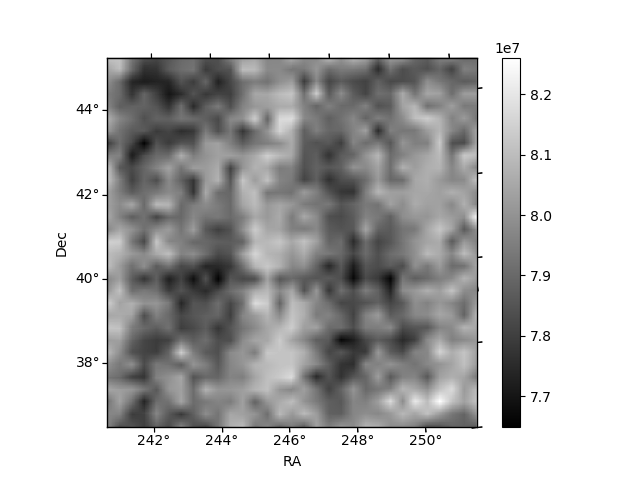
Histogram calculated using DETX and DETY for each event in the final _common_clean file
| Quadrant A | 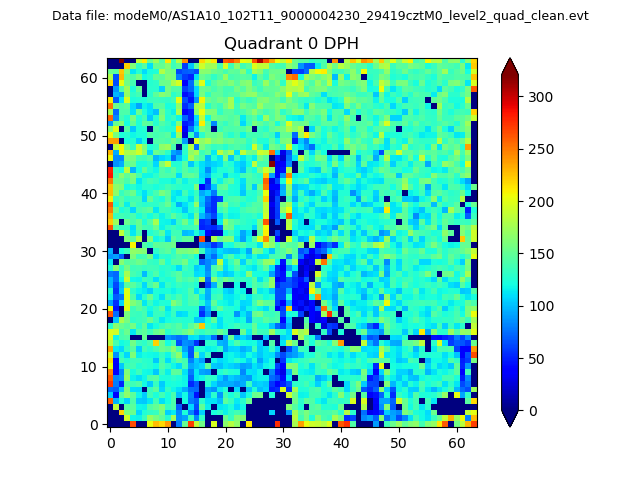 |
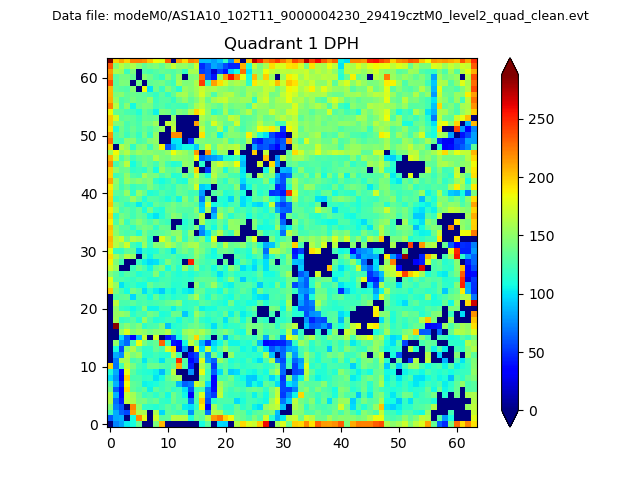 |
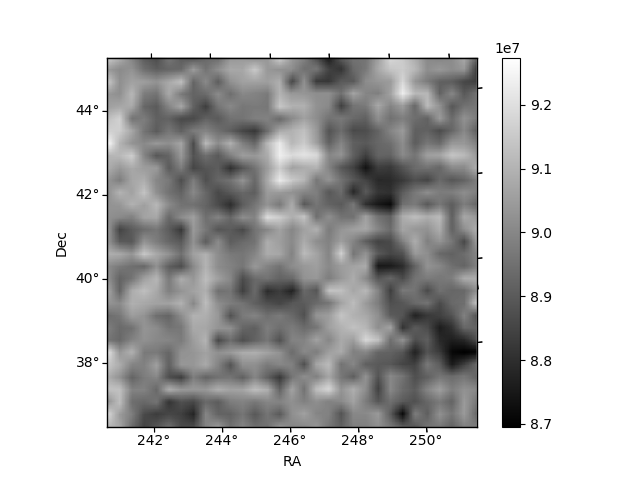
Quadrant B |
|---|---|---|---|
| Quadrant D | 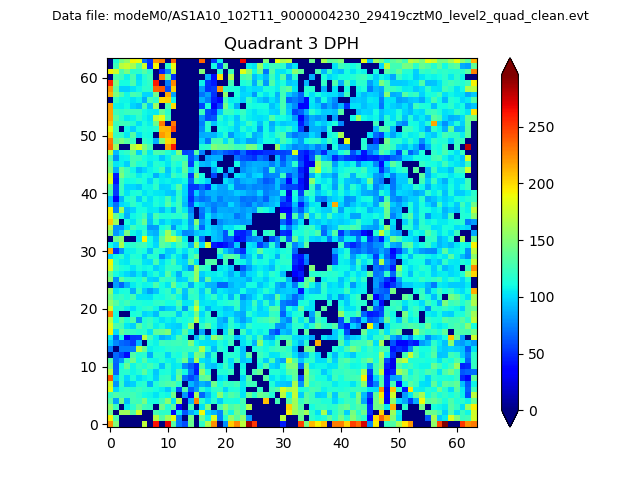 |
 |
Quadrant C |
| Plot type | Count rate plots | Images |
|---|---|---|
| Comparison with Poisson distribution Blue bars denote a histogram of data divided into 1 sec bins. Red curve is a Poisson curve with rate = median count rate of data. |
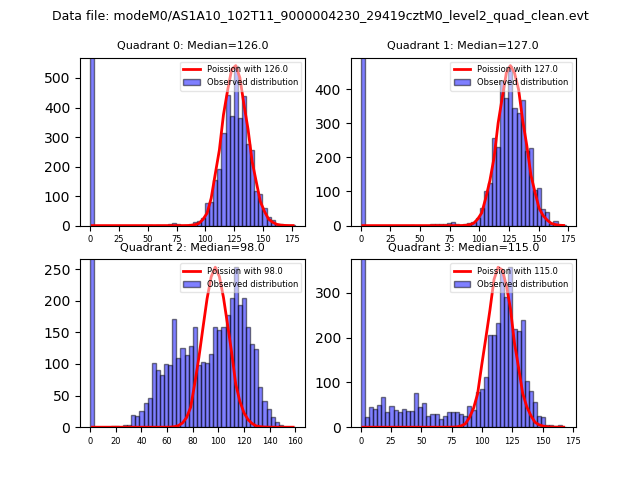 |
 |
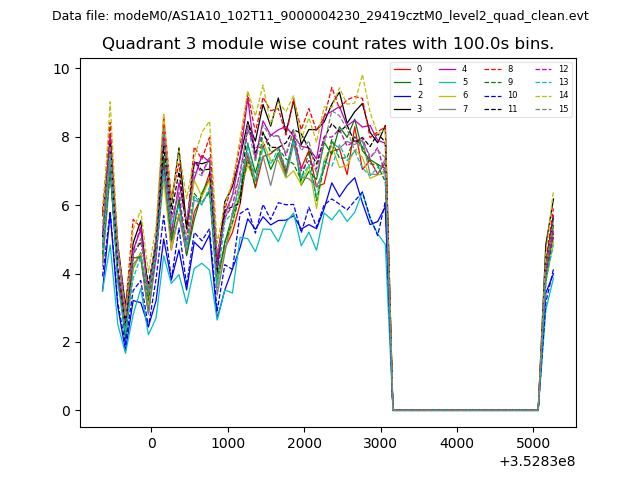
| Quadrant-wise count rates Data is divided into 100 sec bins |
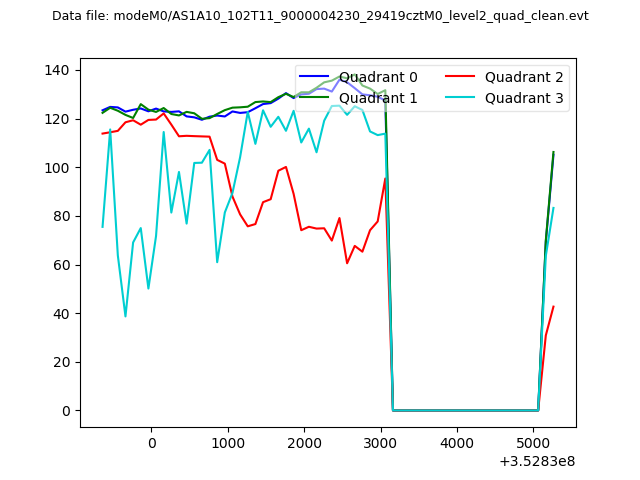 |
|
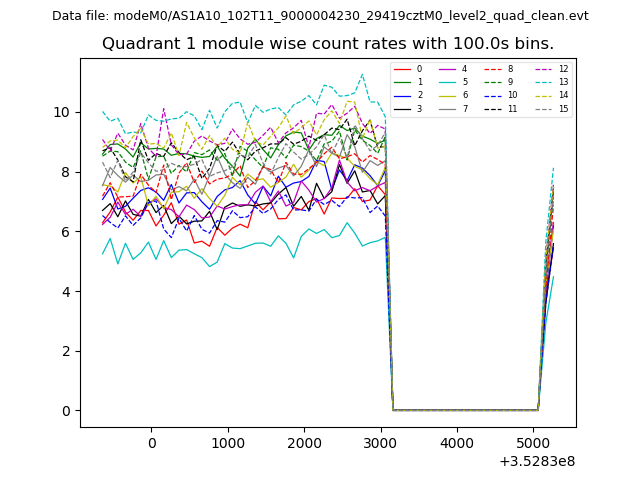
| Module-wise count rates for Quadrant A Data is divided into 100 sec bins |
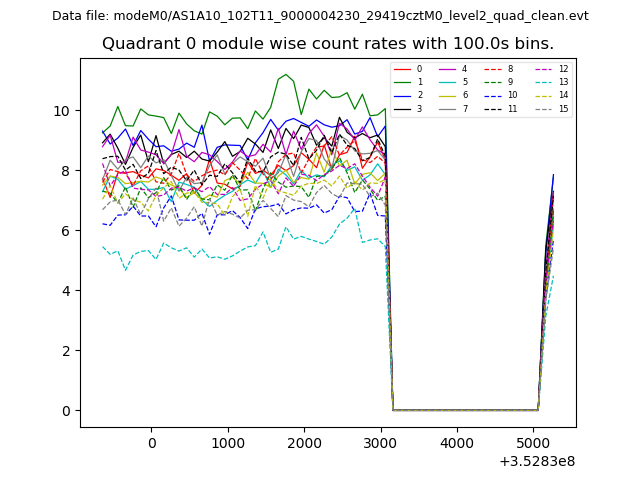 |
 |
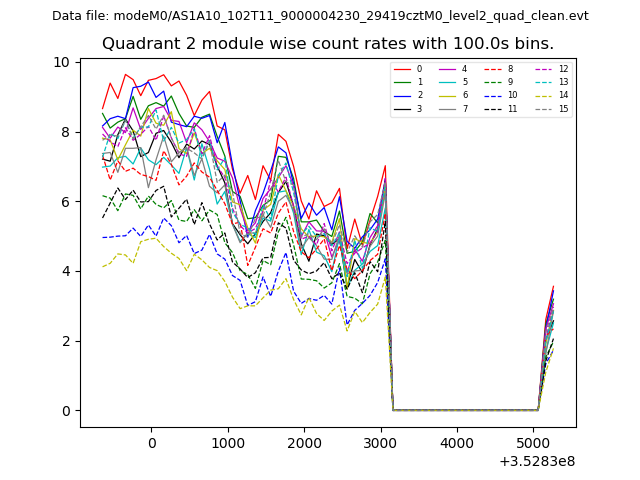
| Module-wise count rates for Quadrant B Data is divided into 100 sec bins |
 |
 |
| Module-wise count rates for Quadrant C Data is divided into 100 sec bins |
 |
 |
| Module-wise count rates for Quadrant D Data is divided into 100 sec bins |
 |
 |
| Parameter | Plot |
|---|---|
| CZT HV Monitor | 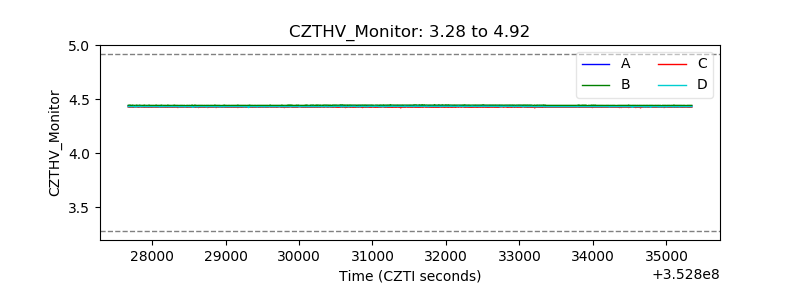 |
| D_VDD | 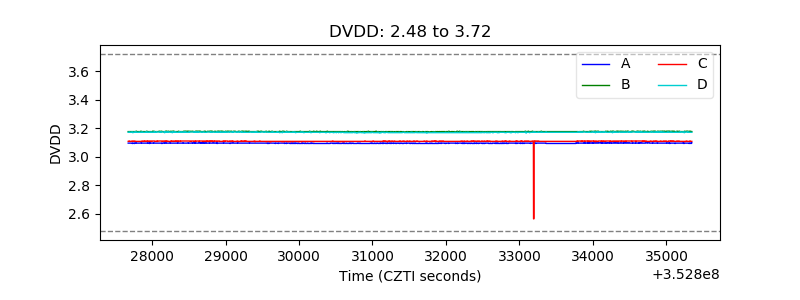 |
| Temperature 1 | 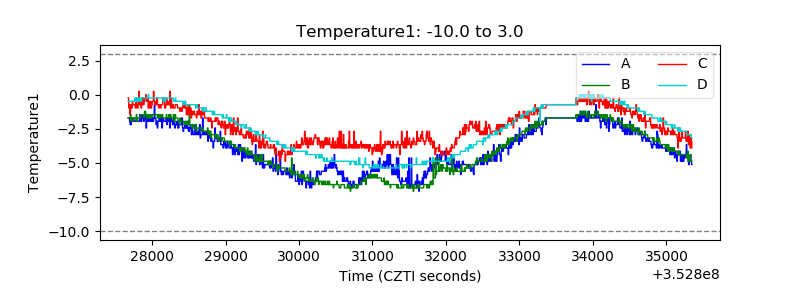 |
| Veto HV Monitor | 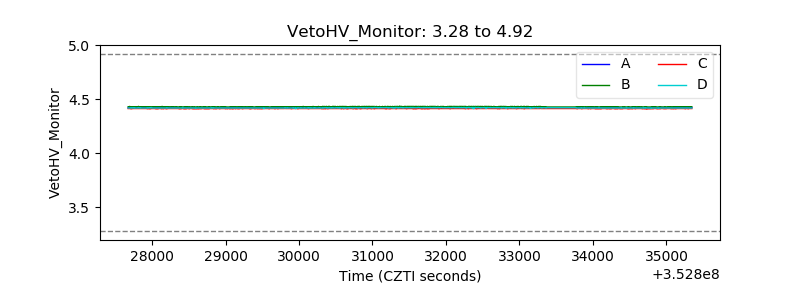 |
| Veto LLD | 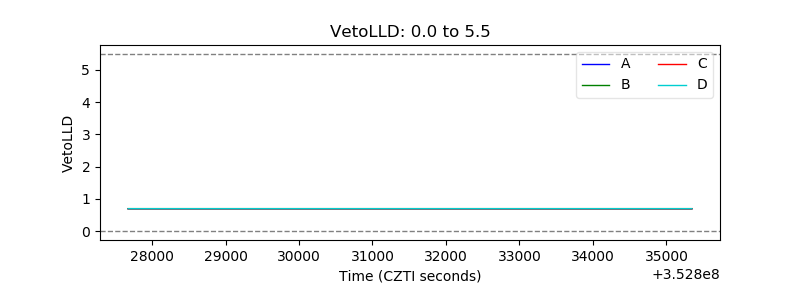 |
| Alpha Counter | 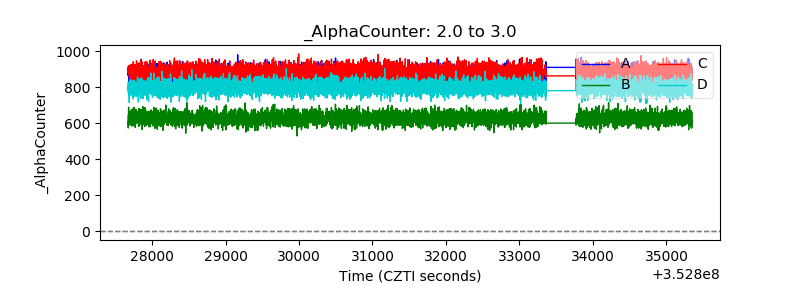 |
| _CPM_Rate | 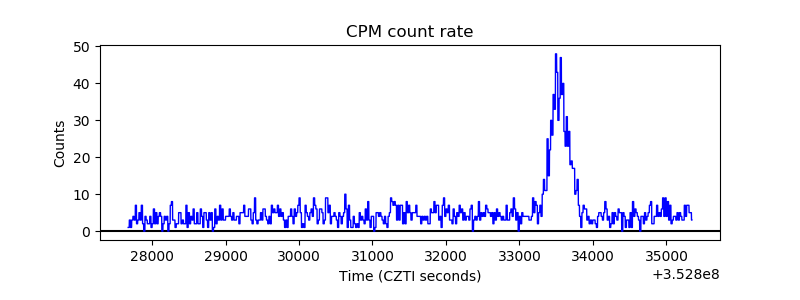 |
| CZT Counter |  |
| +2.5 Volts monitor |  |
| +5 Volts monitor | 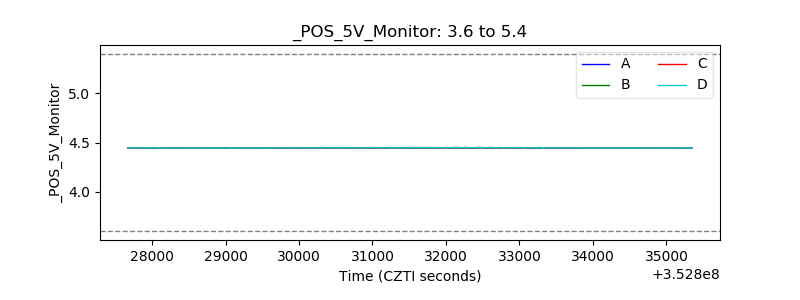 |
| _ROLL_ROT | 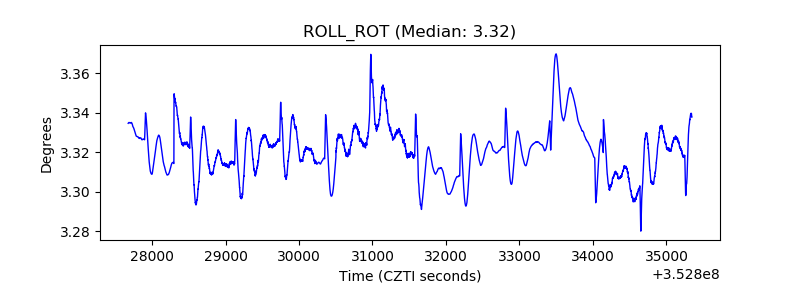 |
| _Roll_DEC | 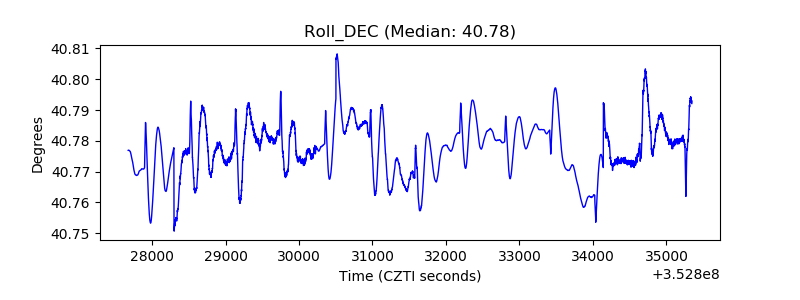 |
| _Roll_RA | 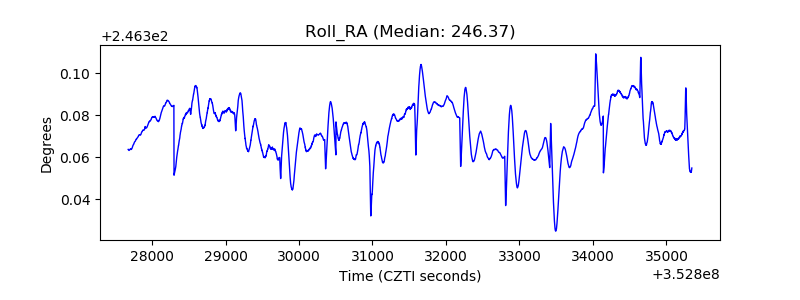 |
| Veto Counter | 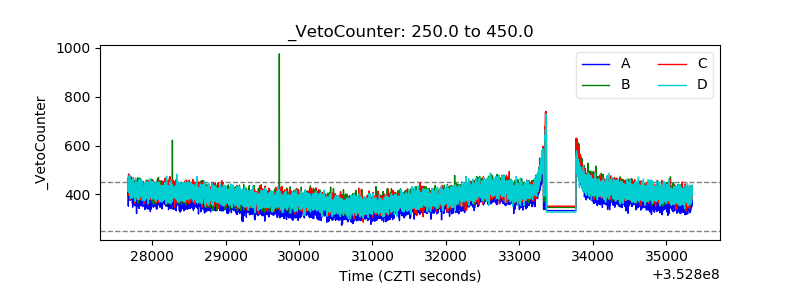 |