| Param | Original file | Final file |
|---|---|---|
| Filename | modeM0/AS1A10_102T11_9000004230_29421cztM0_level2.evt | modeM0/AS1A10_102T11_9000004230_29421cztM0_level2_quad_clean.evt |
| Size (bytes) | 278,729,280 | 17,297,280 |
| Size | 265.8 MB | 16.5 MB |
| Events in quadrant A | 806,361 | 113,125 |
| Events in quadrant B | 1,016,022 | 112,166 |
| Events in quadrant C | 4,081,710 | 64,531 |
| Events in quadrant D | 2,415,709 | 103,708 |
| Mode SS | |||
|---|---|---|---|
| Quadrant | BADHDUFLAG | Total packets | Discarded packets |
| A | 0 | 36 | 0 |
| B | 0 | 36 | 0 |
| C | 0 | 36 | 0 |
| D | 0 | 36 | 0 |
| Mode M0 | |||
|---|---|---|---|
| Quadrant | BADHDUFLAG | Total packets | Discarded packets |
| A | 0 | 3526 | 0 |
| B | 0 | 4077 | 0 |
| C | 0 | 13328 | 0 |
| D | 0 | 8432 | 0 |
| Quadrant | Total seconds | Saturated seconds | Saturation percentage |
|---|---|---|---|
| A | 1758 | 0 | 0.000000% |
| B | 1759 | 45 | 2.558272% |
| C | 1759 | 1733 | 98.521887% |
| D | 1759 | 583 | 33.143832% |
Noise dominated data is calculated using 1-second bins in cleaned event files. If a bin has >2000 counts, and if more than 50% of those come from <1% of pixels, then it is considered to be noise-dominated and hence unusable.
| Quadrant | # 1 sec bins | Bins with >0 counts | Bins with >2000 counts | High rate bins dominated by noise | Noise dominated (total time) | Noise dominated (detector-on time) | Marked lightcurve |
|---|---|---|---|---|---|---|---|
| A | 1758 | 1758 | 0 | 0 | 0.00% | 0.00% | 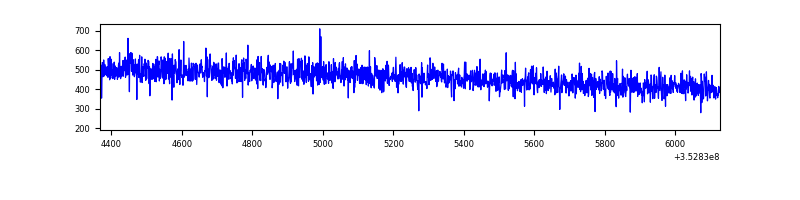 |
| B | 1759 | 1759 | 30 | 30 | 1.71% | 1.71% | 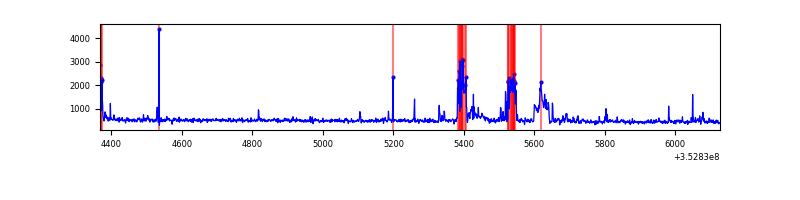 |
| C | 1759 | 1759 | 1398 | 1398 | 79.48% | 79.48% | 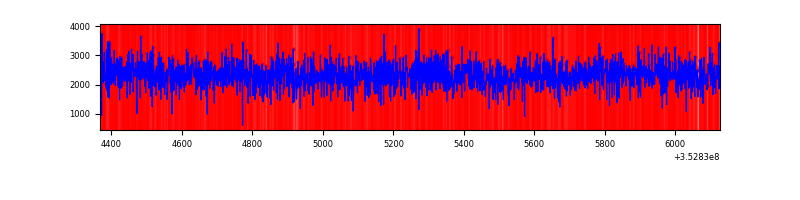 |
| D | 1759 | 1759 | 434 | 434 | 24.67% | 24.67% | 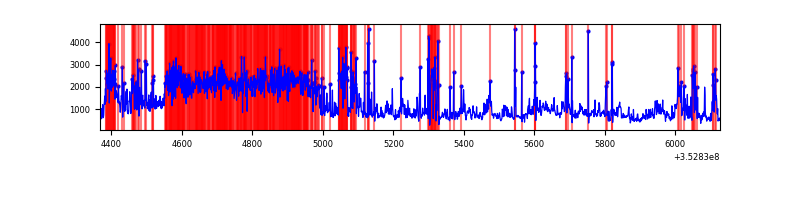 |
Top three noisy pixels from each quadrant. If the there are fewer than three noisy pixels in the level2.evt file, extra rows are filled as -1
| Pixel properties | Quadrant properties | ||||||
|---|---|---|---|---|---|---|---|
| Quadrant | DetID | PixID | Counts | Sigma | Mean | Median | Sigma |
| A | 13 | 254 | 3770 | 80.25 | 208 | 203 | 44.4 |
| A | 3 | 137 | 1952 | 39.35 | 208 | 203 | 44.4 |
| A | 0 | 226 | 1759 | 35.01 | 208 | 203 | 44.4 |
| B | 10 | 245 | 153047 | 3727.18 | 207 | 202 | 41.0 |
| B | 10 | 247 | 36056 | 874.31 | 207 | 202 | 41.0 |
| B | 12 | 111 | 4793 | 111.95 | 207 | 202 | 41.0 |
| C | 3 | 233 | 3569585 | 116238.09 | 124 | 125 | 30.7 |
| C | 14 | 238 | 18912 | 611.79 | 124 | 125 | 30.7 |
| C | 15 | 208 | 2984 | 93.1 | 124 | 125 | 30.7 |
| D | 1 | 52 | 677605 | 15601.32 | 173 | 168 | 43.4 |
| D | 13 | 153 | 633364 | 14582.45 | 173 | 168 | 43.4 |
| D | 8 | 195 | 189415 | 4358.34 | 173 | 168 | 43.4 |
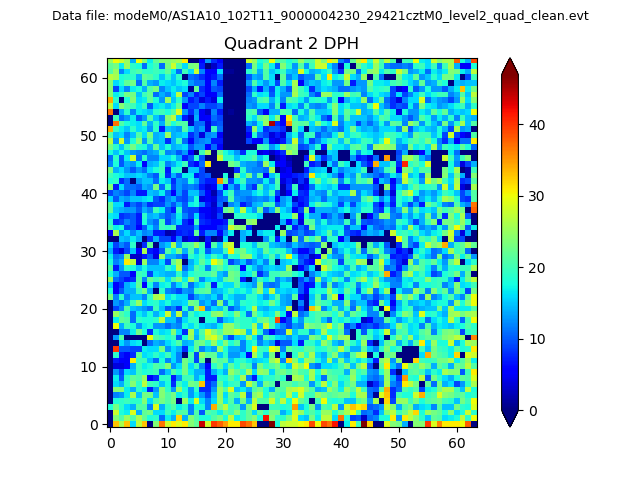
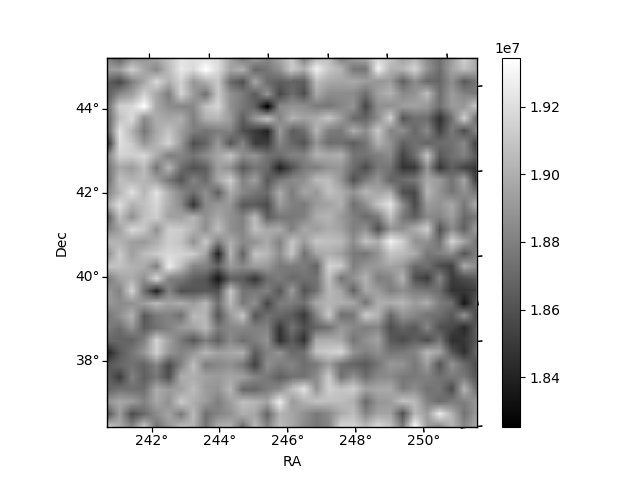
Histogram calculated using DETX and DETY for each event in the final _common_clean file
| Quadrant A |  |
 |
Quadrant B |
|---|---|---|---|
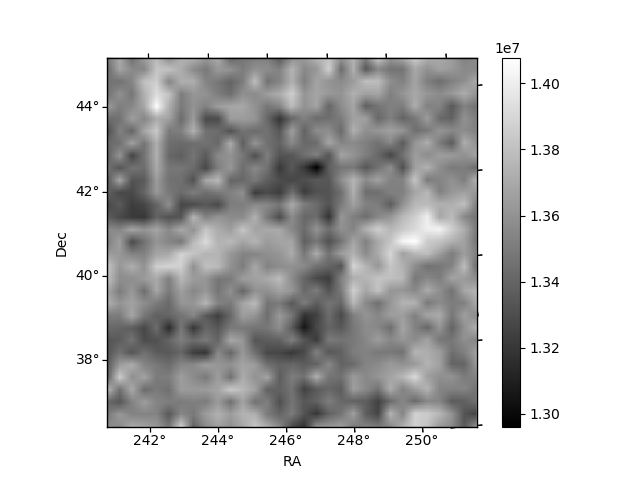
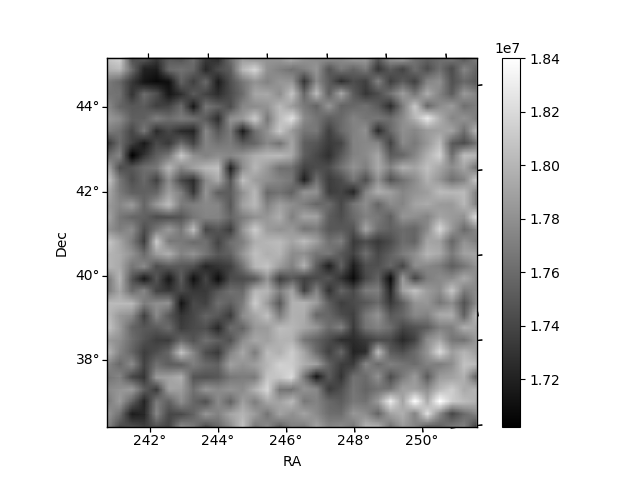
| Quadrant D | 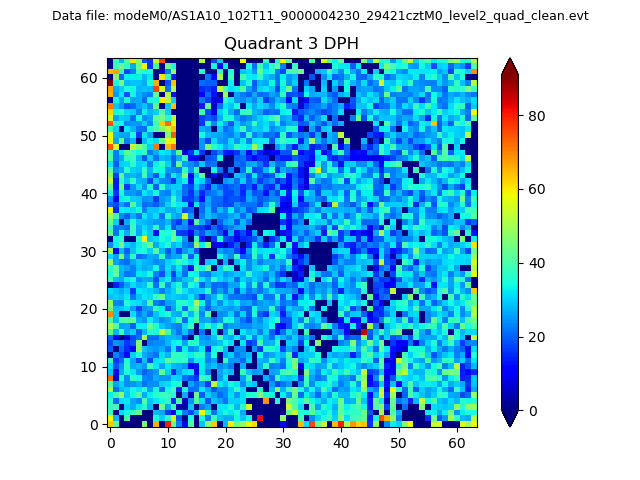 |
 |
Quadrant C |
| Plot type | Count rate plots | Images |
|---|---|---|
| Comparison with Poisson distribution Blue bars denote a histogram of data divided into 1 sec bins. Red curve is a Poisson curve with rate = median count rate of data. |
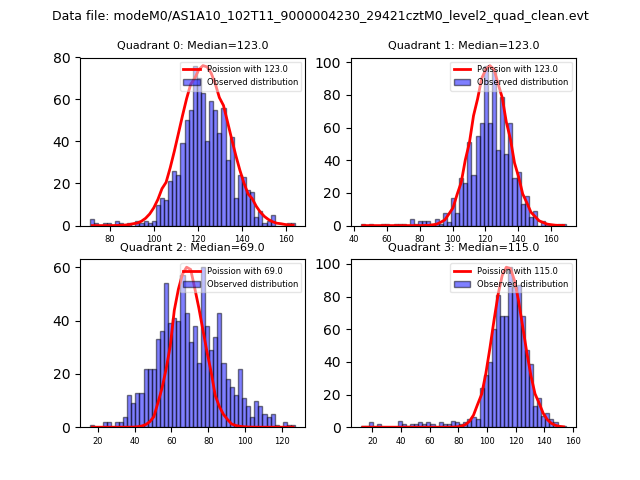 |
 |
| Quadrant-wise count rates Data is divided into 100 sec bins |
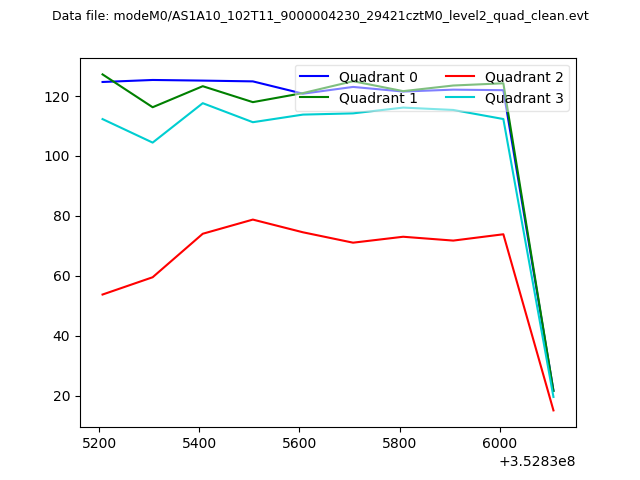 |
|
| Module-wise count rates for Quadrant A Data is divided into 100 sec bins |
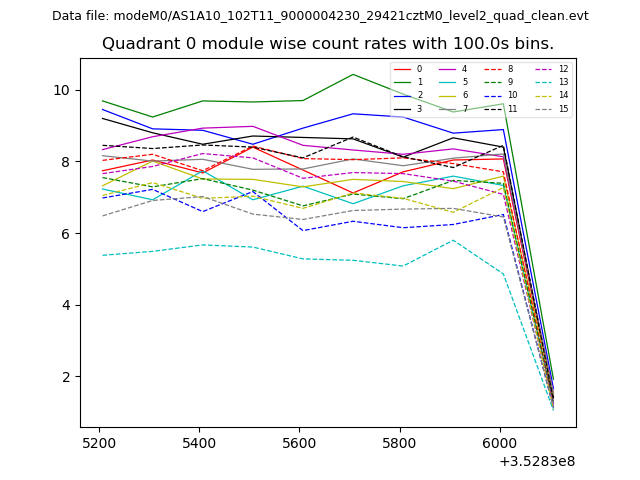 |
 |
| Module-wise count rates for Quadrant B Data is divided into 100 sec bins |
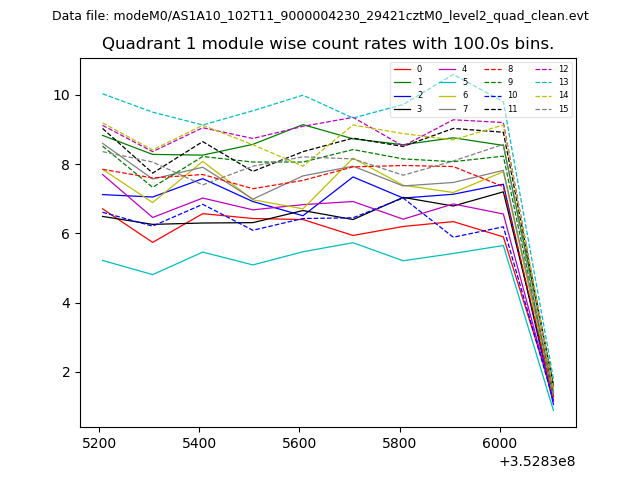 |
 |
| Module-wise count rates for Quadrant C Data is divided into 100 sec bins |
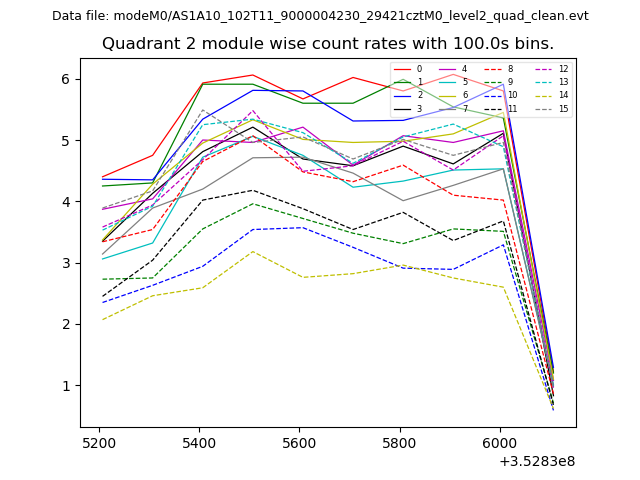 |
 |
| Module-wise count rates for Quadrant D Data is divided into 100 sec bins |
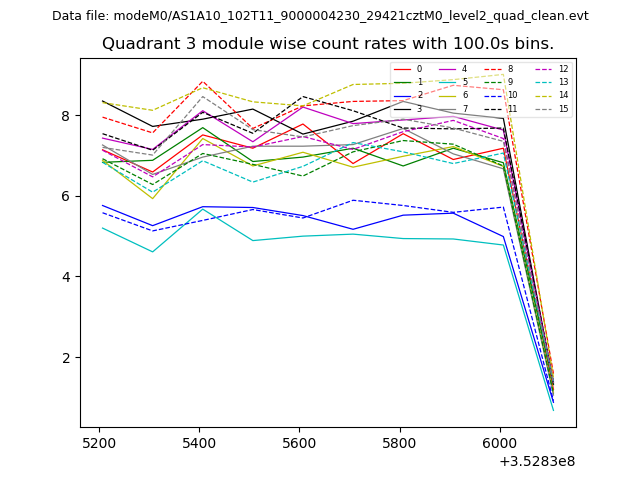 |
 |
| Parameter | Plot |
|---|---|
| CZT HV Monitor | 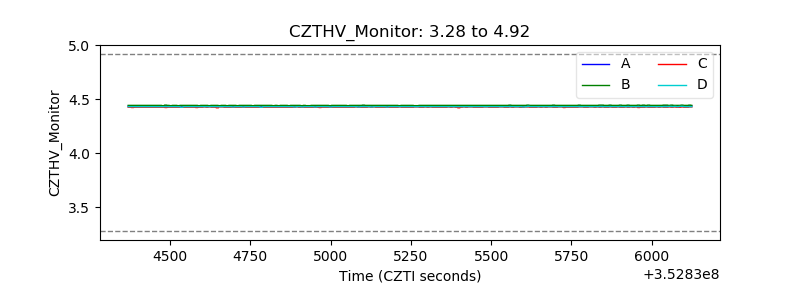 |
| D_VDD | 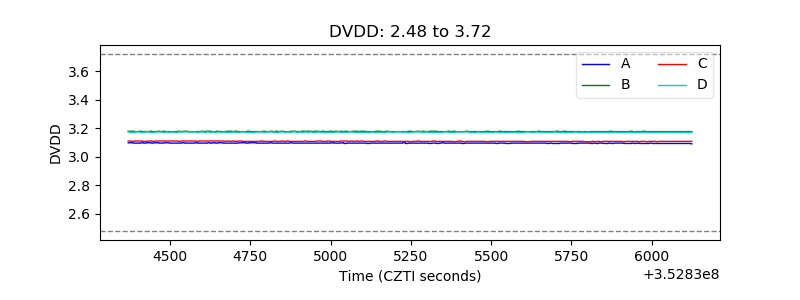 |
| Temperature 1 | 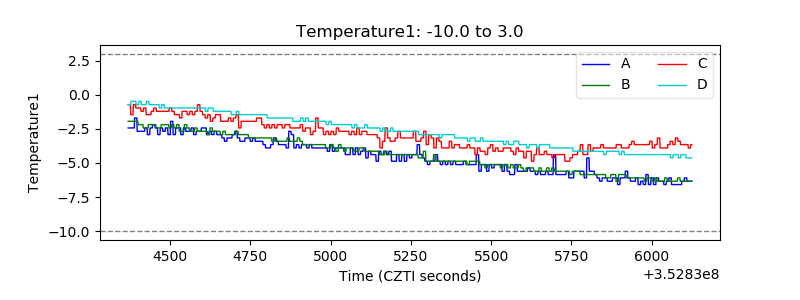 |
| Veto HV Monitor | 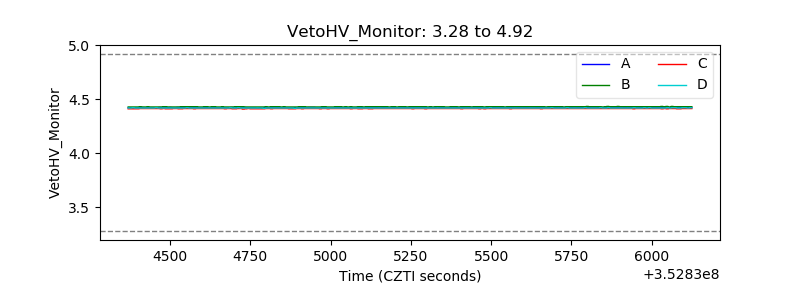 |
| Veto LLD | 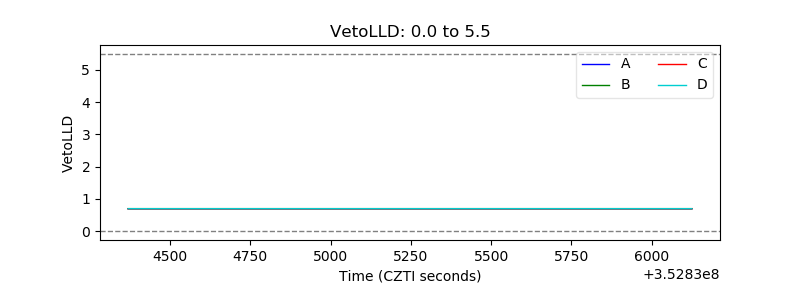 |
| Alpha Counter | 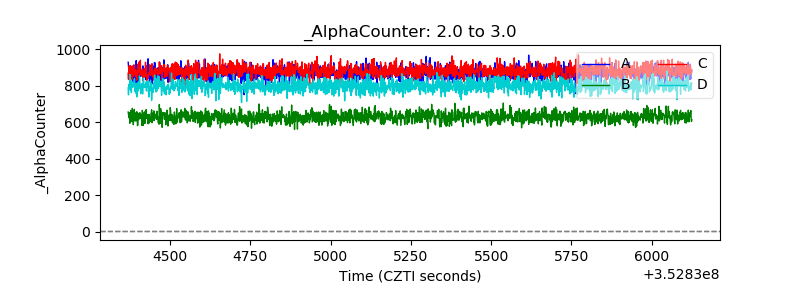 |
| _CPM_Rate | 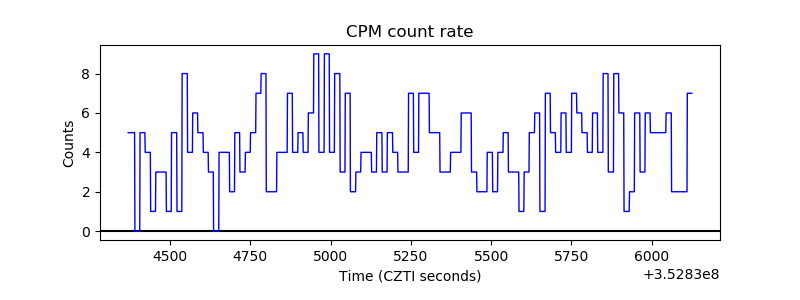 |
| CZT Counter | 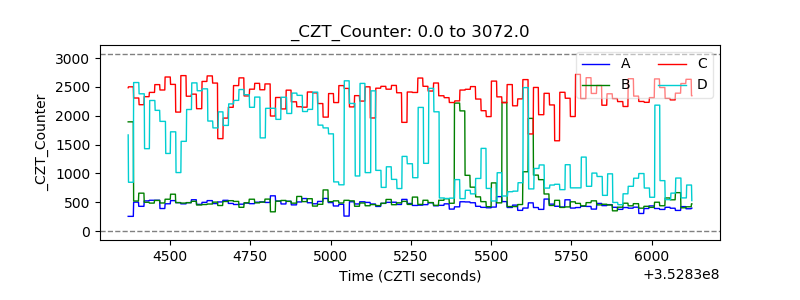 |
| +2.5 Volts monitor |  |
| +5 Volts monitor |  |
| _ROLL_ROT | 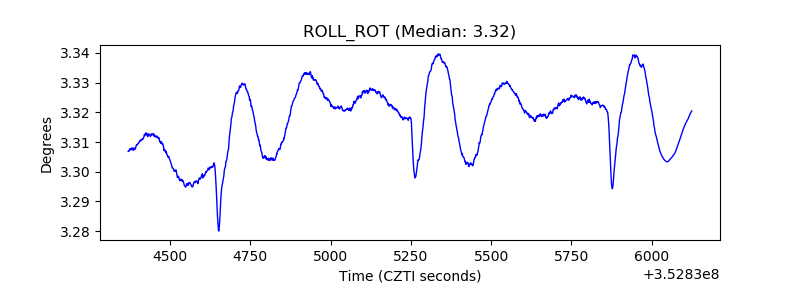 |
| _Roll_DEC | 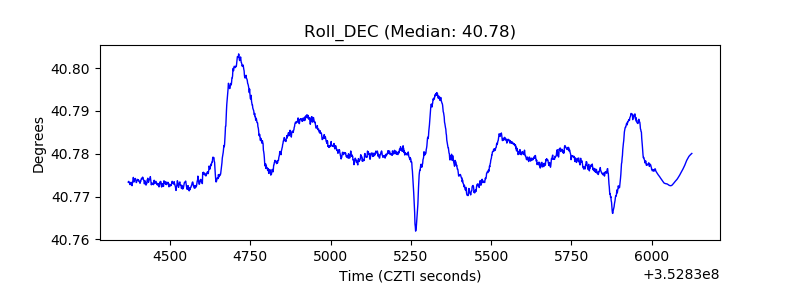 |
| _Roll_RA | 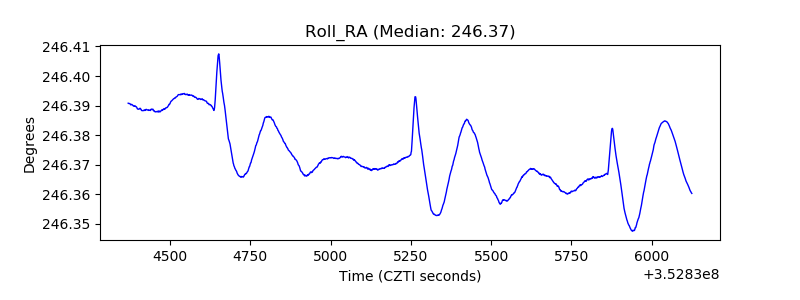 |
| Veto Counter | 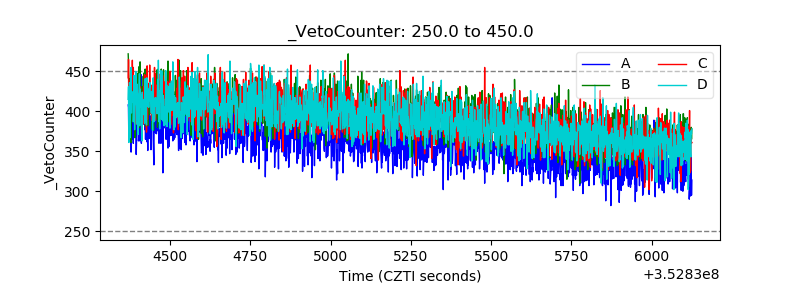 |