| Param | Original file | Final file |
|---|---|---|
| Filename | modeM0/AS1A10_102T05_9000004232_29421cztM0_level2.evt | modeM0/AS1A10_102T05_9000004232_29421cztM0_level2_quad_clean.evt |
| Size (bytes) | 1,319,840,640 | 123,822,720 |
| Size | 1.2 GB | 118.1 MB |
| Events in quadrant A | 4,681,973 | 847,659 |
| Events in quadrant B | 5,094,433 | 864,116 |
| Events in quadrant C | 22,312,323 | 536,484 |
| Events in quadrant D | 7,213,107 | 811,226 |
| Mode M9 | |||
|---|---|---|---|
| Quadrant | BADHDUFLAG | Total packets | Discarded packets |
| A | 0 | 13 | 0 |
| B | 0 | 13 | 0 |
| C | 0 | 13 | 0 |
| D | 0 | 13 | 0 |
| Mode SS | |||
|---|---|---|---|
| Quadrant | BADHDUFLAG | Total packets | Discarded packets |
| A | 0 | 202 | 0 |
| B | 0 | 202 | 0 |
| C | 0 | 202 | 0 |
| D | 0 | 202 | 0 |
| Mode M0 | |||
|---|---|---|---|
| Quadrant | BADHDUFLAG | Total packets | Discarded packets |
| A | 0 | 20306 | 2 |
| B | 0 | 21509 | 3 |
| C | 0 | 72964 | 2 |
| D | 0 | 28335 | 2 |
| Quadrant | Total seconds | Saturated seconds | Saturation percentage |
|---|---|---|---|
| A | 9921 | 56 | 0.564459% |
| B | 9920 | 119 | 1.199597% |
| C | 9920 | 9111 | 91.844758% |
| D | 9920 | 451 | 4.546371% |
Noise dominated data is calculated using 1-second bins in cleaned event files. If a bin has >2000 counts, and if more than 50% of those come from <1% of pixels, then it is considered to be noise-dominated and hence unusable.
| Quadrant | # 1 sec bins | Bins with >0 counts | Bins with >2000 counts | High rate bins dominated by noise | Noise dominated (total time) | Noise dominated (detector-on time) | Marked lightcurve |
|---|---|---|---|---|---|---|---|
| A | 11246 | 9923 | 0 | 0 | 0.00% | 0.00% | 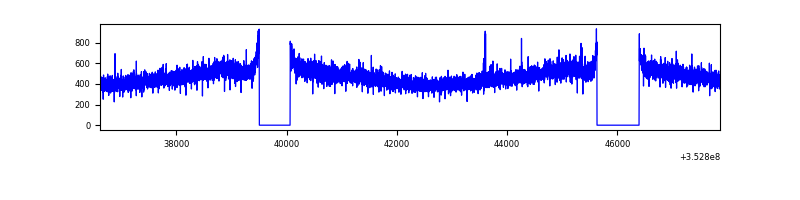 |
| B | 11245 | 9922 | 26 | 26 | 0.23% | 0.26% | 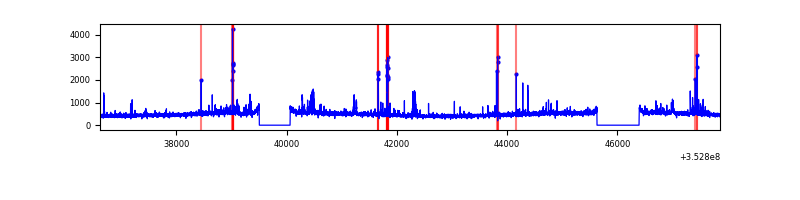 |
| C | 11245 | 9922 | 7163 | 7163 | 63.70% | 72.19% | 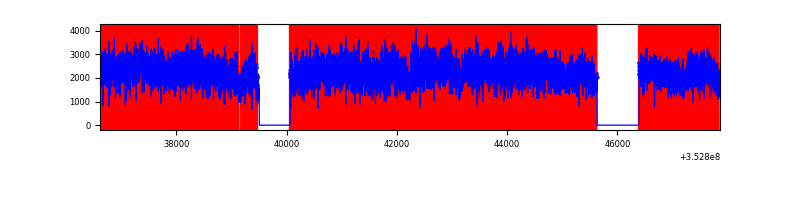 |
| D | 11245 | 9922 | 313 | 313 | 2.78% | 3.15% | 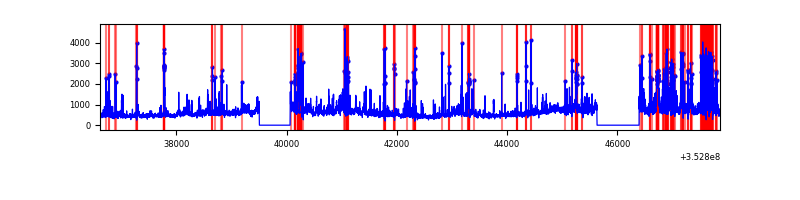 |
Top three noisy pixels from each quadrant. If the there are fewer than three noisy pixels in the level2.evt file, extra rows are filled as -1
| Pixel properties | Quadrant properties | ||||||
|---|---|---|---|---|---|---|---|
| Quadrant | DetID | PixID | Counts | Sigma | Mean | Median | Sigma |
| A | 13 | 254 | 18840 | 71.97 | 1211 | 1186 | 245.3 |
| A | 3 | 137 | 12197 | 44.89 | 1211 | 1186 | 245.3 |
| A | 0 | 226 | 10384 | 37.5 | 1211 | 1186 | 245.3 |
| B | 10 | 245 | 271940 | 1170.17 | 1201 | 1169 | 231.4 |
| B | 12 | 111 | 29006 | 120.3 | 1201 | 1169 | 231.4 |
| B | 0 | 190 | 27774 | 114.98 | 1201 | 1169 | 231.4 |
| C | 3 | 233 | 19003237 | 101351.83 | 810 | 816 | 187.5 |
| C | 14 | 238 | 121369 | 642.98 | 810 | 816 | 187.5 |
| C | 2 | 114 | 16788 | 85.19 | 810 | 816 | 187.5 |
| D | 8 | 195 | 846863 | 3052.92 | 1161 | 1129 | 277.0 |
| D | 7 | 80 | 663760 | 2391.96 | 1161 | 1129 | 277.0 |
| D | 1 | 52 | 660434 | 2379.95 | 1161 | 1129 | 277.0 |
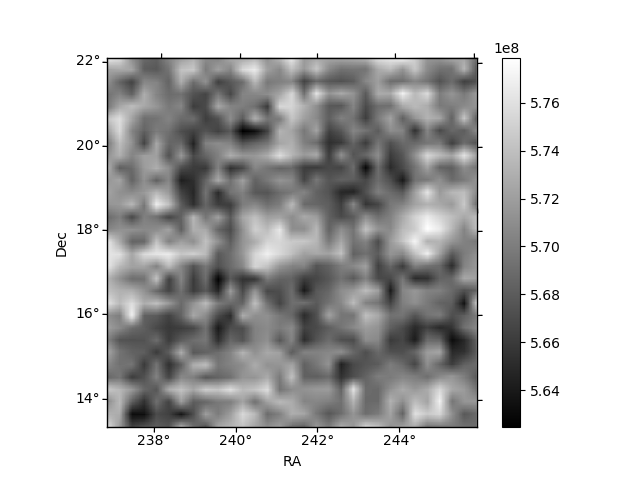
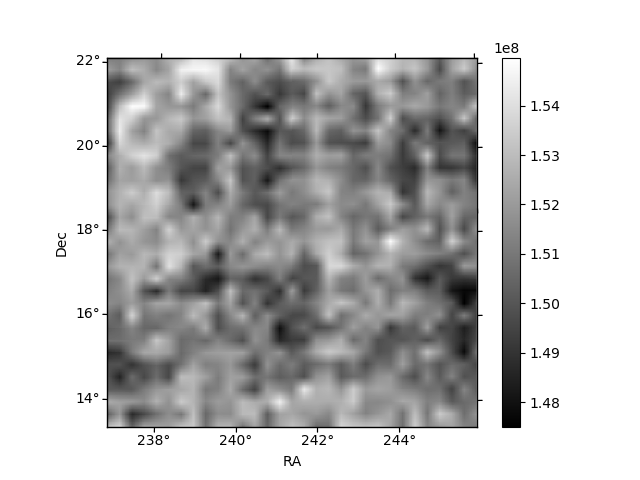
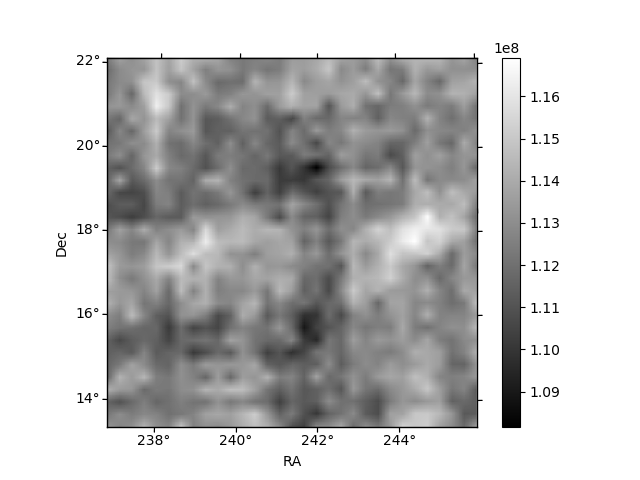
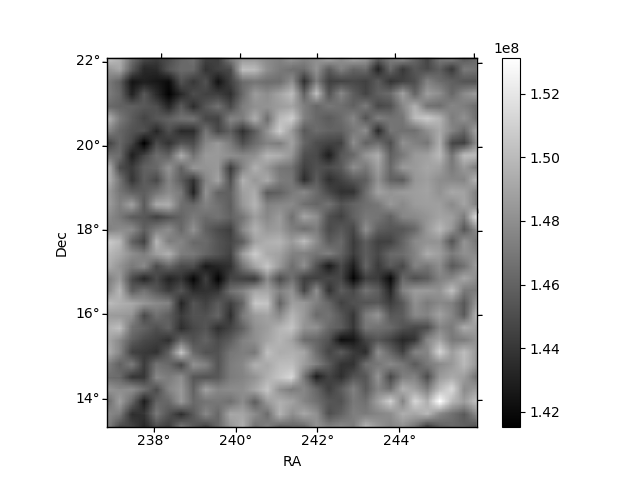
Histogram calculated using DETX and DETY for each event in the final _common_clean file
| Quadrant A | 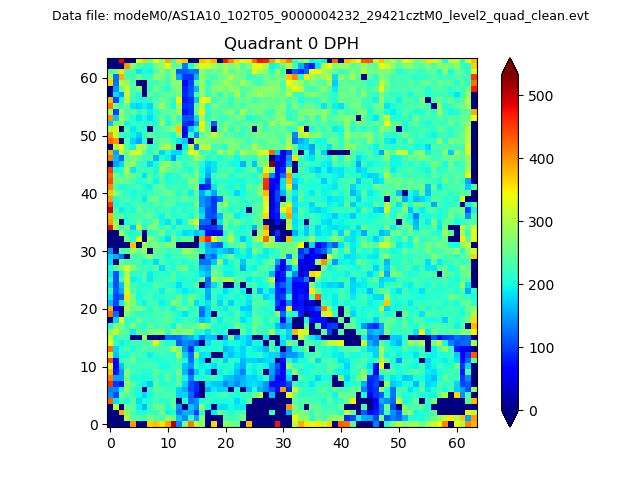 |
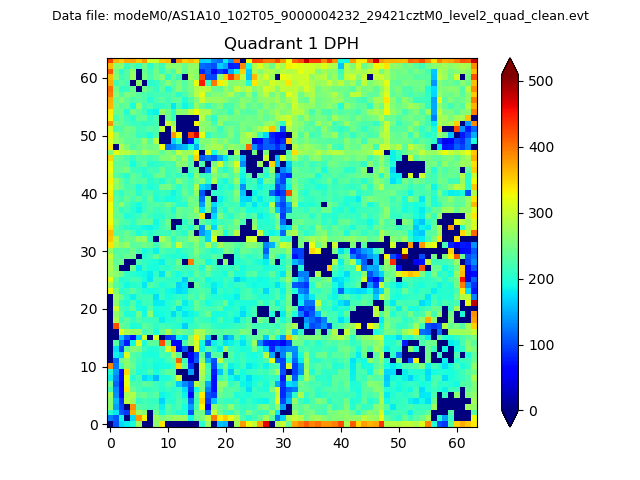 |
Quadrant B |
|---|---|---|---|
| Quadrant D | 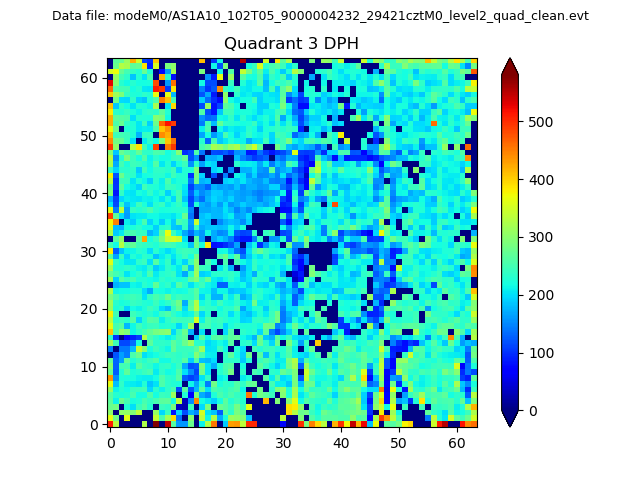 |
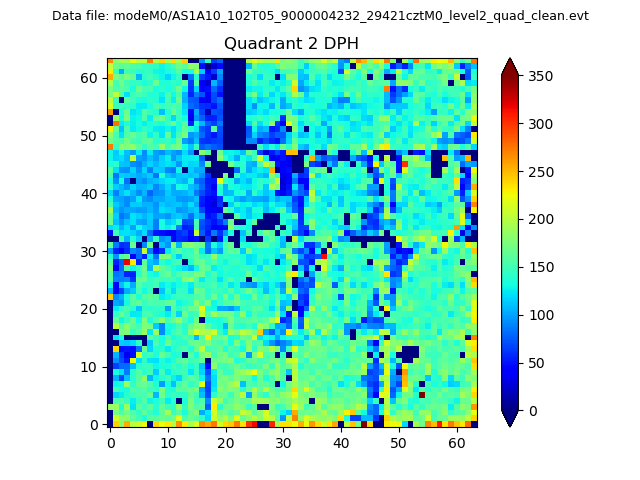 |
Quadrant C |
| Plot type | Count rate plots | Images |
|---|---|---|
| Comparison with Poisson distribution Blue bars denote a histogram of data divided into 1 sec bins. Red curve is a Poisson curve with rate = median count rate of data. |
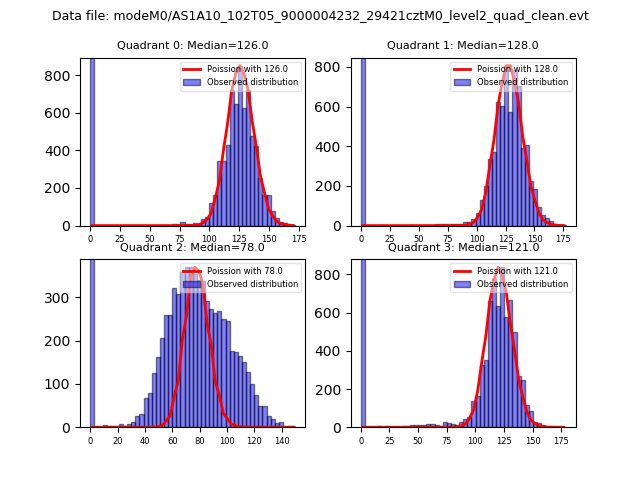 |
 |
| Quadrant-wise count rates Data is divided into 100 sec bins |
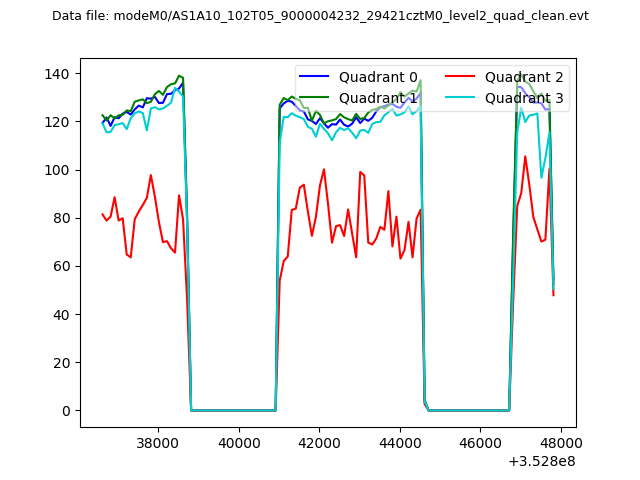 |
|
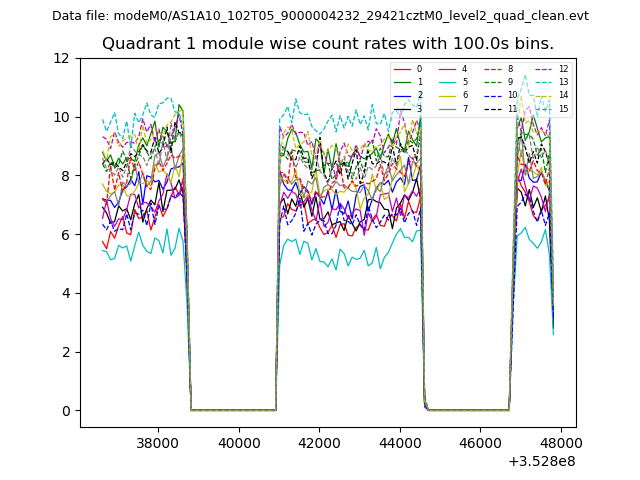
| Module-wise count rates for Quadrant A Data is divided into 100 sec bins |
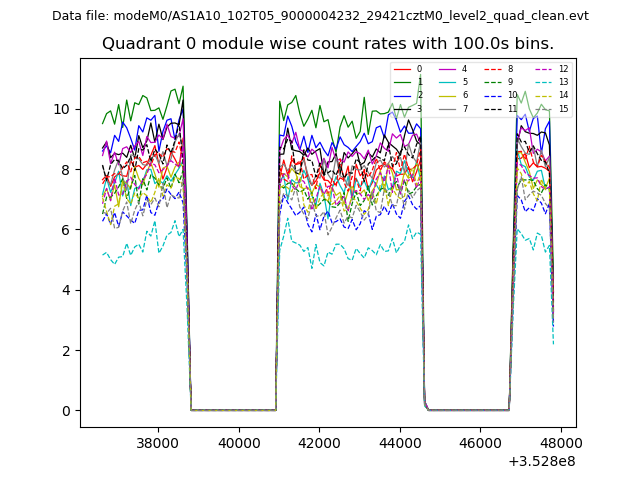 |
 |
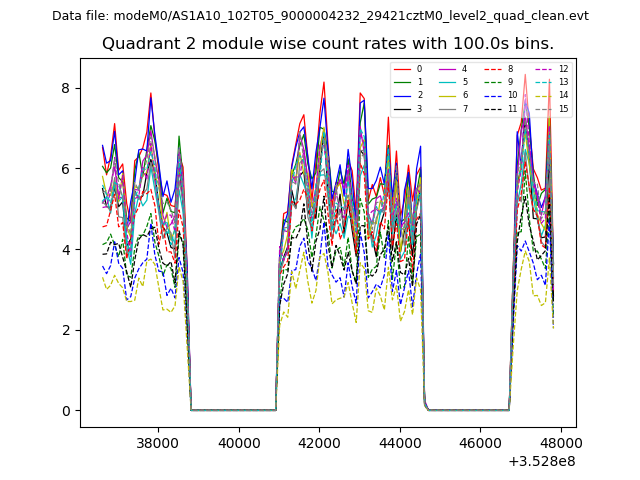
| Module-wise count rates for Quadrant B Data is divided into 100 sec bins |
 |
 |
| Module-wise count rates for Quadrant C Data is divided into 100 sec bins |
 |
 |
| Module-wise count rates for Quadrant D Data is divided into 100 sec bins |
 |
 |
| Parameter | Plot |
|---|---|
| CZT HV Monitor | 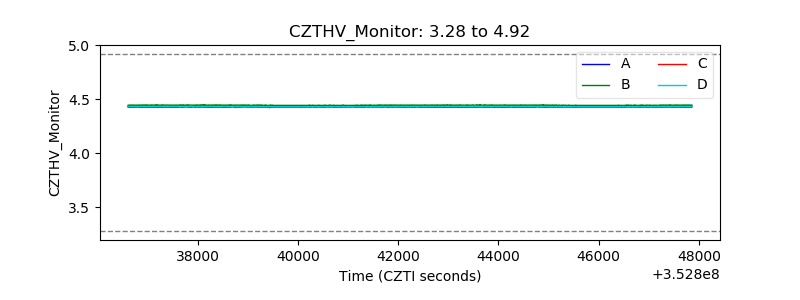 |
| D_VDD |  |
| Temperature 1 |  |
| Veto HV Monitor | 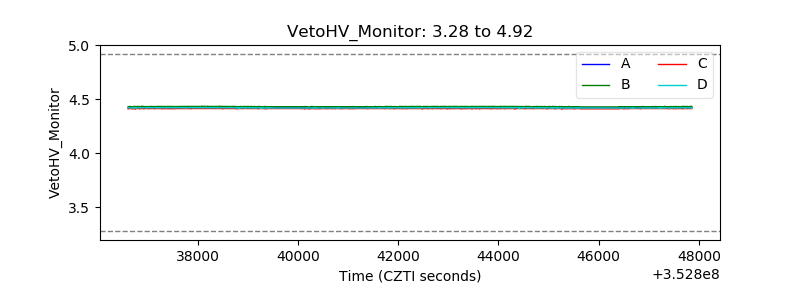 |
| Veto LLD | 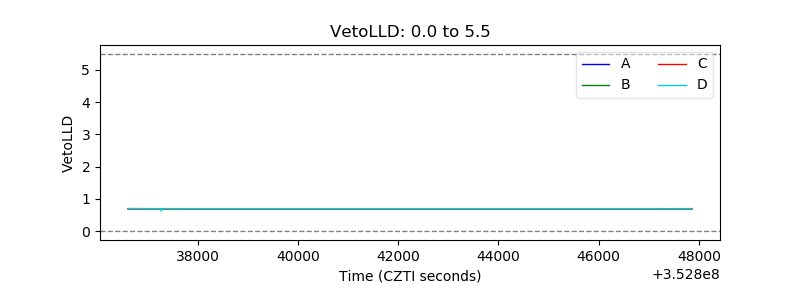 |
| Alpha Counter | 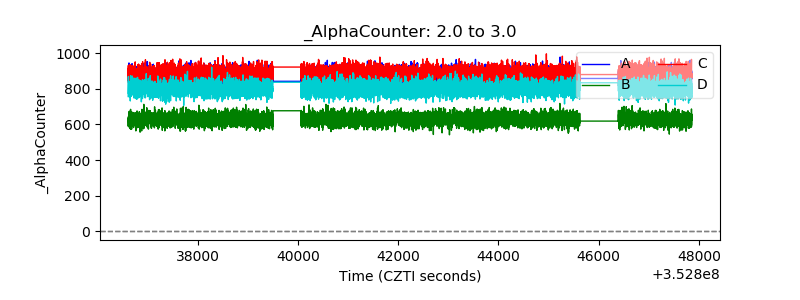 |
| _CPM_Rate | 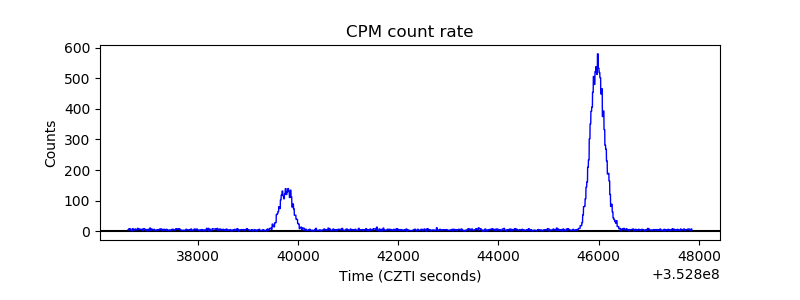 |
| CZT Counter | 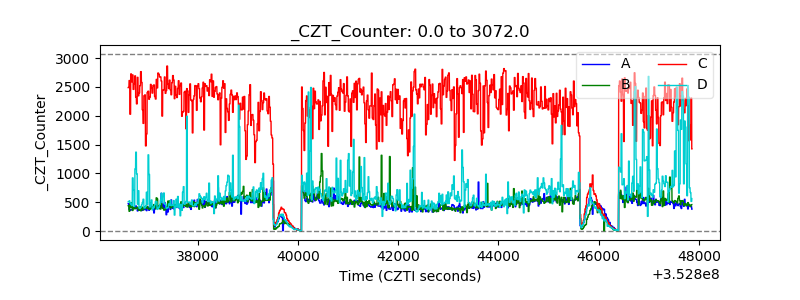 |
| +2.5 Volts monitor |  |
| +5 Volts monitor |  |
| _ROLL_ROT | 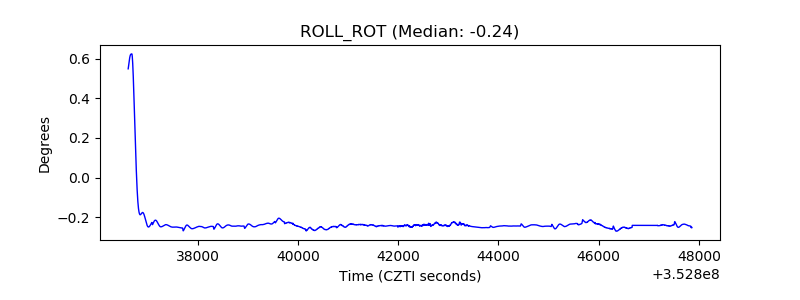 |
| _Roll_DEC | 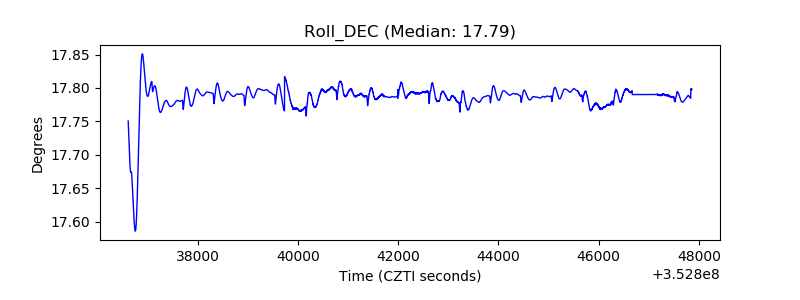 |
| _Roll_RA | 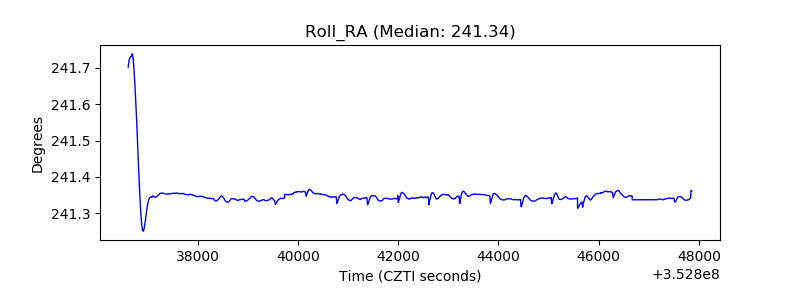 |
| Veto Counter | 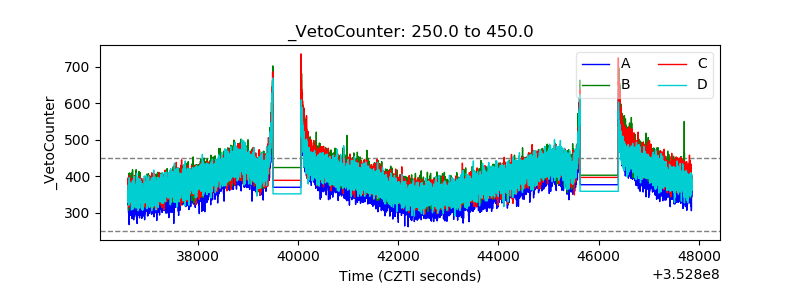 |