| Param | Original file | Final file |
|---|---|---|
| Filename | modeM0/AS1A10_102T05_9000004232_29423cztM0_level2.evt | modeM0/AS1A10_102T05_9000004232_29423cztM0_level2_quad_clean.evt |
| Size (bytes) | 702,930,240 | 99,777,600 |
| Size | 670.4 MB | 95.2 MB |
| Events in quadrant A | 3,103,788 | 658,649 |
| Events in quadrant B | 3,289,274 | 681,542 |
| Events in quadrant C | 9,256,218 | 604,534 |
| Events in quadrant D | 5,201,569 | 624,605 |
| Mode M9 | |||
|---|---|---|---|
| Quadrant | BADHDUFLAG | Total packets | Discarded packets |
| A | 0 | 13 | 0 |
| B | 0 | 14 | 0 |
| C | 0 | 14 | 0 |
| D | 0 | 14 | 0 |
| Mode SS | |||
|---|---|---|---|
| Quadrant | BADHDUFLAG | Total packets | Discarded packets |
| A | 0 | 130 | 0 |
| B | 0 | 130 | 0 |
| C | 0 | 130 | 0 |
| D | 0 | 130 | 0 |
| Mode M0 | |||
|---|---|---|---|
| Quadrant | BADHDUFLAG | Total packets | Discarded packets |
| A | 0 | 13424 | 2 |
| B | 0 | 13900 | 2 |
| C | 0 | 32045 | 3 |
| D | 0 | 19925 | 2 |
| Quadrant | Total seconds | Saturated seconds | Saturation percentage |
|---|---|---|---|
| A | 6486 | 16 | 0.246685% |
| B | 6486 | 39 | 0.601295% |
| C | 6485 | 1490 | 22.976099% |
| D | 6485 | 315 | 4.857363% |
Noise dominated data is calculated using 1-second bins in cleaned event files. If a bin has >2000 counts, and if more than 50% of those come from <1% of pixels, then it is considered to be noise-dominated and hence unusable.
| Quadrant | # 1 sec bins | Bins with >0 counts | Bins with >2000 counts | High rate bins dominated by noise | Noise dominated (total time) | Noise dominated (detector-on time) | Marked lightcurve |
|---|---|---|---|---|---|---|---|
| A | 7571 | 6487 | 0 | 0 | 0.00% | 0.00% | 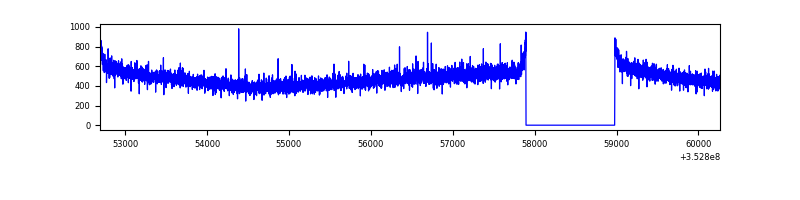 |
| B | 7571 | 6487 | 4 | 4 | 0.05% | 0.06% | 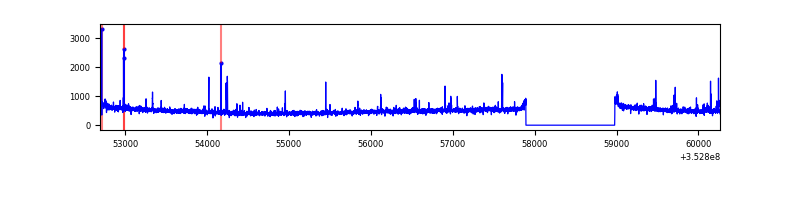 |
| C | 7570 | 6486 | 705 | 705 | 9.31% | 10.87% | 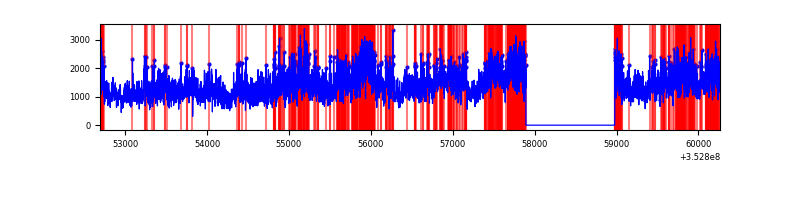 |
| D | 7570 | 6486 | 211 | 211 | 2.79% | 3.25% | 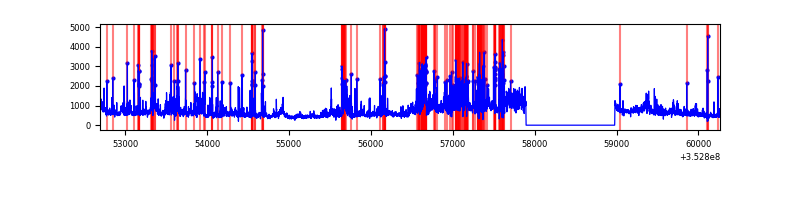 |
Top three noisy pixels from each quadrant. If the there are fewer than three noisy pixels in the level2.evt file, extra rows are filled as -1
| Pixel properties | Quadrant properties | ||||||
|---|---|---|---|---|---|---|---|
| Quadrant | DetID | PixID | Counts | Sigma | Mean | Median | Sigma |
| A | 13 | 254 | 11680 | 67.44 | 804 | 790 | 161.5 |
| A | 3 | 137 | 7856 | 43.76 | 804 | 790 | 161.5 |
| A | 0 | 226 | 6725 | 36.76 | 804 | 790 | 161.5 |
| B | 10 | 245 | 61130 | 390.46 | 806 | 787 | 154.5 |
| B | 12 | 111 | 19028 | 118.03 | 806 | 787 | 154.5 |
| B | 5 | 255 | 18143 | 112.3 | 806 | 787 | 154.5 |
| C | 3 | 233 | 6209992 | 36135.0 | 736 | 741 | 171.8 |
| C | 14 | 238 | 135238 | 782.71 | 736 | 741 | 171.8 |
| C | 14 | 254 | 25388 | 143.43 | 736 | 741 | 171.8 |
| D | 1 | 52 | 842862 | 4604.08 | 765 | 744 | 182.9 |
| D | 8 | 195 | 527232 | 2878.45 | 765 | 744 | 182.9 |
| D | 7 | 80 | 392202 | 2140.2 | 765 | 744 | 182.9 |
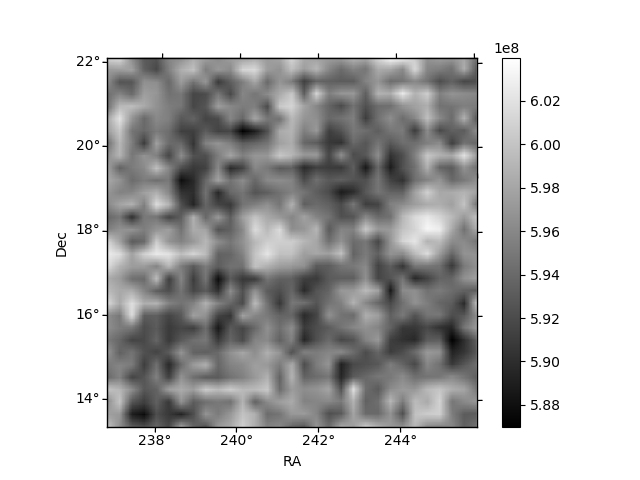
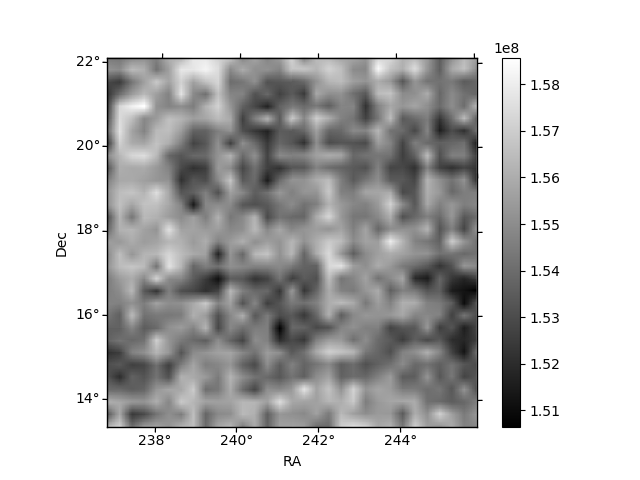
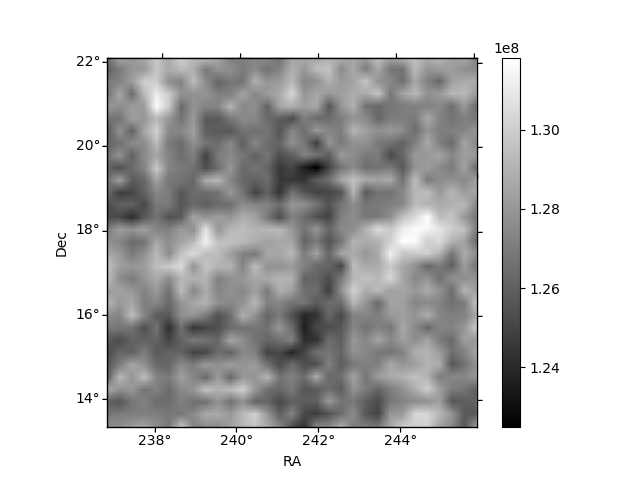
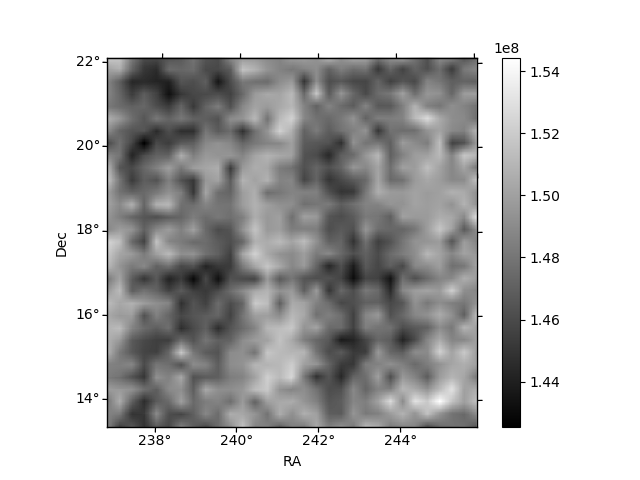
Histogram calculated using DETX and DETY for each event in the final _common_clean file
| Quadrant A | 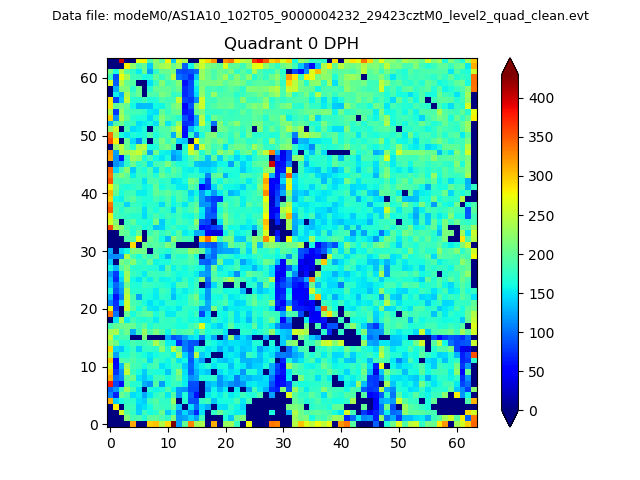 |
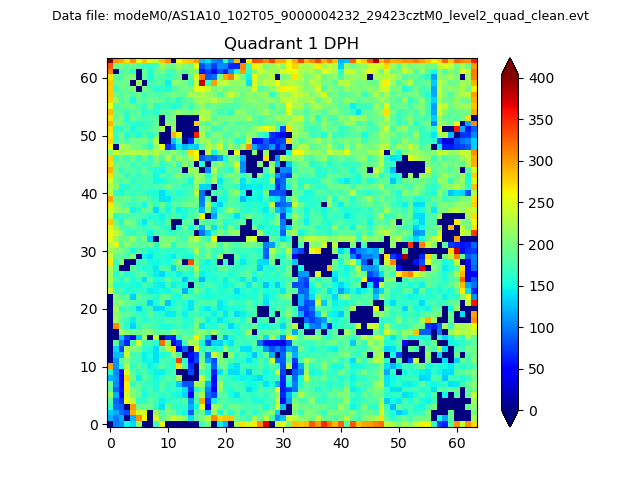 |
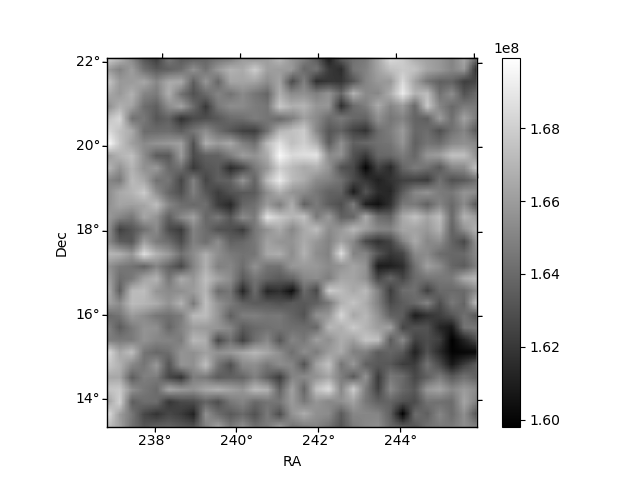
Quadrant B |
|---|---|---|---|
| Quadrant D | 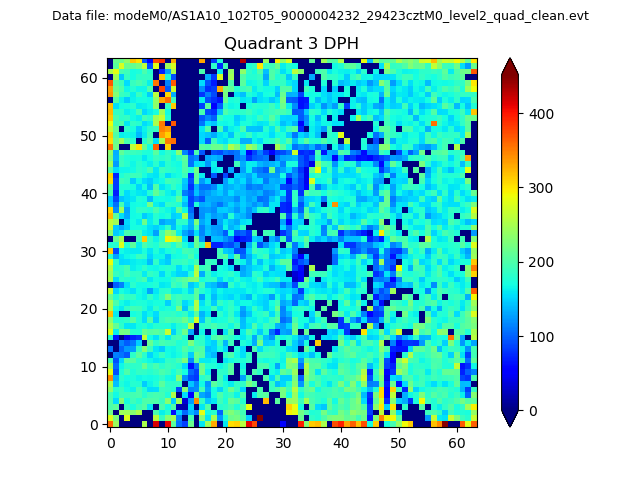 |
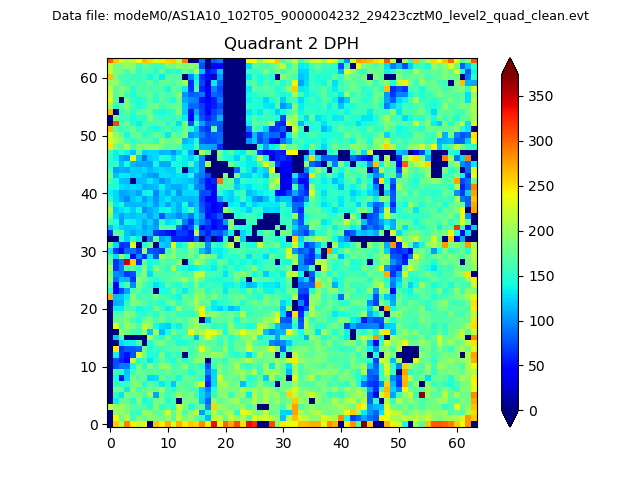 |
Quadrant C |
| Plot type | Count rate plots | Images |
|---|---|---|
| Comparison with Poisson distribution Blue bars denote a histogram of data divided into 1 sec bins. Red curve is a Poisson curve with rate = median count rate of data. |
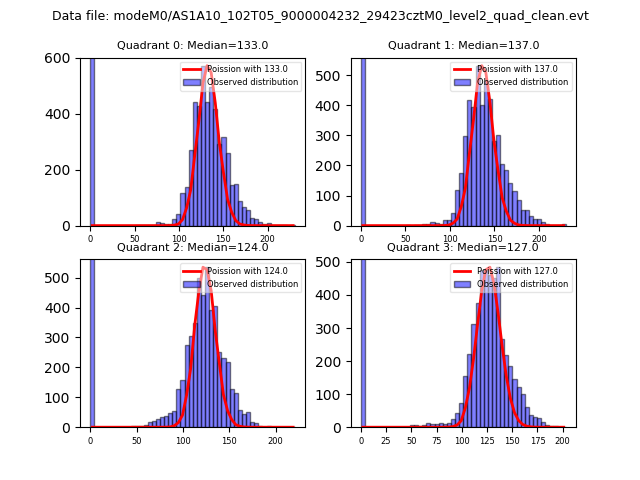 |
 |
| Quadrant-wise count rates Data is divided into 100 sec bins |
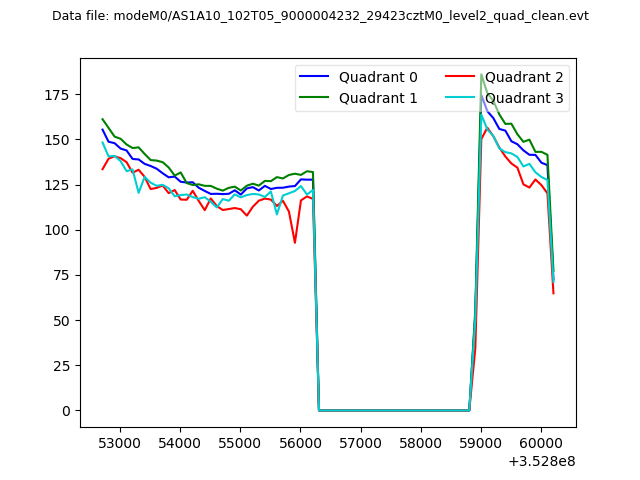 |
|
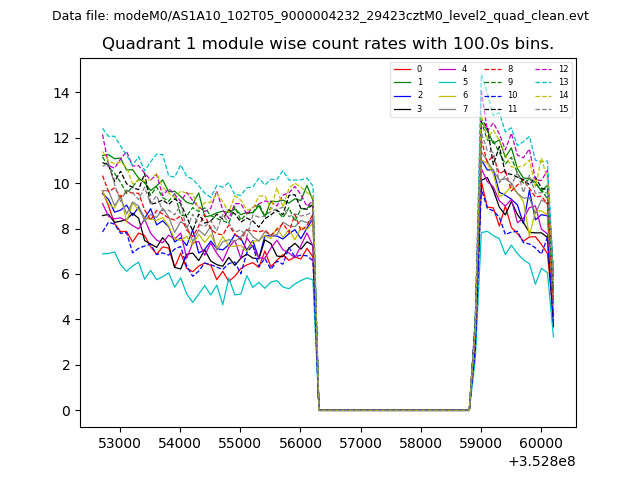
| Module-wise count rates for Quadrant A Data is divided into 100 sec bins |
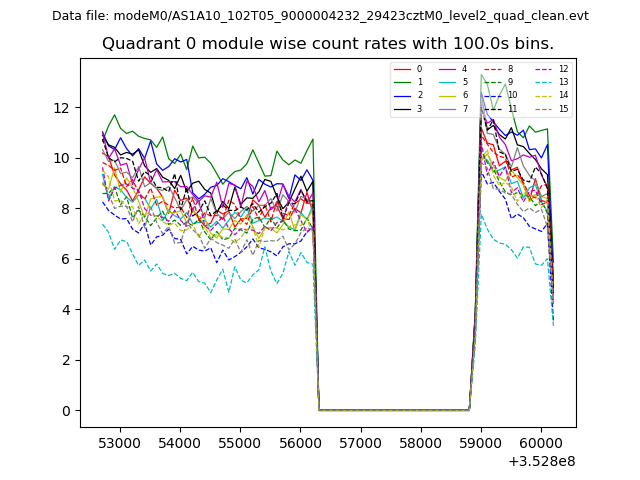 |
 |
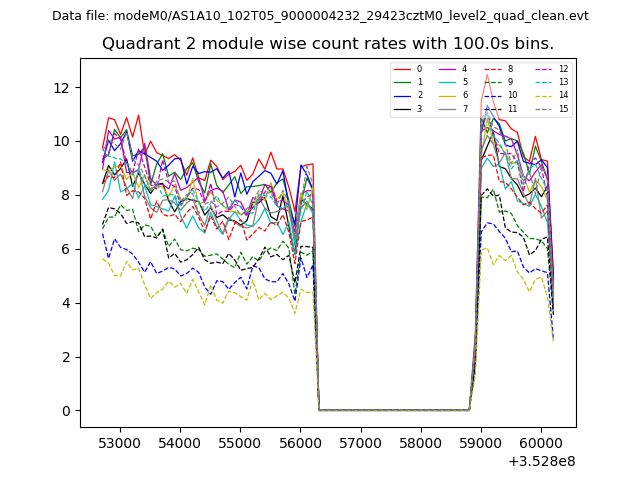
| Module-wise count rates for Quadrant B Data is divided into 100 sec bins |
 |
 |
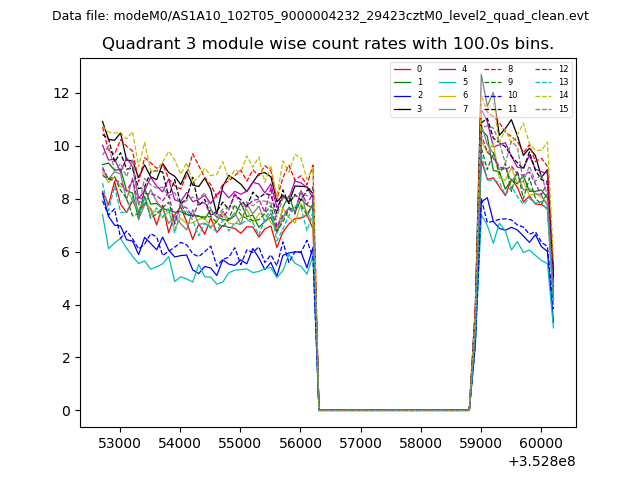
| Module-wise count rates for Quadrant C Data is divided into 100 sec bins |
 |
 |
| Module-wise count rates for Quadrant D Data is divided into 100 sec bins |
 |
 |
| Parameter | Plot |
|---|---|
| CZT HV Monitor | 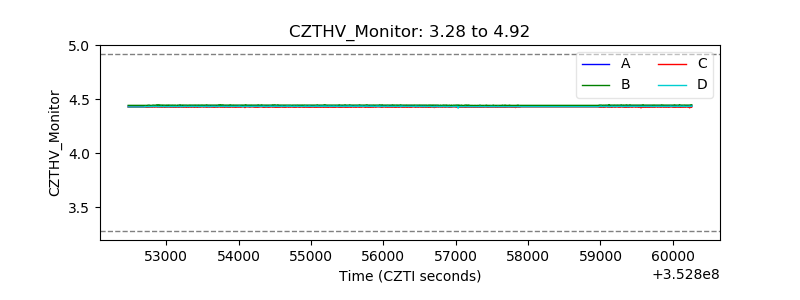 |
| D_VDD | 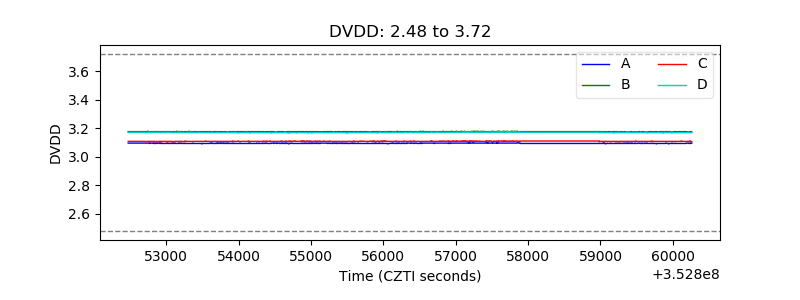 |
| Temperature 1 | 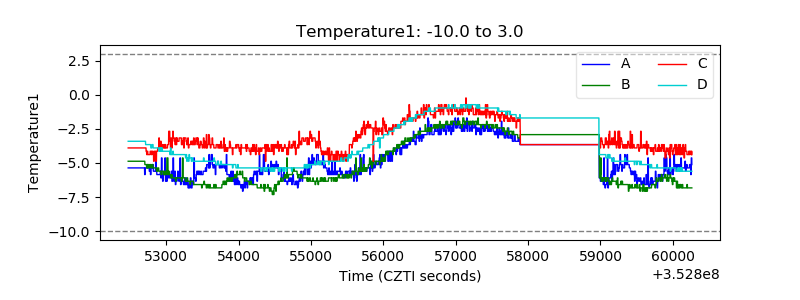 |
| Veto HV Monitor | 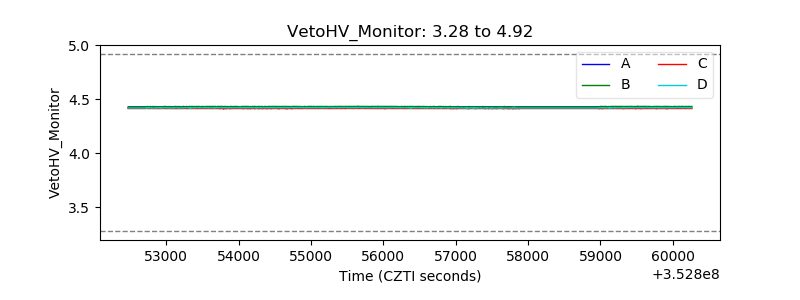 |
| Veto LLD | 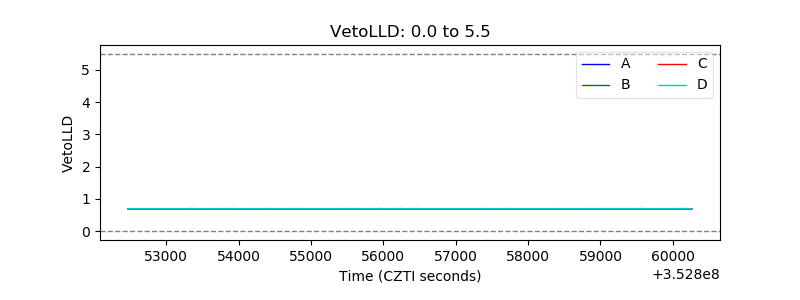 |
| Alpha Counter | 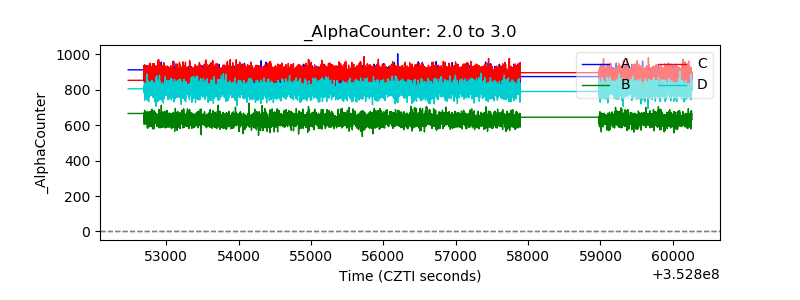 |
| _CPM_Rate | 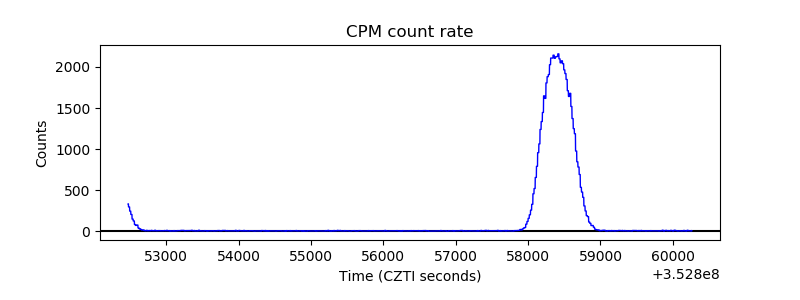 |
| CZT Counter | 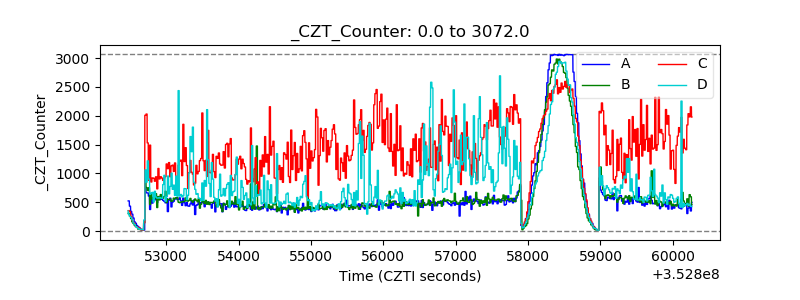 |
| +2.5 Volts monitor |  |
| +5 Volts monitor |  |
| _ROLL_ROT | 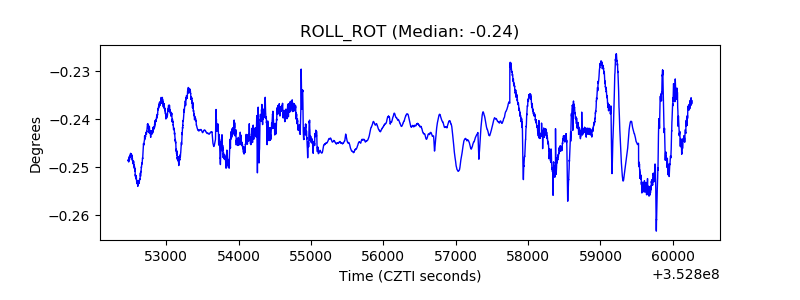 |
| _Roll_DEC |  |
| _Roll_RA | 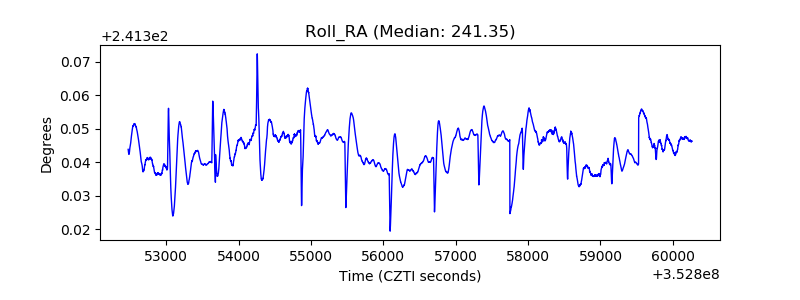 |
| Veto Counter | 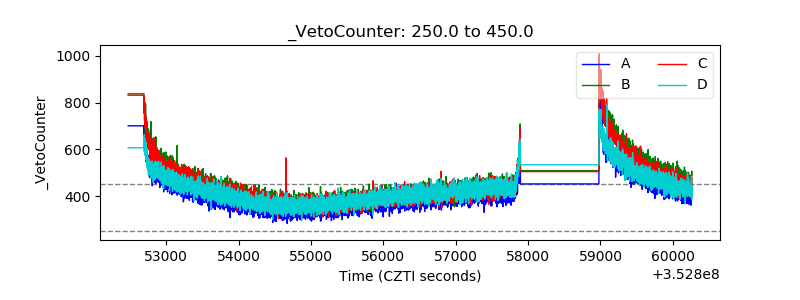 |