| Param | Original file | Final file |
|---|---|---|
| Filename | modeM0/AS1A10_102T05_9000004232_29425cztM0_level2.evt | modeM0/AS1A10_102T05_9000004232_29425cztM0_level2_quad_clean.evt |
| Size (bytes) | 846,622,080 | 102,620,160 |
| Size | 807.4 MB | 97.9 MB |
| Events in quadrant A | 3,275,962 | 696,061 |
| Events in quadrant B | 3,580,644 | 721,863 |
| Events in quadrant C | 12,795,958 | 570,631 |
| Events in quadrant D | 5,536,124 | 652,188 |
| Mode M9 | |||
|---|---|---|---|
| Quadrant | BADHDUFLAG | Total packets | Discarded packets |
| A | 0 | 14 | 0 |
| B | 0 | 15 | 0 |
| C | 0 | 15 | 0 |
| D | 0 | 15 | 0 |
| Mode SS | |||
|---|---|---|---|
| Quadrant | BADHDUFLAG | Total packets | Discarded packets |
| A | 0 | 134 | 0 |
| B | 0 | 134 | 0 |
| C | 0 | 134 | 0 |
| D | 0 | 134 | 0 |
| Mode M0 | |||
|---|---|---|---|
| Quadrant | BADHDUFLAG | Total packets | Discarded packets |
| A | 0 | 13951 | 2 |
| B | 0 | 14875 | 2 |
| C | 0 | 42606 | 2 |
| D | 0 | 20993 | 2 |
| Quadrant | Total seconds | Saturated seconds | Saturation percentage |
|---|---|---|---|
| A | 6693 | 18 | 0.268938% |
| B | 6693 | 89 | 1.329747% |
| C | 6693 | 3817 | 57.029733% |
| D | 6693 | 558 | 8.337069% |
Noise dominated data is calculated using 1-second bins in cleaned event files. If a bin has >2000 counts, and if more than 50% of those come from <1% of pixels, then it is considered to be noise-dominated and hence unusable.
| Quadrant | # 1 sec bins | Bins with >0 counts | Bins with >2000 counts | High rate bins dominated by noise | Noise dominated (total time) | Noise dominated (detector-on time) | Marked lightcurve |
|---|---|---|---|---|---|---|---|
| A | 7888 | 6694 | 0 | 0 | 0.00% | 0.00% | 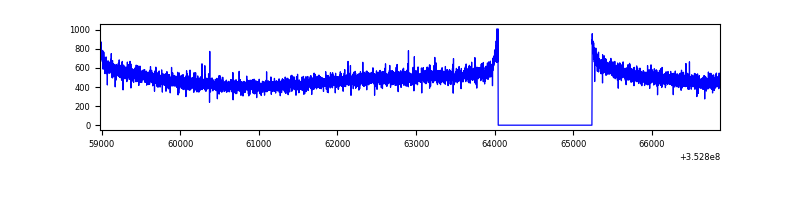 |
| B | 7888 | 6694 | 25 | 25 | 0.32% | 0.37% | 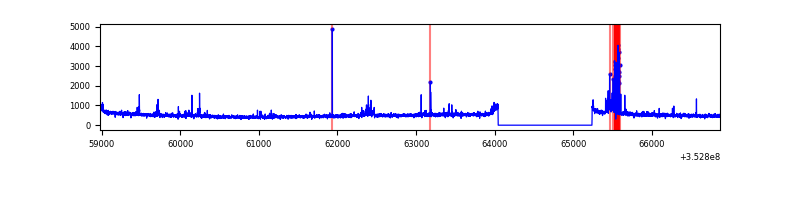 |
| C | 7888 | 6693 | 2770 | 2770 | 35.12% | 41.39% | 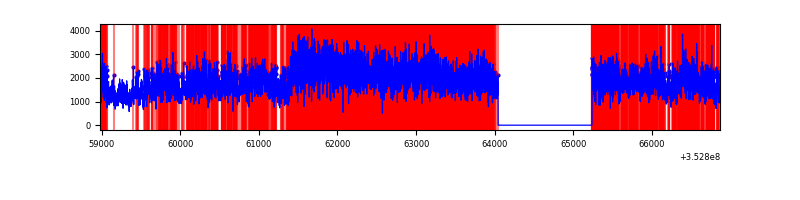 |
| D | 7888 | 6694 | 345 | 345 | 4.37% | 5.15% |  |
Top three noisy pixels from each quadrant. If the there are fewer than three noisy pixels in the level2.evt file, extra rows are filled as -1
| Pixel properties | Quadrant properties | ||||||
|---|---|---|---|---|---|---|---|
| Quadrant | DetID | PixID | Counts | Sigma | Mean | Median | Sigma |
| A | 13 | 254 | 11653 | 63.88 | 849 | 833 | 169.4 |
| A | 3 | 137 | 7841 | 41.37 | 849 | 833 | 169.4 |
| A | 0 | 226 | 7164 | 37.38 | 849 | 833 | 169.4 |
| B | 10 | 245 | 184415 | 1147.08 | 848 | 826 | 160.0 |
| B | 0 | 190 | 19521 | 116.81 | 848 | 826 | 160.0 |
| B | 12 | 111 | 19485 | 116.58 | 848 | 826 | 160.0 |
| C | 3 | 233 | 9984148 | 62606.84 | 690 | 695 | 159.5 |
| C | 14 | 238 | 107951 | 672.61 | 690 | 695 | 159.5 |
| C | 2 | 114 | 13321 | 79.18 | 690 | 695 | 159.5 |
| D | 1 | 52 | 1476927 | 7904.55 | 786 | 767 | 186.7 |
| D | 8 | 195 | 653877 | 3497.28 | 786 | 767 | 186.7 |
| D | 2 | 120 | 148117 | 789.03 | 786 | 767 | 186.7 |
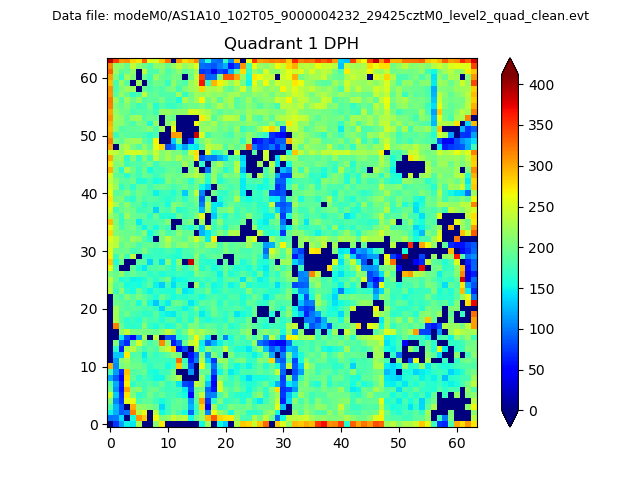
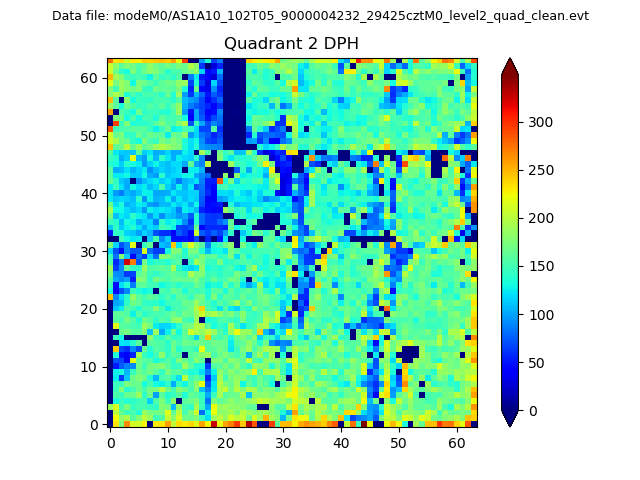
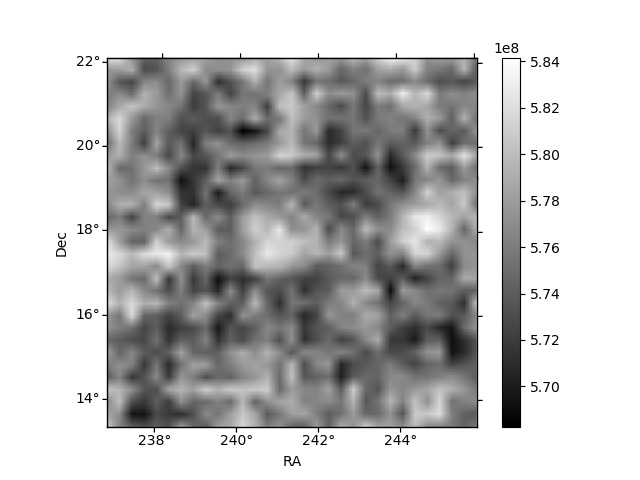
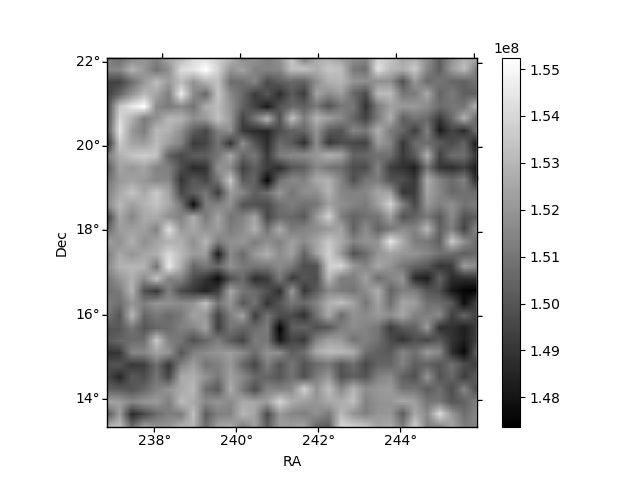
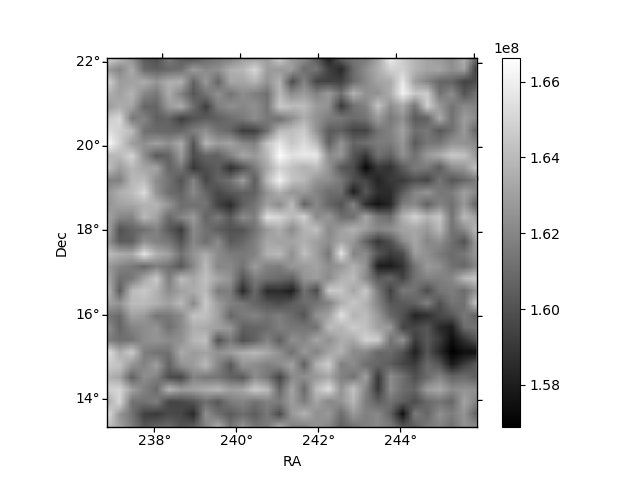
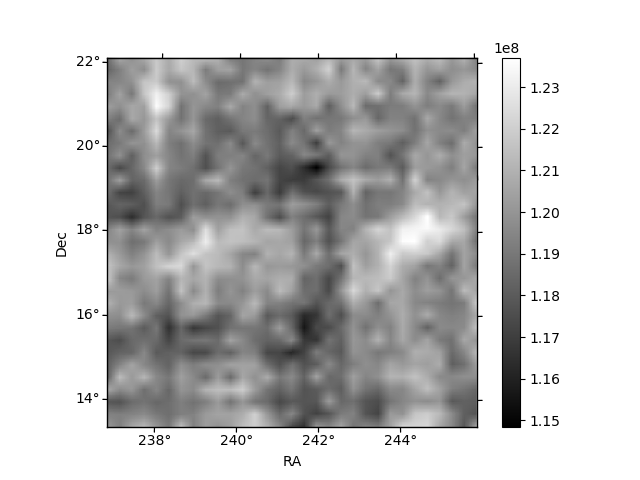
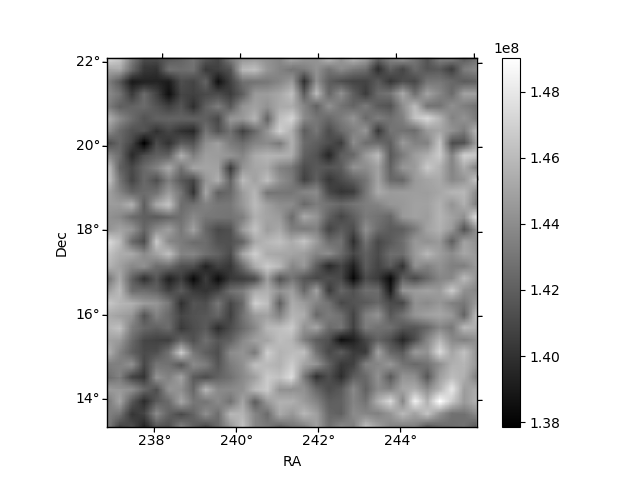
Histogram calculated using DETX and DETY for each event in the final _common_clean file
| Quadrant A | 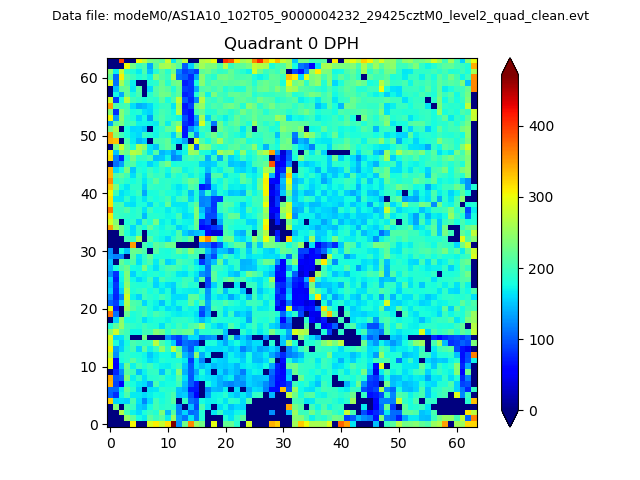 |
 |
Quadrant B |
|---|---|---|---|
| Quadrant D | 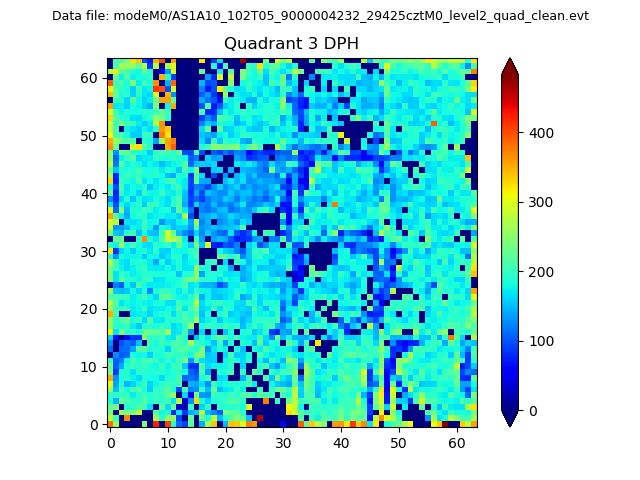 |
 |
Quadrant C |
| Plot type | Count rate plots | Images |
|---|---|---|
| Comparison with Poisson distribution Blue bars denote a histogram of data divided into 1 sec bins. Red curve is a Poisson curve with rate = median count rate of data. |
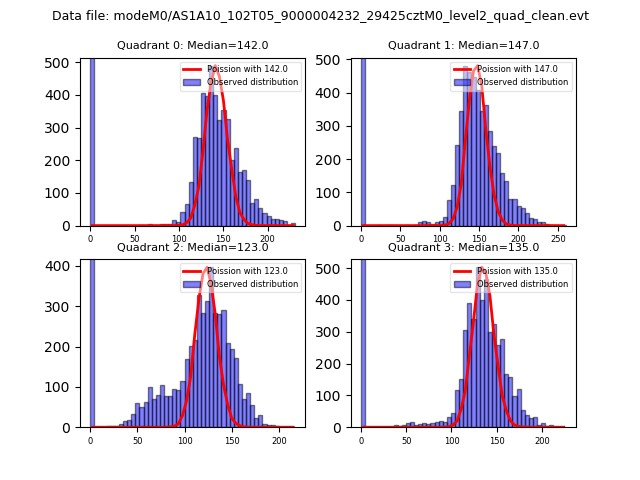 |
 |
| Quadrant-wise count rates Data is divided into 100 sec bins |
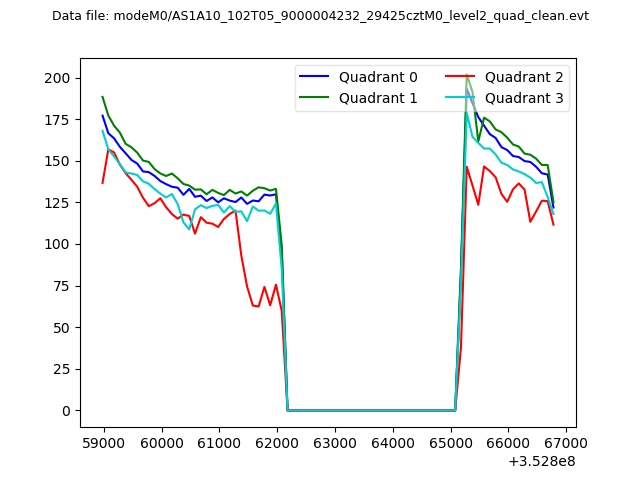 |
|
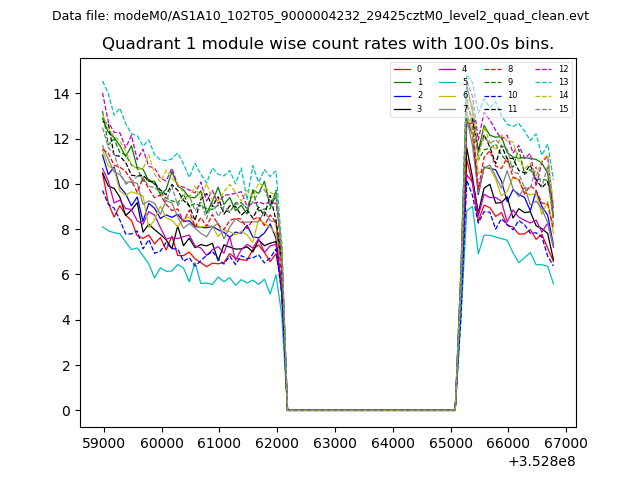
| Module-wise count rates for Quadrant A Data is divided into 100 sec bins |
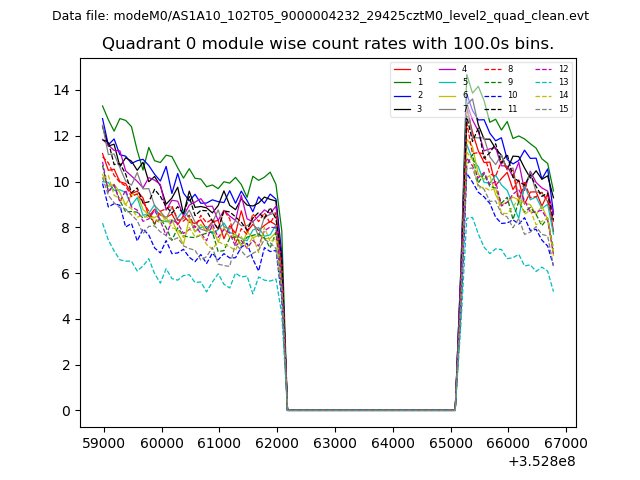 |
 |
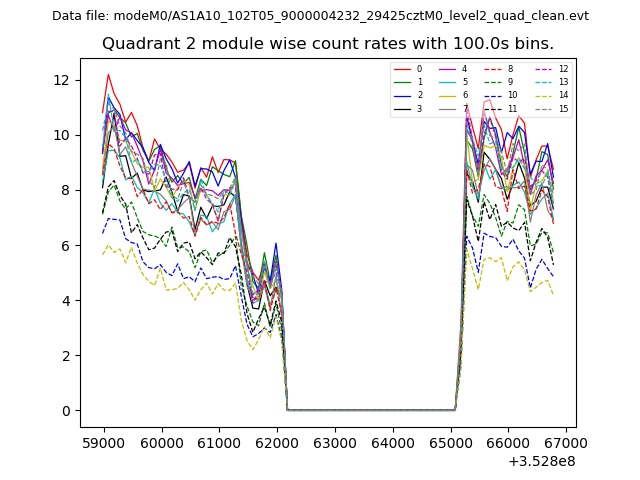
| Module-wise count rates for Quadrant B Data is divided into 100 sec bins |
 |
 |
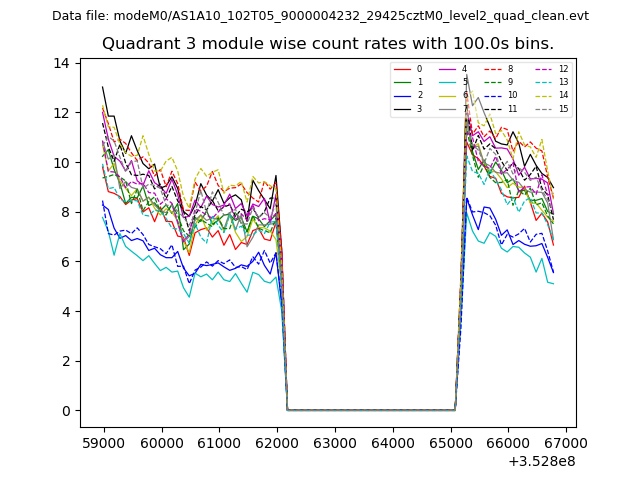
| Module-wise count rates for Quadrant C Data is divided into 100 sec bins |
 |
 |
| Module-wise count rates for Quadrant D Data is divided into 100 sec bins |
 |
 |
| Parameter | Plot |
|---|---|
| CZT HV Monitor | 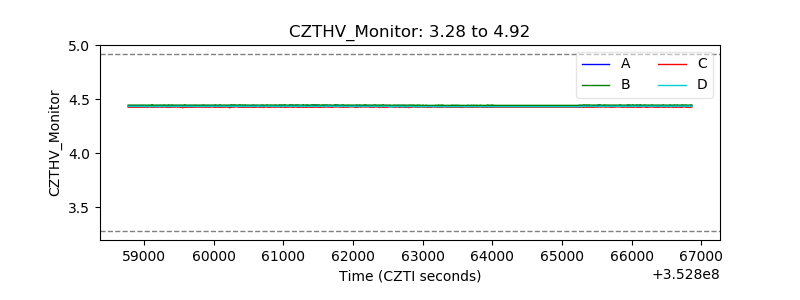 |
| D_VDD | 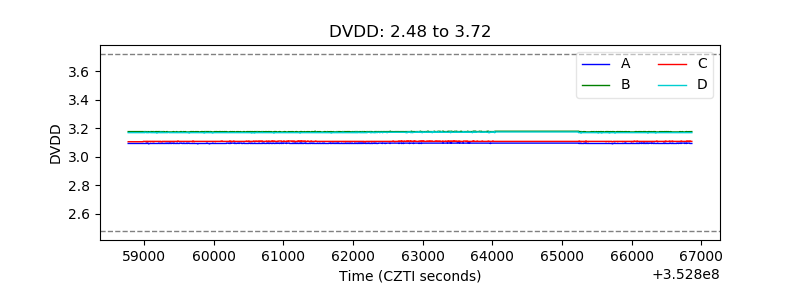 |
| Temperature 1 | 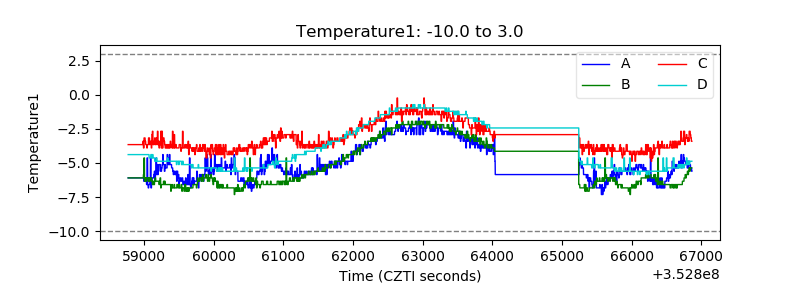 |
| Veto HV Monitor | 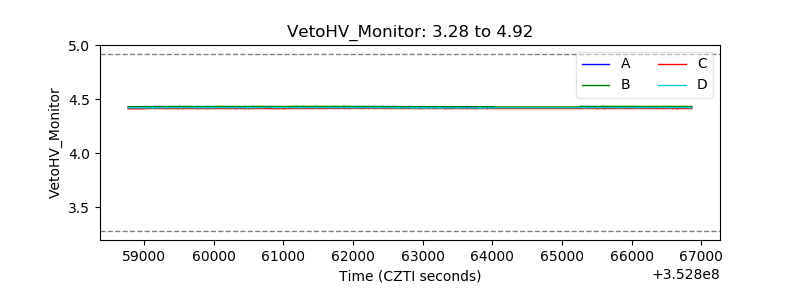 |
| Veto LLD | 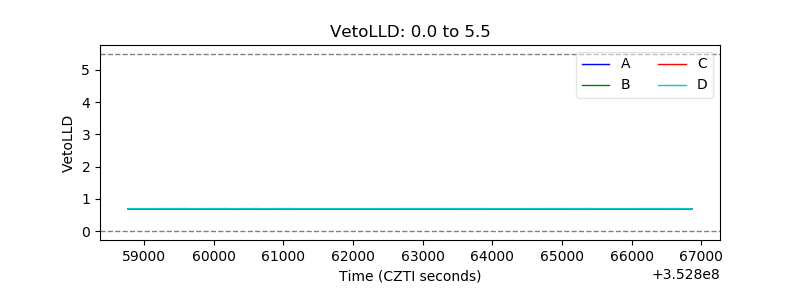 |
| Alpha Counter | 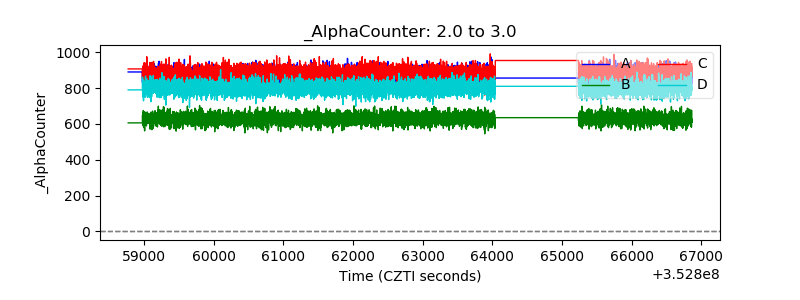 |
| _CPM_Rate | 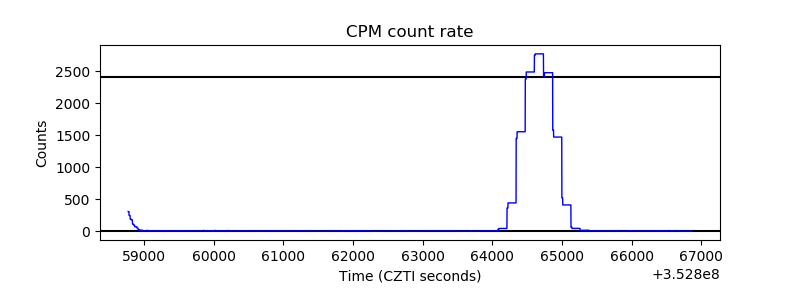 |
| CZT Counter | 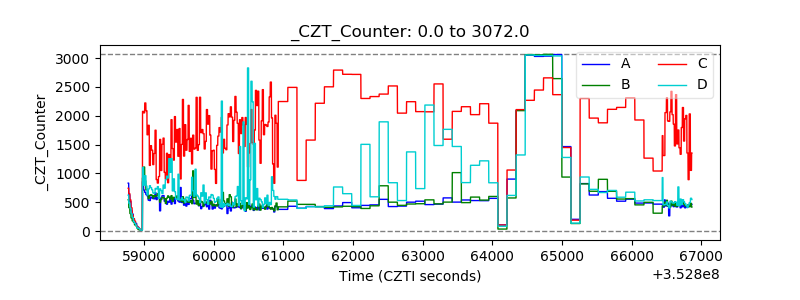 |
| +2.5 Volts monitor | 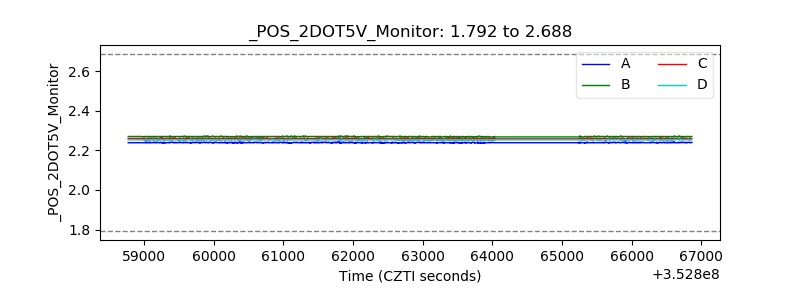 |
| +5 Volts monitor |  |
| _ROLL_ROT | 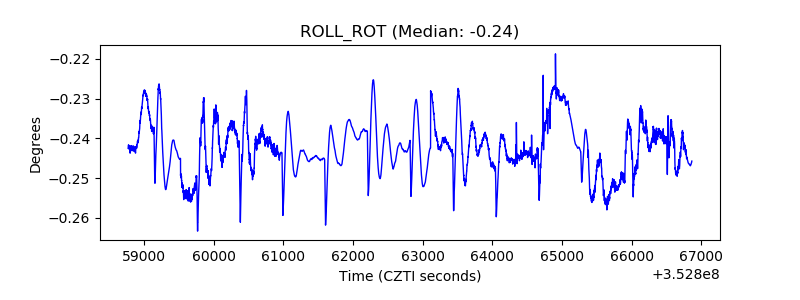 |
| _Roll_DEC |  |
| _Roll_RA | 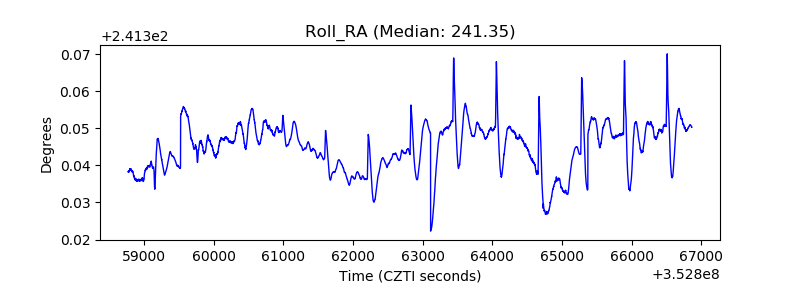 |
| Veto Counter | 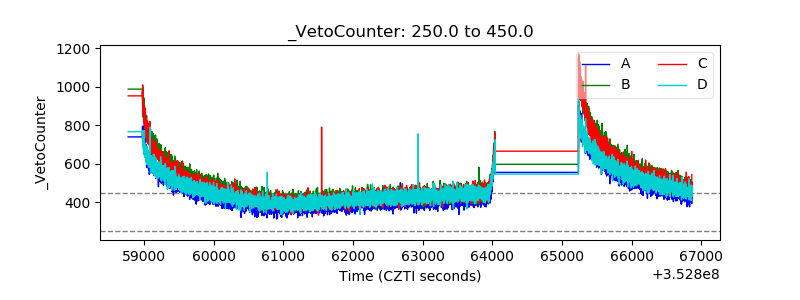 |