| Param | Original file | Final file |
|---|---|---|
| Filename | modeM0/AS1A10_102T05_9000004232_29427cztM0_level2.evt | modeM0/AS1A10_102T05_9000004232_29427cztM0_level2_quad_clean.evt |
| Size (bytes) | 826,459,200 | 99,043,200 |
| Size | 788.2 MB | 94.5 MB |
| Events in quadrant A | 3,333,986 | 674,825 |
| Events in quadrant B | 3,517,307 | 694,080 |
| Events in quadrant C | 9,968,249 | 592,236 |
| Events in quadrant D | 7,782,420 | 594,020 |
| Mode M9 | |||
|---|---|---|---|
| Quadrant | BADHDUFLAG | Total packets | Discarded packets |
| A | 0 | 13 | 0 |
| B | 0 | 13 | 0 |
| C | 0 | 13 | 0 |
| D | 0 | 13 | 0 |
| Mode SS | |||
|---|---|---|---|
| Quadrant | BADHDUFLAG | Total packets | Discarded packets |
| A | 0 | 130 | 0 |
| B | 0 | 130 | 0 |
| C | 0 | 130 | 0 |
| D | 0 | 130 | 0 |
| Mode M0 | |||
|---|---|---|---|
| Quadrant | BADHDUFLAG | Total packets | Discarded packets |
| A | 0 | 13438 | 1 |
| B | 0 | 14204 | 2 |
| C | 0 | 34058 | 1 |
| D | 0 | 27540 | 1 |
| Quadrant | Total seconds | Saturated seconds | Saturation percentage |
|---|---|---|---|
| A | 6354 | 29 | 0.456405% |
| B | 6354 | 60 | 0.944287% |
| C | 6354 | 1736 | 27.321372% |
| D | 6354 | 991 | 15.596475% |
Noise dominated data is calculated using 1-second bins in cleaned event files. If a bin has >2000 counts, and if more than 50% of those come from <1% of pixels, then it is considered to be noise-dominated and hence unusable.
| Quadrant | # 1 sec bins | Bins with >0 counts | Bins with >2000 counts | High rate bins dominated by noise | Noise dominated (total time) | Noise dominated (detector-on time) | Marked lightcurve |
|---|---|---|---|---|---|---|---|
| A | 7679 | 6355 | 0 | 0 | 0.00% | 0.00% | 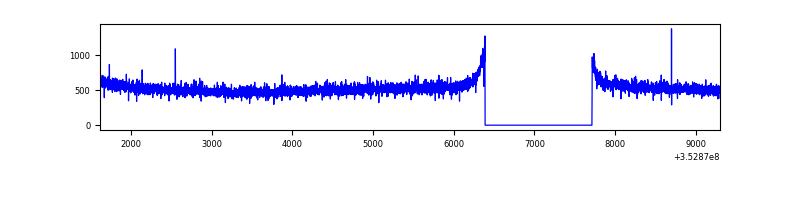 |
| B | 7679 | 6355 | 3 | 3 | 0.04% | 0.05% | 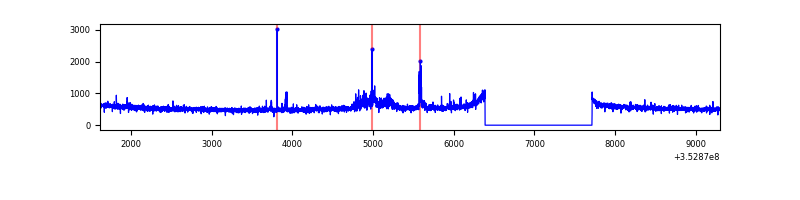 |
| C | 7679 | 6355 | 1092 | 1092 | 14.22% | 17.18% | 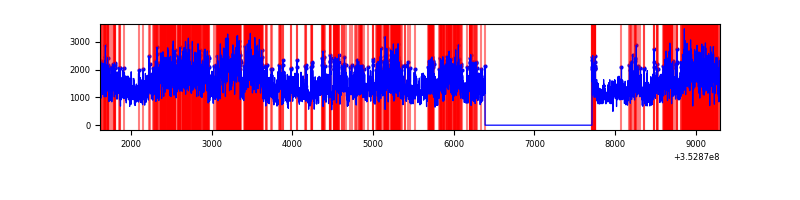 |
| D | 7679 | 6355 | 911 | 911 | 11.86% | 14.34% | 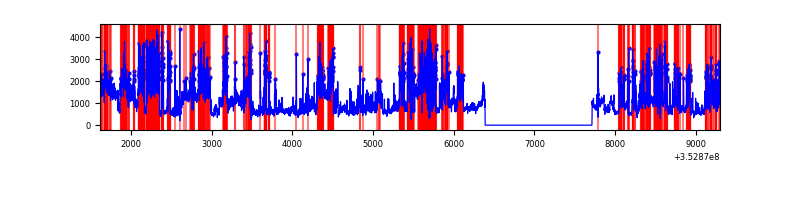 |
Top three noisy pixels from each quadrant. If the there are fewer than three noisy pixels in the level2.evt file, extra rows are filled as -1
| Pixel properties | Quadrant properties | ||||||
|---|---|---|---|---|---|---|---|
| Quadrant | DetID | PixID | Counts | Sigma | Mean | Median | Sigma |
| A | 13 | 254 | 11098 | 60.24 | 864 | 852 | 170.1 |
| A | 3 | 137 | 7543 | 39.34 | 864 | 852 | 170.1 |
| A | 0 | 226 | 7333 | 38.1 | 864 | 852 | 170.1 |
| B | 15 | 33 | 86013 | 533.35 | 857 | 837 | 159.7 |
| B | 12 | 111 | 18999 | 113.73 | 857 | 837 | 159.7 |
| B | 0 | 229 | 18205 | 108.75 | 857 | 837 | 159.7 |
| C | 3 | 233 | 6795875 | 38290.4 | 777 | 784 | 177.5 |
| C | 14 | 238 | 127341 | 713.15 | 777 | 784 | 177.5 |
| C | 2 | 114 | 14119 | 75.14 | 777 | 784 | 177.5 |
| D | 1 | 52 | 4084836 | 22057.53 | 793 | 777 | 185.2 |
| D | 8 | 195 | 356850 | 1923.11 | 793 | 777 | 185.2 |
| D | 13 | 153 | 214079 | 1152.02 | 793 | 777 | 185.2 |
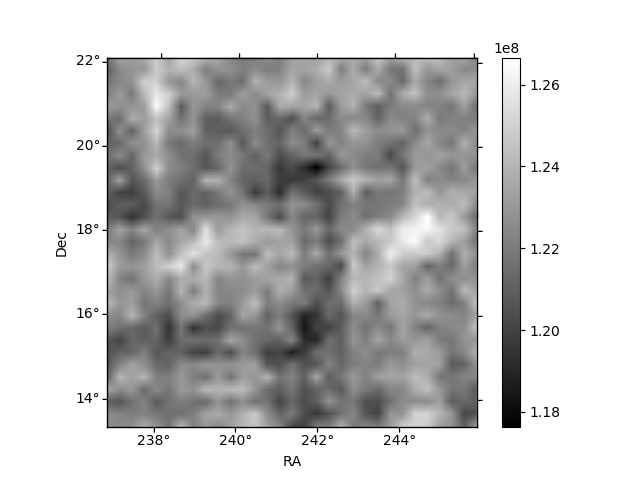
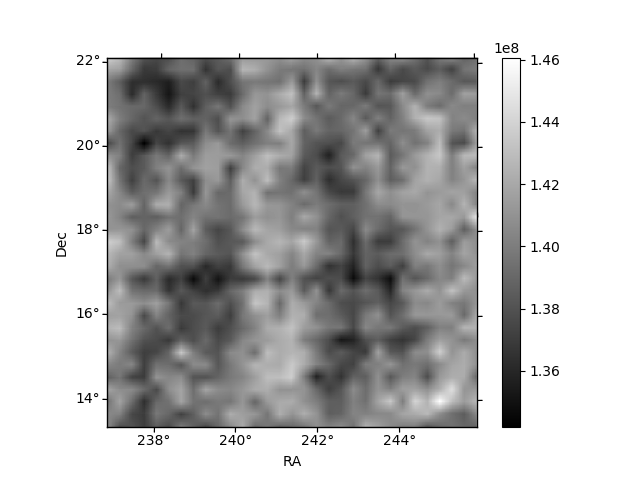
Histogram calculated using DETX and DETY for each event in the final _common_clean file
| Quadrant A |  |
 |
Quadrant B |
|---|---|---|---|
| Quadrant D |  |
 |
Quadrant C |
| Plot type | Count rate plots | Images |
|---|---|---|
| Comparison with Poisson distribution Blue bars denote a histogram of data divided into 1 sec bins. Red curve is a Poisson curve with rate = median count rate of data. |
 |
 |
| Quadrant-wise count rates Data is divided into 100 sec bins |
 |
|
| Module-wise count rates for Quadrant A Data is divided into 100 sec bins |
 |
 |
| Module-wise count rates for Quadrant B Data is divided into 100 sec bins |
 |
 |
| Module-wise count rates for Quadrant C Data is divided into 100 sec bins |
 |
 |
| Module-wise count rates for Quadrant D Data is divided into 100 sec bins |
 |
 |
| Parameter | Plot |
|---|---|
| CZT HV Monitor |  |
| D_VDD | 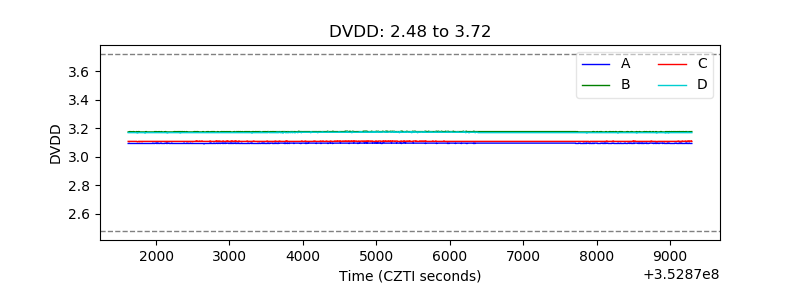 |
| Temperature 1 |  |
| Veto HV Monitor |  |
| Veto LLD |  |
| Alpha Counter |  |
| _CPM_Rate |  |
| CZT Counter |  |
| +2.5 Volts monitor |  |
| +5 Volts monitor |  |
| _ROLL_ROT |  |
| _Roll_DEC |  |
| _Roll_RA |  |
| Veto Counter |  |