| Param | Original file | Final file |
|---|---|---|
| Filename | modeM0/AS1A10_102T05_9000004232_29428cztM0_level2.evt | modeM0/AS1A10_102T05_9000004232_29428cztM0_level2_quad_clean.evt |
| Size (bytes) | 705,006,720 | 80,052,480 |
| Size | 672.3 MB | 76.3 MB |
| Events in quadrant A | 2,959,306 | 534,056 |
| Events in quadrant B | 3,026,302 | 543,809 |
| Events in quadrant C | 9,114,195 | 466,119 |
| Events in quadrant D | 5,873,413 | 487,503 |
| Mode M9 | |||
|---|---|---|---|
| Quadrant | BADHDUFLAG | Total packets | Discarded packets |
| A | 0 | 13 | 0 |
| B | 0 | 13 | 0 |
| C | 0 | 13 | 0 |
| D | 0 | 13 | 0 |
| Mode SS | |||
|---|---|---|---|
| Quadrant | BADHDUFLAG | Total packets | Discarded packets |
| A | 0 | 114 | 0 |
| B | 0 | 114 | 0 |
| C | 0 | 114 | 0 |
| D | 0 | 114 | 0 |
| Mode M0 | |||
|---|---|---|---|
| Quadrant | BADHDUFLAG | Total packets | Discarded packets |
| A | 0 | 11813 | 2 |
| B | 0 | 12064 | 2 |
| C | 0 | 30992 | 2 |
| D | 0 | 21494 | 2 |
| Quadrant | Total seconds | Saturated seconds | Saturation percentage |
|---|---|---|---|
| A | 5605 | 71 | 1.266726% |
| B | 5606 | 88 | 1.569747% |
| C | 5606 | 1983 | 35.372815% |
| D | 5606 | 501 | 8.936853% |
Noise dominated data is calculated using 1-second bins in cleaned event files. If a bin has >2000 counts, and if more than 50% of those come from <1% of pixels, then it is considered to be noise-dominated and hence unusable.
| Quadrant | # 1 sec bins | Bins with >0 counts | Bins with >2000 counts | High rate bins dominated by noise | Noise dominated (total time) | Noise dominated (detector-on time) | Marked lightcurve |
|---|---|---|---|---|---|---|---|
| A | 6910 | 5607 | 0 | 0 | 0.00% | 0.00% | 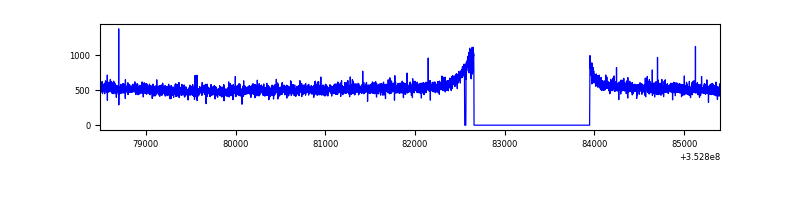 |
| B | 6911 | 5608 | 2 | 2 | 0.03% | 0.04% | 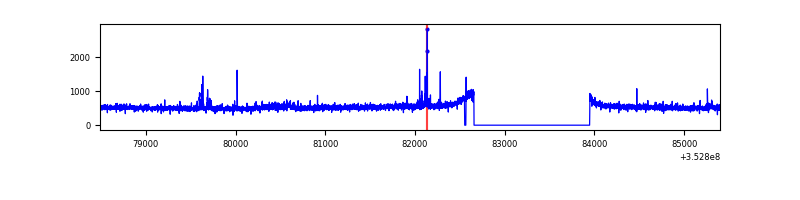 |
| C | 6911 | 5608 | 1218 | 1218 | 17.62% | 21.72% | 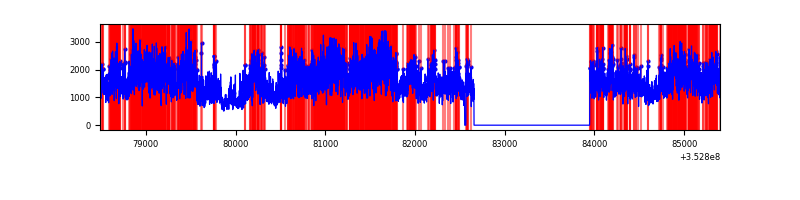 |
| D | 6911 | 5608 | 431 | 431 | 6.24% | 7.69% | 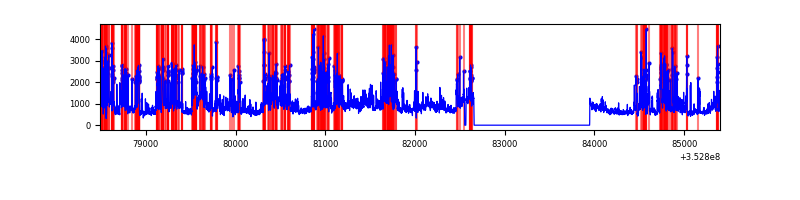 |
Top three noisy pixels from each quadrant. If the there are fewer than three noisy pixels in the level2.evt file, extra rows are filled as -1
| Pixel properties | Quadrant properties | ||||||
|---|---|---|---|---|---|---|---|
| Quadrant | DetID | PixID | Counts | Sigma | Mean | Median | Sigma |
| A | 13 | 254 | 10130 | 60.93 | 767 | 753 | 153.9 |
| A | 3 | 137 | 6901 | 39.95 | 767 | 753 | 153.9 |
| A | 0 | 226 | 6692 | 38.59 | 767 | 753 | 153.9 |
| B | 10 | 245 | 25984 | 179.92 | 751 | 736 | 140.3 |
| B | 0 | 190 | 22554 | 155.48 | 751 | 736 | 140.3 |
| B | 15 | 33 | 19438 | 133.27 | 751 | 736 | 140.3 |
| C | 3 | 233 | 6392893 | 41328.91 | 666 | 672 | 154.7 |
| C | 14 | 238 | 107140 | 688.37 | 666 | 672 | 154.7 |
| C | 2 | 114 | 12403 | 75.85 | 666 | 672 | 154.7 |
| D | 1 | 52 | 2272238 | 13361.78 | 718 | 701 | 170.0 |
| D | 8 | 195 | 561057 | 3296.16 | 718 | 701 | 170.0 |
| D | 13 | 104 | 122786 | 718.14 | 718 | 701 | 170.0 |
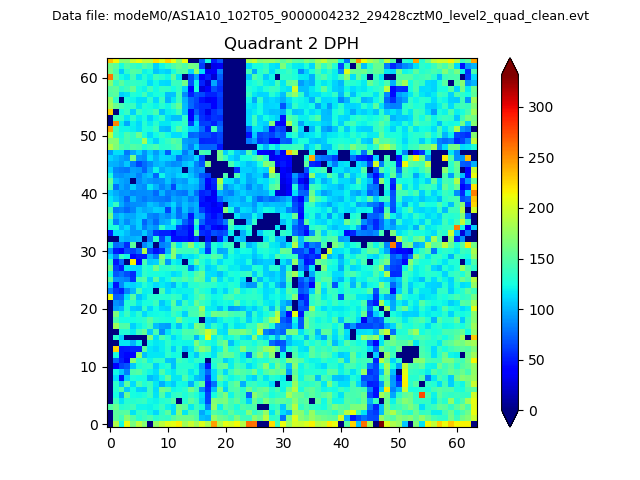
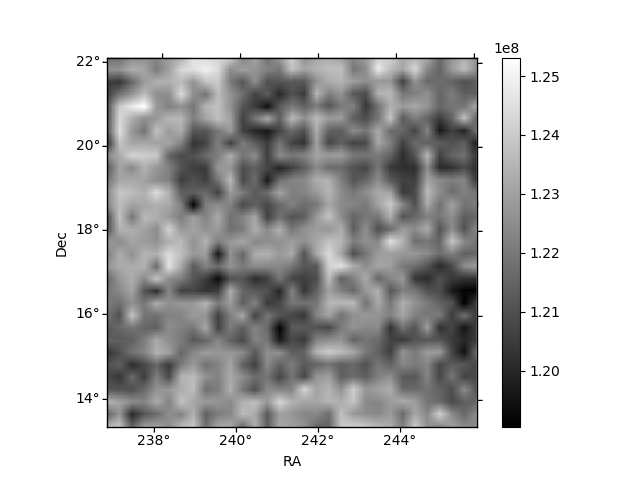
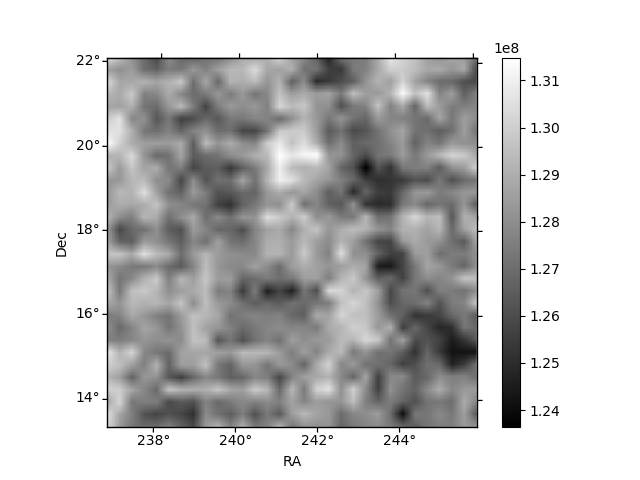
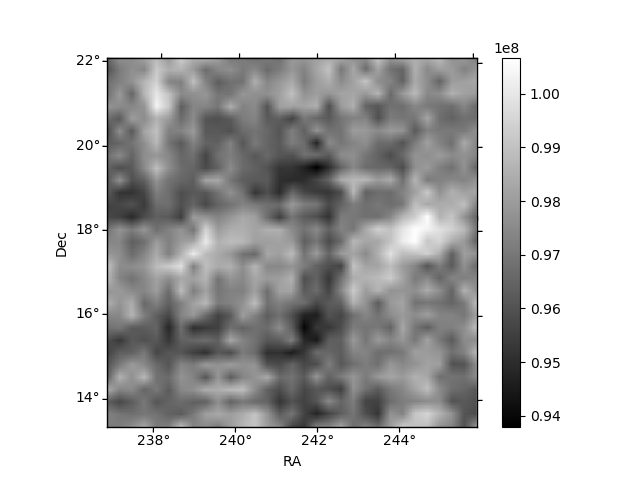
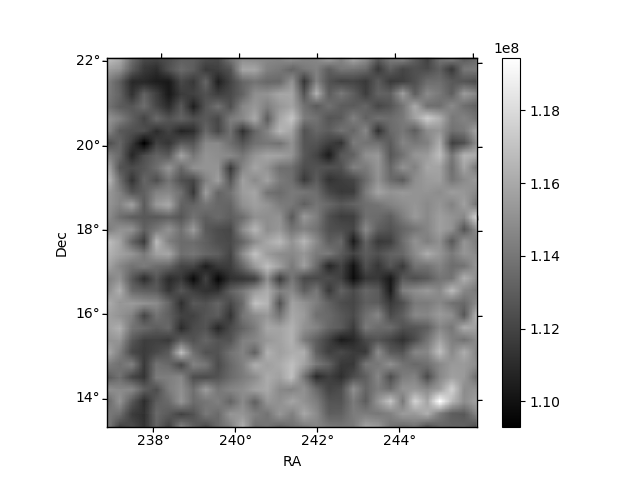
Histogram calculated using DETX and DETY for each event in the final _common_clean file
| Quadrant A | 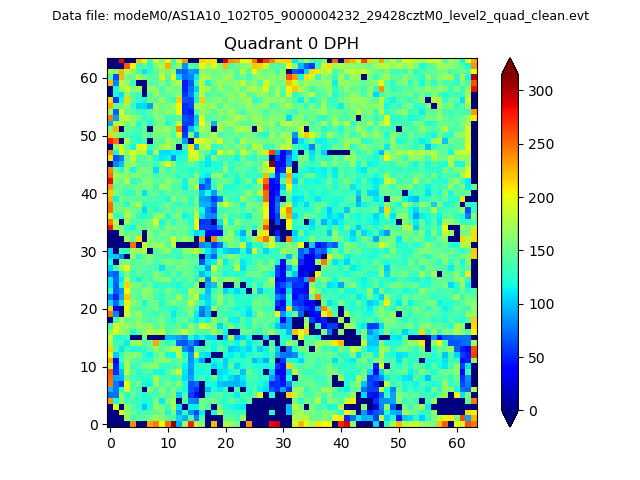 |
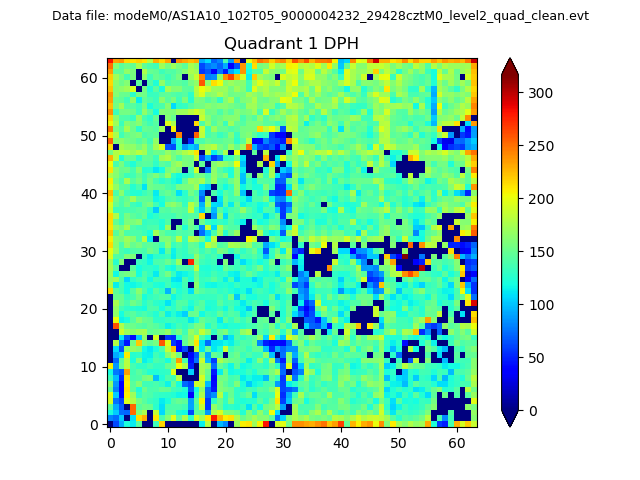 |
Quadrant B |
|---|---|---|---|
| Quadrant D | 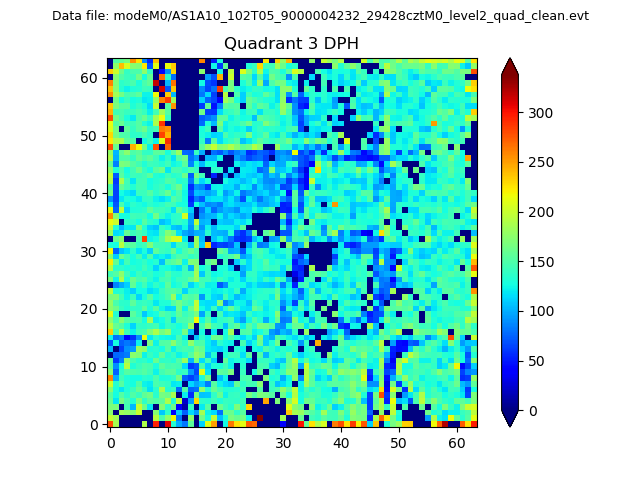 |
 |
Quadrant C |
| Plot type | Count rate plots | Images |
|---|---|---|
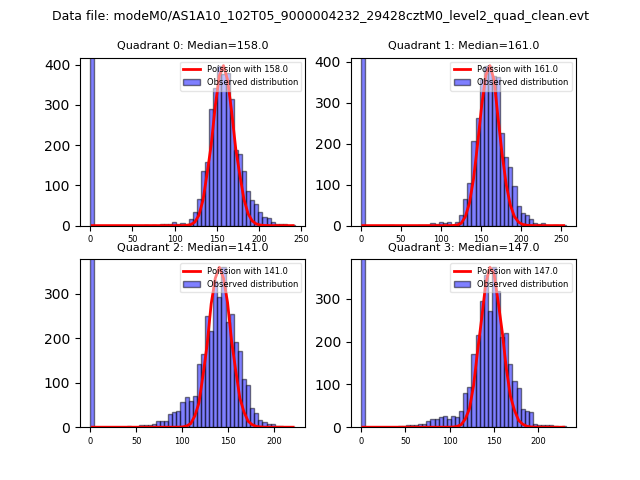
| Comparison with Poisson distribution Blue bars denote a histogram of data divided into 1 sec bins. Red curve is a Poisson curve with rate = median count rate of data. |
 |
 |
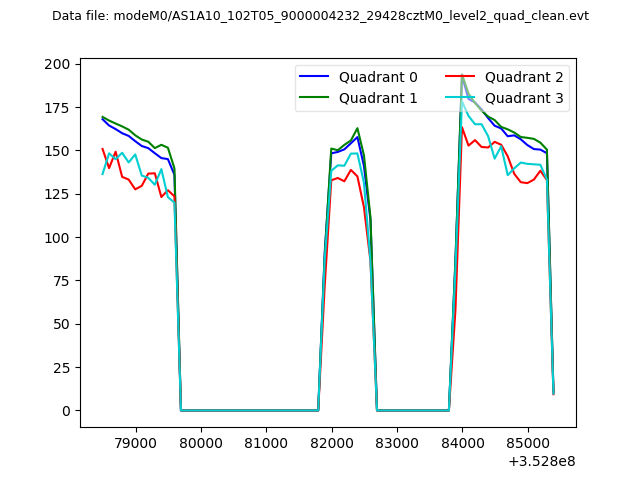
| Quadrant-wise count rates Data is divided into 100 sec bins |
 |
|
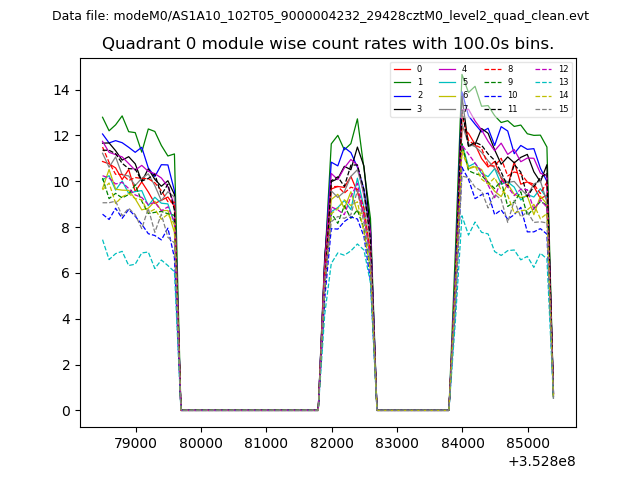
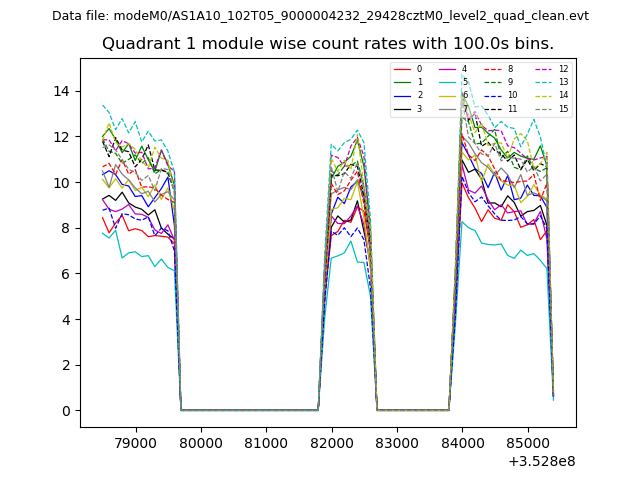
| Module-wise count rates for Quadrant A Data is divided into 100 sec bins |
 |
 |
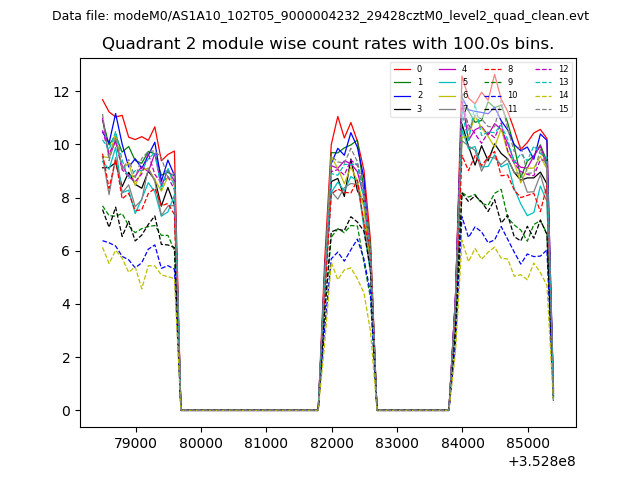
| Module-wise count rates for Quadrant B Data is divided into 100 sec bins |
 |
 |
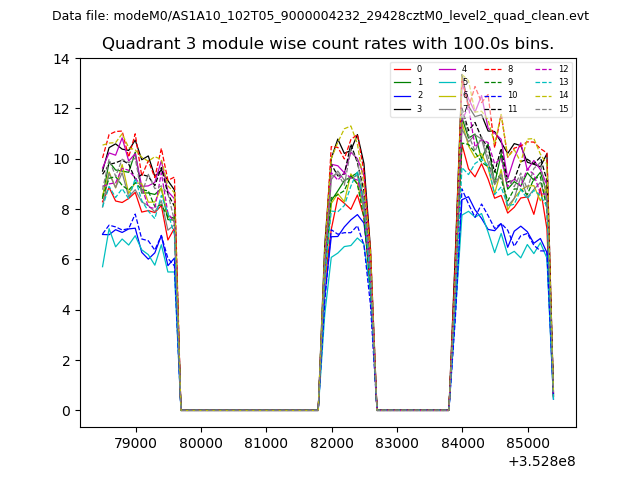
| Module-wise count rates for Quadrant C Data is divided into 100 sec bins |
 |
 |
| Module-wise count rates for Quadrant D Data is divided into 100 sec bins |
 |
 |
| Parameter | Plot |
|---|---|
| CZT HV Monitor | 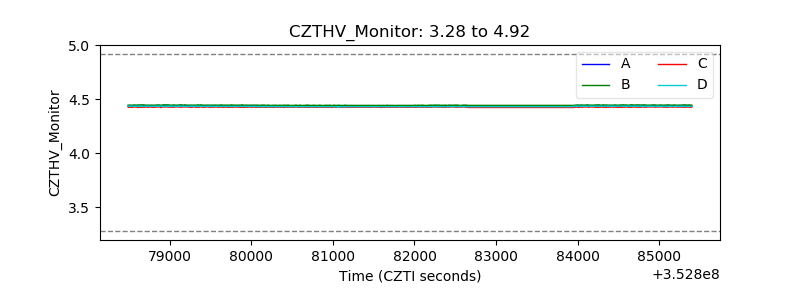 |
| D_VDD | 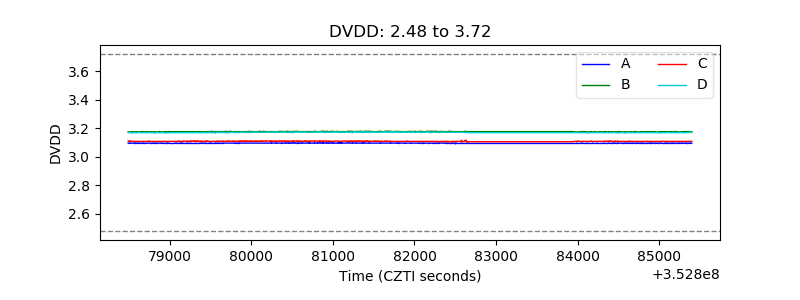 |
| Temperature 1 | 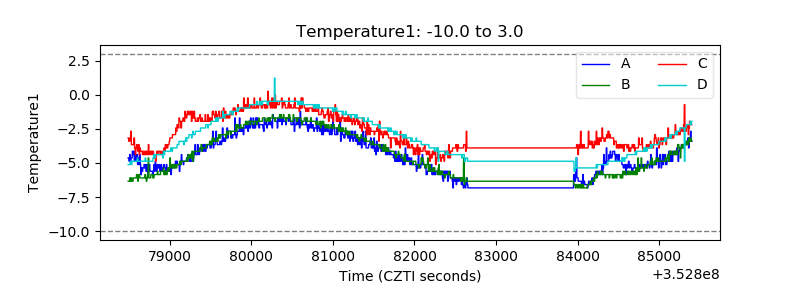 |
| Veto HV Monitor | 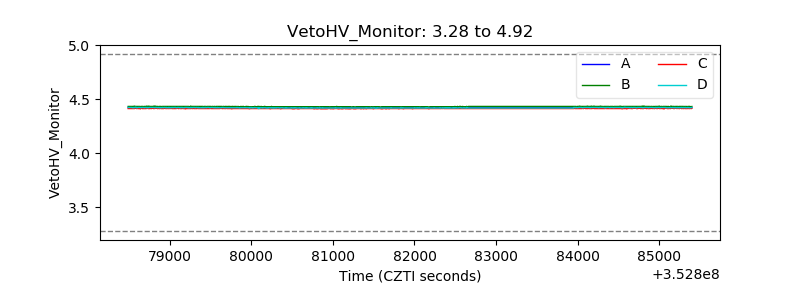 |
| Veto LLD | 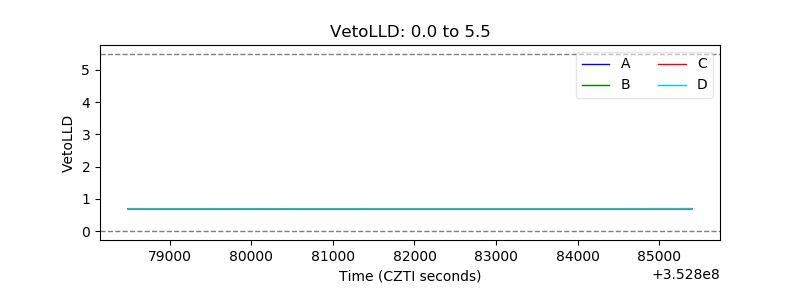 |
| Alpha Counter | 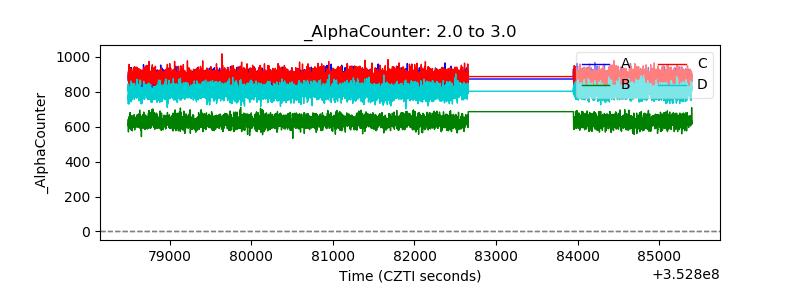 |
| _CPM_Rate | 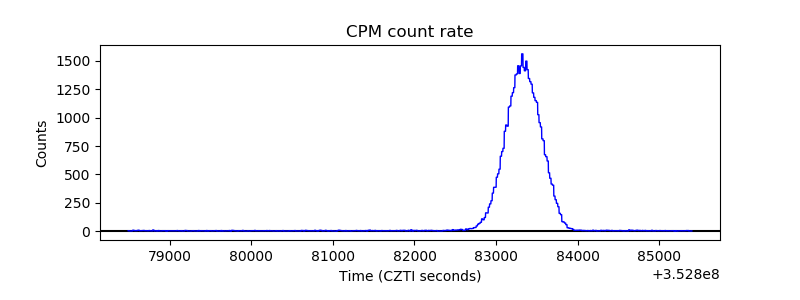 |
| CZT Counter | 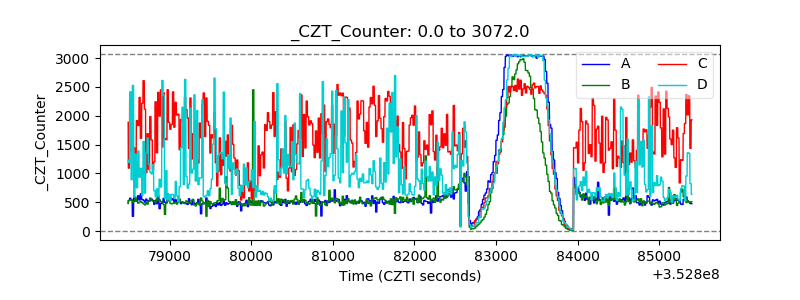 |
| +2.5 Volts monitor |  |
| +5 Volts monitor | 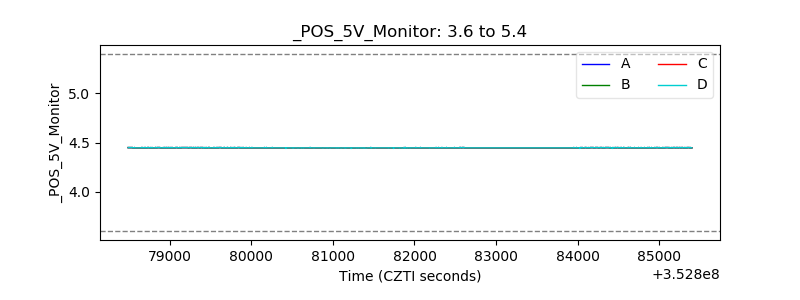 |
| _ROLL_ROT |  |
| _Roll_DEC | 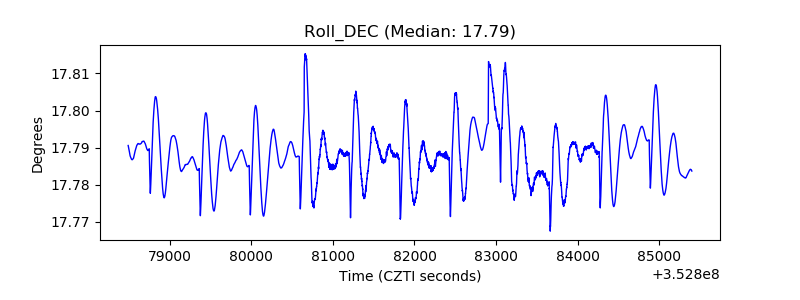 |
| _Roll_RA | 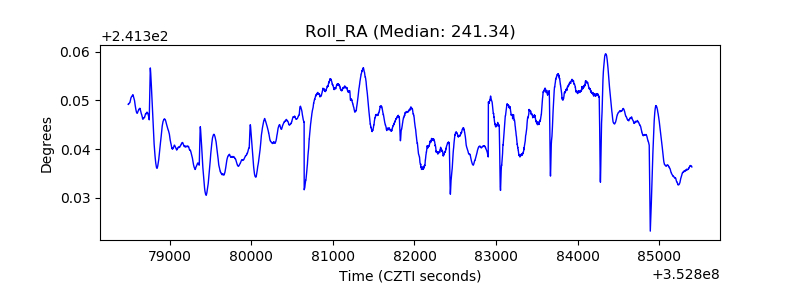 |
| Veto Counter | 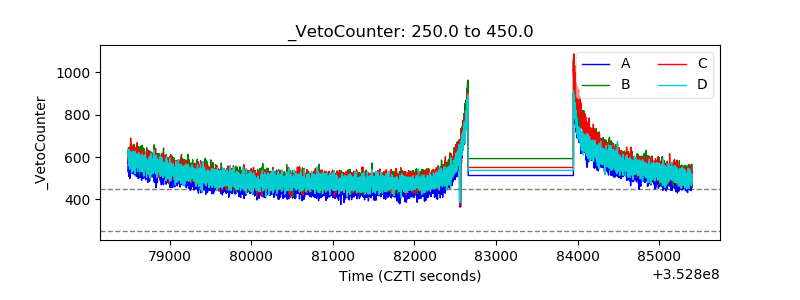 |