| Param | Original file | Final file |
|---|---|---|
| Filename | modeM0/AS1A10_102T05_9000004232_29429cztM0_level2.evt | modeM0/AS1A10_102T05_9000004232_29429cztM0_level2_quad_clean.evt |
| Size (bytes) | 750,905,280 | 82,033,920 |
| Size | 716.1 MB | 78.2 MB |
| Events in quadrant A | 3,125,038 | 546,613 |
| Events in quadrant B | 3,217,827 | 556,334 |
| Events in quadrant C | 10,232,288 | 447,790 |
| Events in quadrant D | 5,757,342 | 509,870 |
| Mode M9 | |||
|---|---|---|---|
| Quadrant | BADHDUFLAG | Total packets | Discarded packets |
| A | 0 | 12 | 0 |
| B | 0 | 12 | 0 |
| C | 0 | 12 | 0 |
| D | 0 | 12 | 0 |
| Mode SS | |||
|---|---|---|---|
| Quadrant | BADHDUFLAG | Total packets | Discarded packets |
| A | 0 | 124 | 0 |
| B | 0 | 124 | 0 |
| C | 0 | 124 | 0 |
| D | 0 | 124 | 0 |
| Mode M0 | |||
|---|---|---|---|
| Quadrant | BADHDUFLAG | Total packets | Discarded packets |
| A | 0 | 12568 | 1 |
| B | 0 | 12919 | 1 |
| C | 0 | 34682 | 1 |
| D | 0 | 21389 | 1 |
| Quadrant | Total seconds | Saturated seconds | Saturation percentage |
|---|---|---|---|
| A | 6050 | 65 | 1.074380% |
| B | 6050 | 85 | 1.404959% |
| C | 6050 | 3153 | 52.115702% |
| D | 6050 | 351 | 5.801653% |
Noise dominated data is calculated using 1-second bins in cleaned event files. If a bin has >2000 counts, and if more than 50% of those come from <1% of pixels, then it is considered to be noise-dominated and hence unusable.
| Quadrant | # 1 sec bins | Bins with >0 counts | Bins with >2000 counts | High rate bins dominated by noise | Noise dominated (total time) | Noise dominated (detector-on time) | Marked lightcurve |
|---|---|---|---|---|---|---|---|
| A | 7240 | 6051 | 0 | 0 | 0.00% | 0.00% | 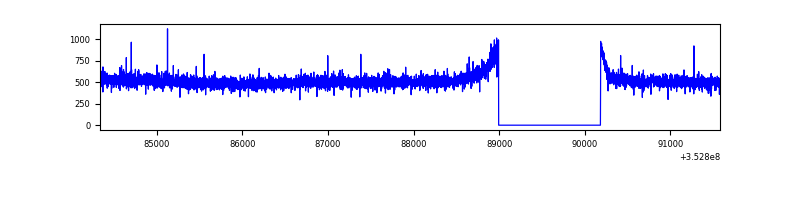 |
| B | 7240 | 6051 | 7 | 7 | 0.10% | 0.12% | 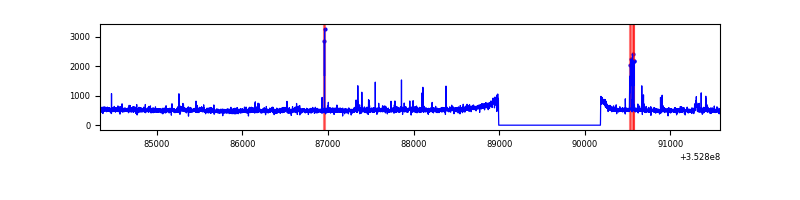 |
| C | 7240 | 6051 | 2200 | 2200 | 30.39% | 36.36% | 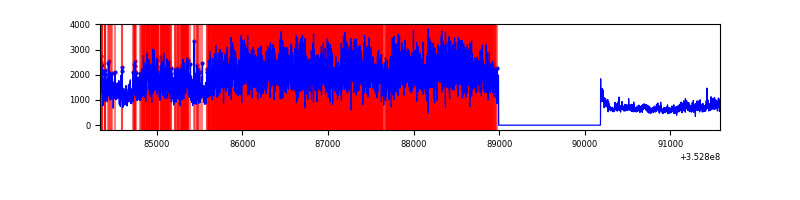 |
| D | 7240 | 6051 | 283 | 283 | 3.91% | 4.68% | 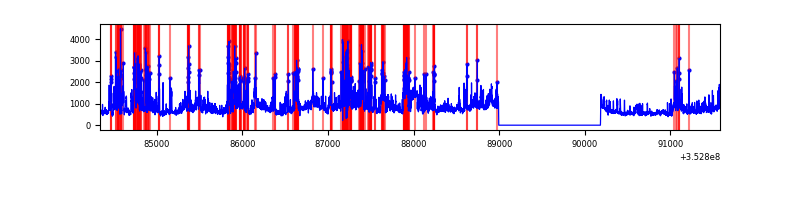 |
Top three noisy pixels from each quadrant. If the there are fewer than three noisy pixels in the level2.evt file, extra rows are filled as -1
| Pixel properties | Quadrant properties | ||||||
|---|---|---|---|---|---|---|---|
| Quadrant | DetID | PixID | Counts | Sigma | Mean | Median | Sigma |
| A | 13 | 254 | 11310 | 64.54 | 810 | 795 | 162.9 |
| A | 3 | 137 | 7482 | 41.05 | 810 | 795 | 162.9 |
| A | 0 | 226 | 7036 | 38.31 | 810 | 795 | 162.9 |
| B | 10 | 245 | 36287 | 236.76 | 790 | 772 | 150.0 |
| B | 0 | 190 | 25592 | 165.46 | 790 | 772 | 150.0 |
| B | 12 | 111 | 17779 | 113.38 | 790 | 772 | 150.0 |
| C | 3 | 233 | 7604069 | 50533.67 | 645 | 650 | 150.5 |
| C | 14 | 238 | 101329 | 669.13 | 645 | 650 | 150.5 |
| C | 2 | 114 | 11941 | 75.04 | 645 | 650 | 150.5 |
| D | 1 | 52 | 1827034 | 9923.5 | 768 | 748 | 184.0 |
| D | 8 | 195 | 418687 | 2270.96 | 768 | 748 | 184.0 |
| D | 13 | 104 | 379003 | 2055.33 | 768 | 748 | 184.0 |
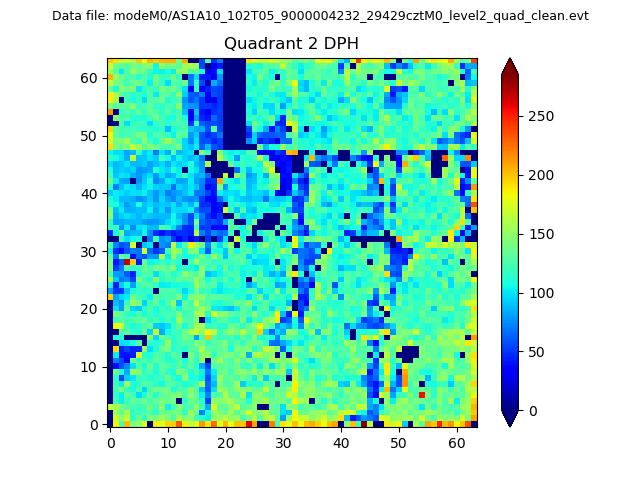
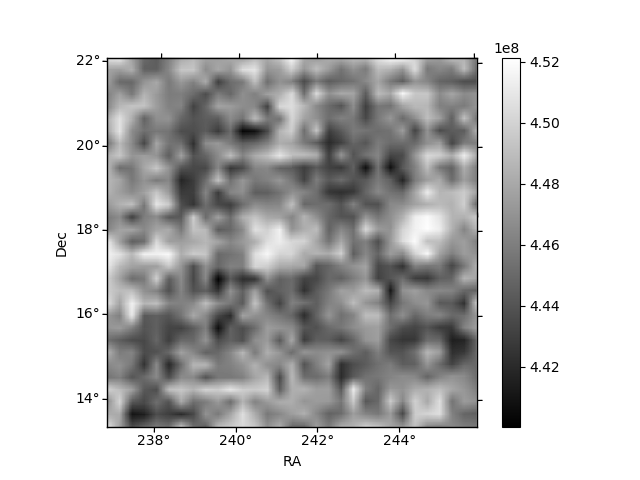
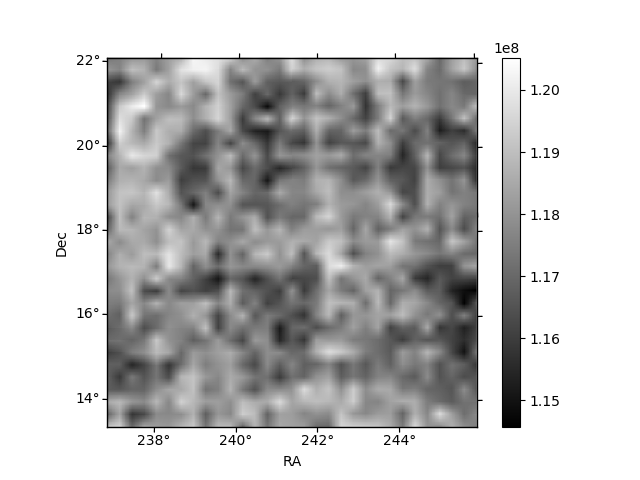
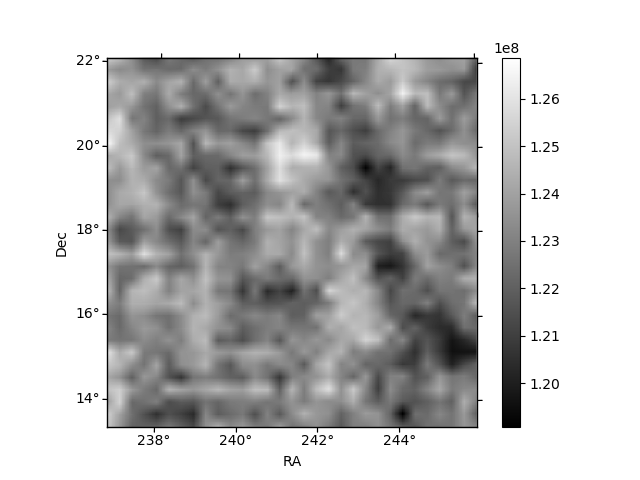
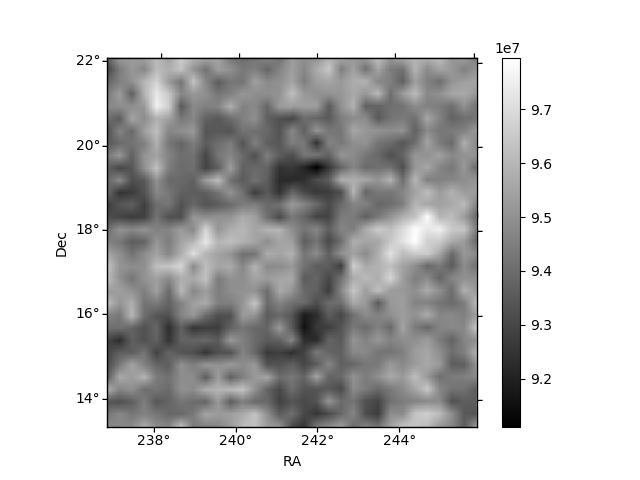
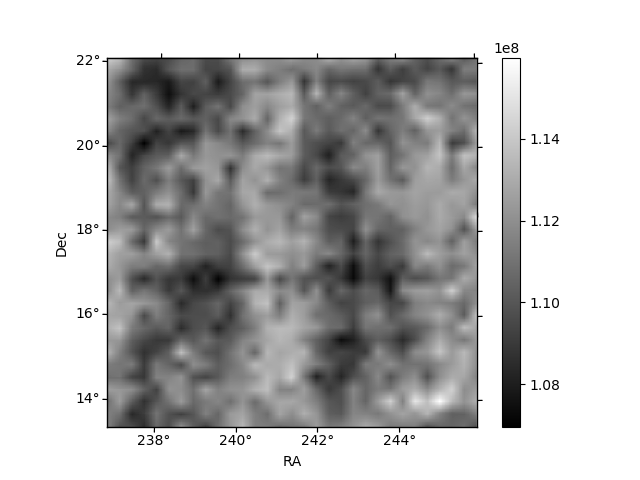
Histogram calculated using DETX and DETY for each event in the final _common_clean file
| Quadrant A | 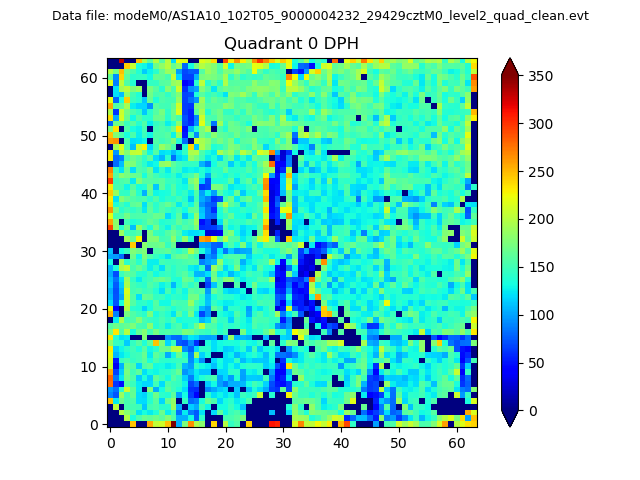 |
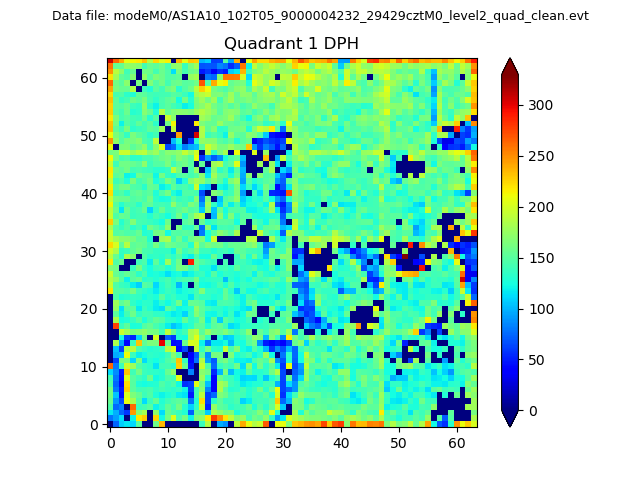 |
Quadrant B |
|---|---|---|---|
| Quadrant D | 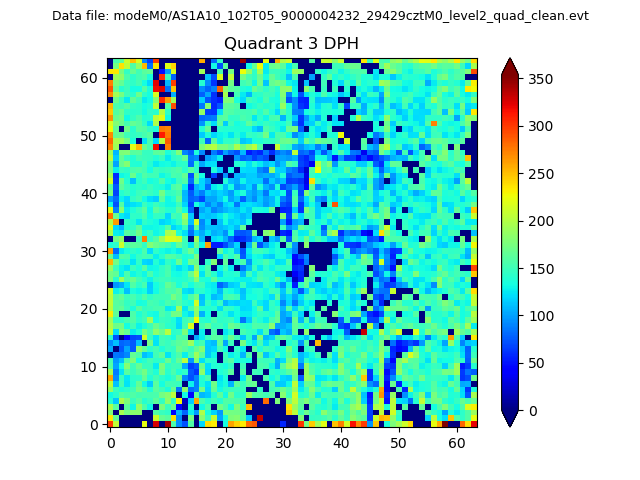 |
 |
Quadrant C |
| Plot type | Count rate plots | Images |
|---|---|---|
| Comparison with Poisson distribution Blue bars denote a histogram of data divided into 1 sec bins. Red curve is a Poisson curve with rate = median count rate of data. |
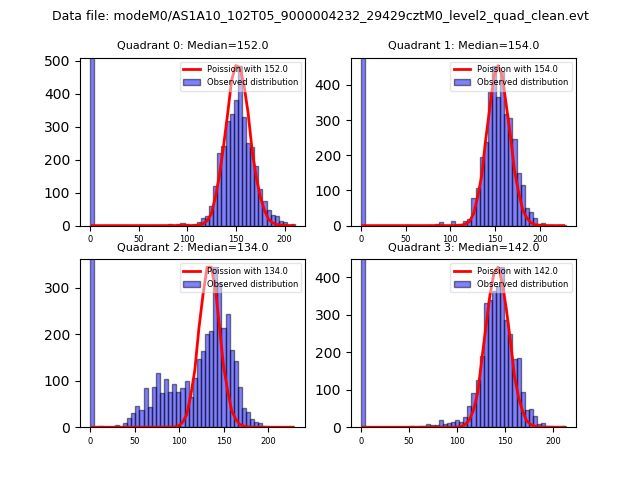 |
 |
| Quadrant-wise count rates Data is divided into 100 sec bins |
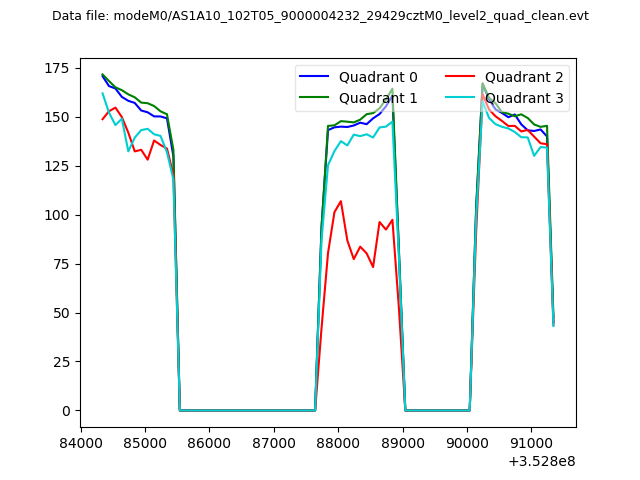 |
|
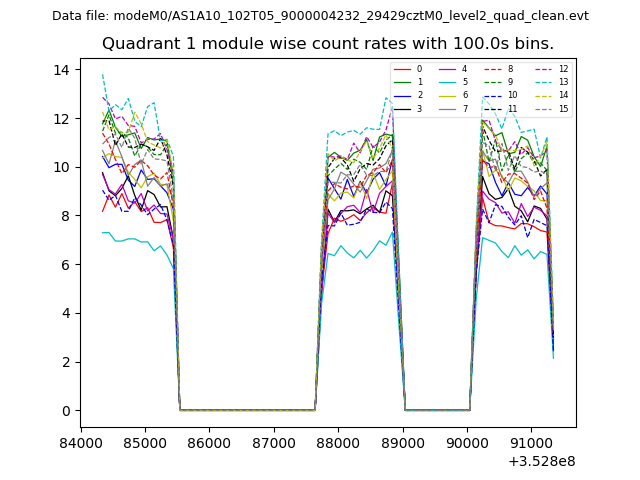
| Module-wise count rates for Quadrant A Data is divided into 100 sec bins |
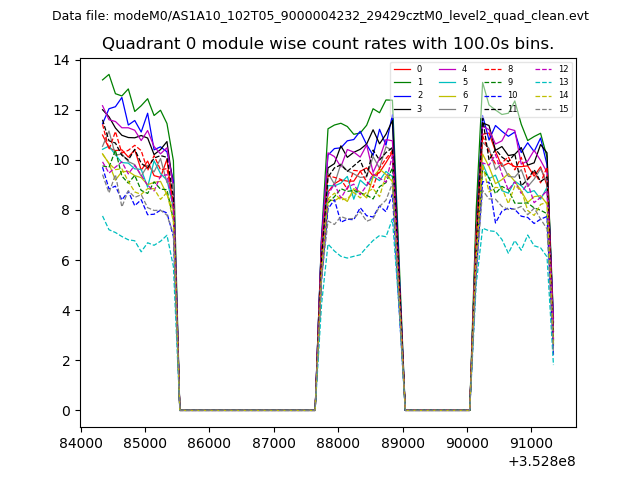 |
 |
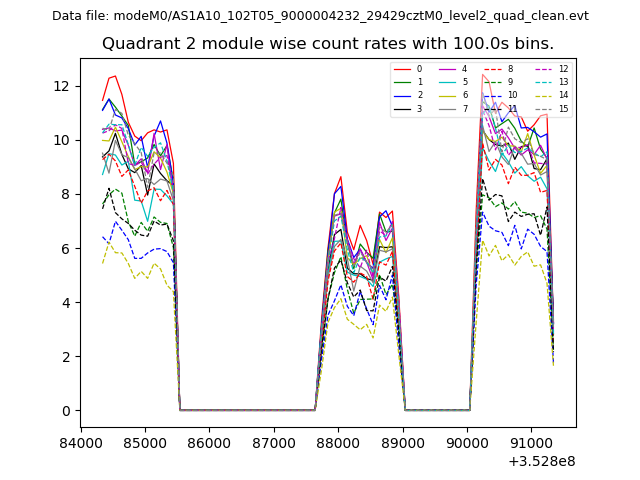
| Module-wise count rates for Quadrant B Data is divided into 100 sec bins |
 |
 |
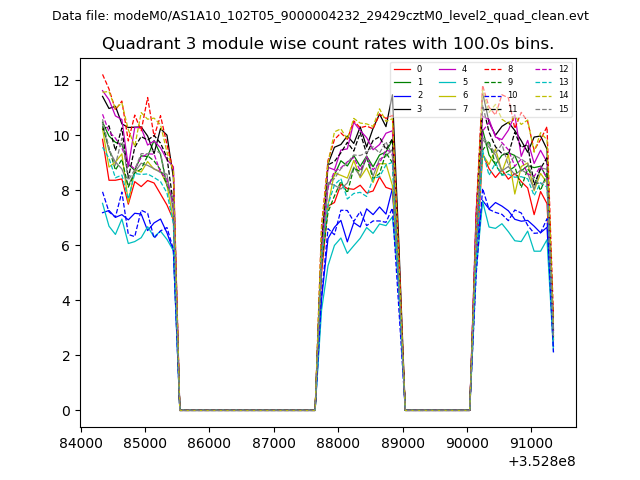
| Module-wise count rates for Quadrant C Data is divided into 100 sec bins |
 |
 |
| Module-wise count rates for Quadrant D Data is divided into 100 sec bins |
 |
 |
| Parameter | Plot |
|---|---|
| CZT HV Monitor | 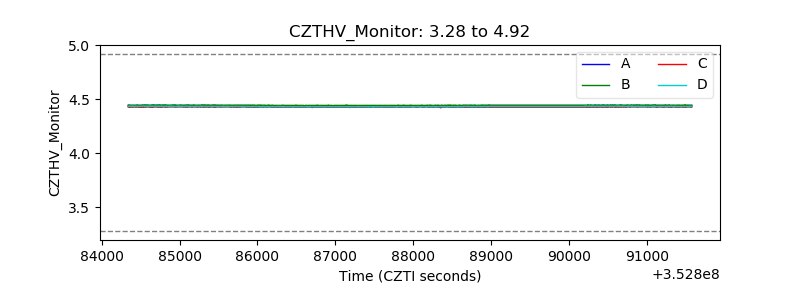 |
| D_VDD | 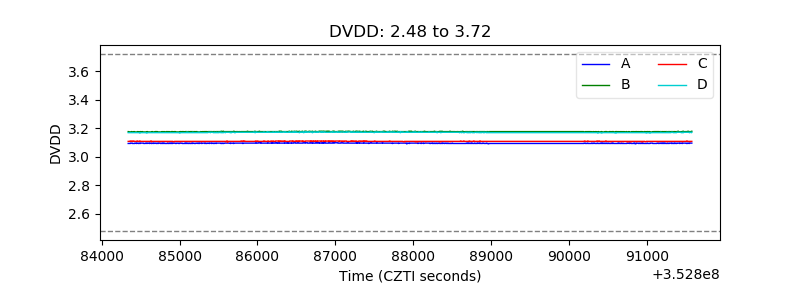 |
| Temperature 1 | 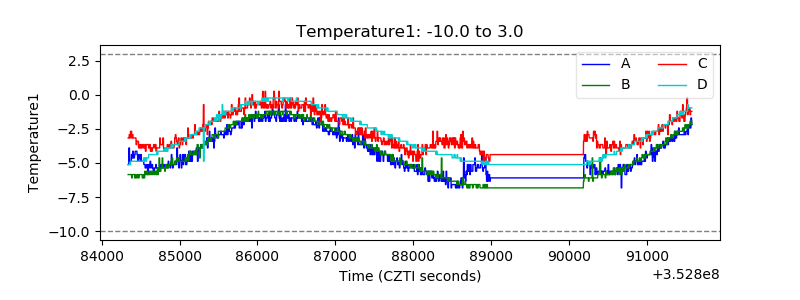 |
| Veto HV Monitor | 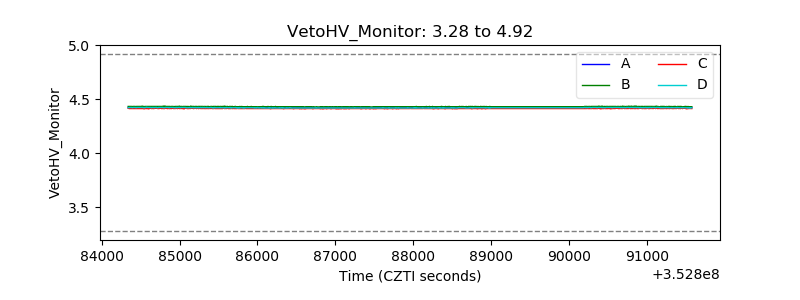 |
| Veto LLD | 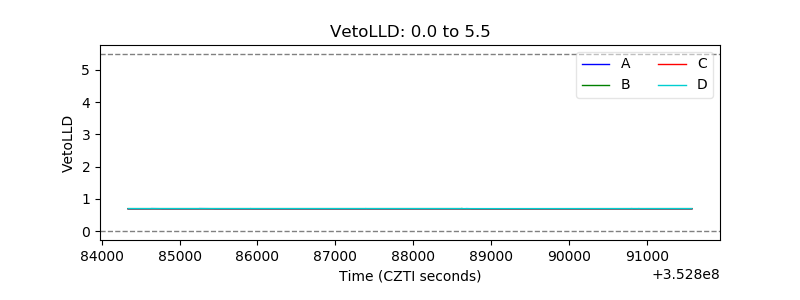 |
| Alpha Counter | 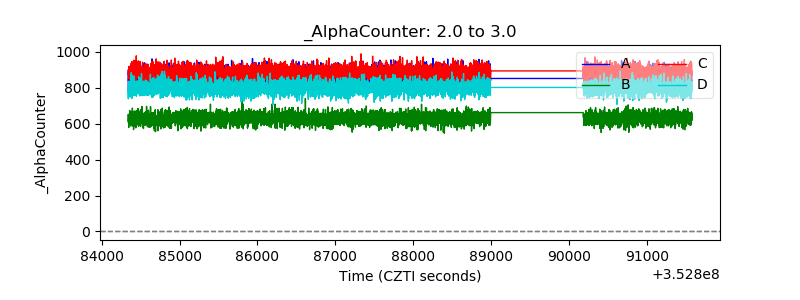 |
| _CPM_Rate | 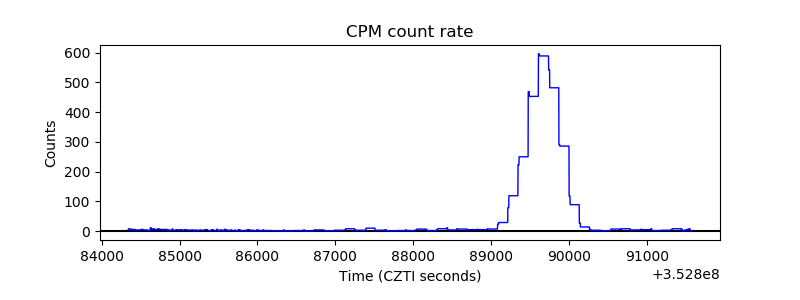 |
| CZT Counter | 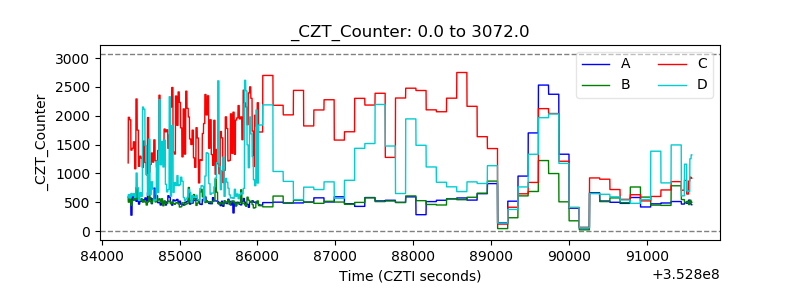 |
| +2.5 Volts monitor |  |
| +5 Volts monitor |  |
| _ROLL_ROT | 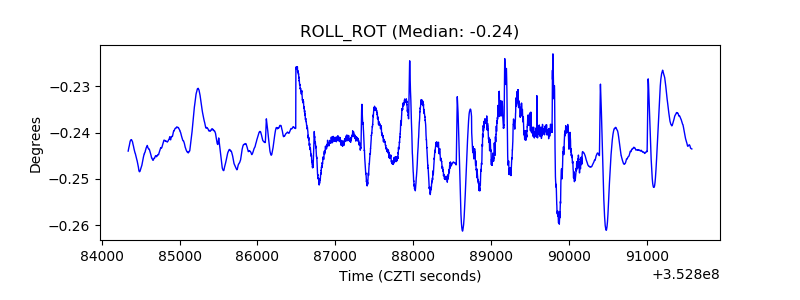 |
| _Roll_DEC | 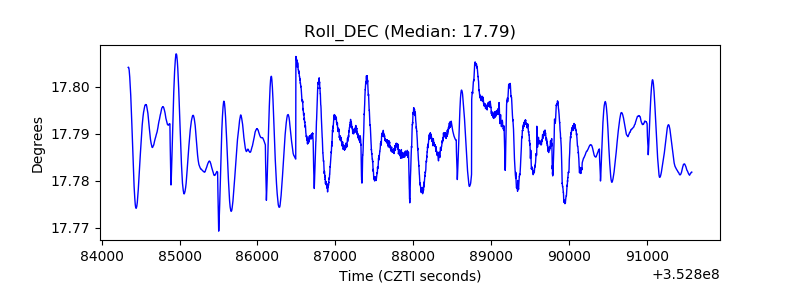 |
| _Roll_RA | 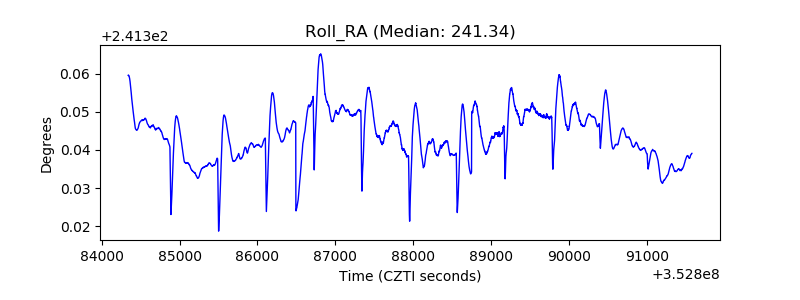 |
| Veto Counter | 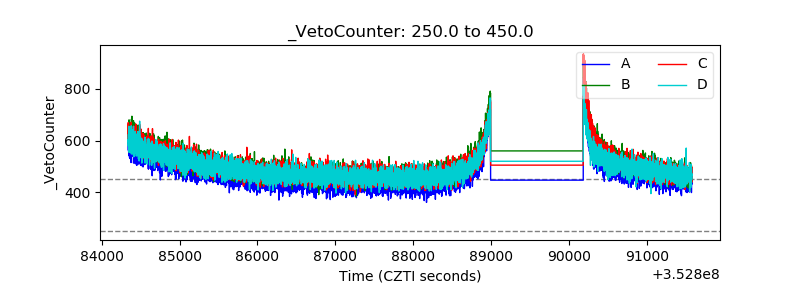 |