| Param | Original file | Final file |
|---|---|---|
| Filename | modeM0/AS1A10_102T05_9000004232_29431cztM0_level2.evt | modeM0/AS1A10_102T05_9000004232_29431cztM0_level2_quad_clean.evt |
| Size (bytes) | 806,800,320 | 78,871,680 |
| Size | 769.4 MB | 75.2 MB |
| Events in quadrant A | 3,517,078 | 487,108 |
| Events in quadrant B | 3,688,425 | 496,864 |
| Events in quadrant C | 8,259,982 | 454,257 |
| Events in quadrant D | 8,485,911 | 450,602 |
| Mode M9 | |||
|---|---|---|---|
| Quadrant | BADHDUFLAG | Total packets | Discarded packets |
| A | 0 | 4 | 0 |
| B | 0 | 4 | 0 |
| C | 0 | 4 | 0 |
| D | 0 | 4 | 0 |
| Mode SS | |||
|---|---|---|---|
| Quadrant | BADHDUFLAG | Total packets | Discarded packets |
| A | 0 | 144 | 0 |
| B | 0 | 144 | 0 |
| C | 0 | 144 | 0 |
| D | 0 | 144 | 0 |
| Mode M0 | |||
|---|---|---|---|
| Quadrant | BADHDUFLAG | Total packets | Discarded packets |
| A | 0 | 14849 | 1 |
| B | 0 | 15296 | 1 |
| C | 0 | 29637 | 1 |
| D | 0 | 30441 | 1 |
| Quadrant | Total seconds | Saturated seconds | Saturation percentage |
|---|---|---|---|
| A | 7166 | 190 | 2.651409% |
| B | 7167 | 201 | 2.804521% |
| C | 7167 | 1114 | 15.543463% |
| D | 7167 | 937 | 13.073811% |
Noise dominated data is calculated using 1-second bins in cleaned event files. If a bin has >2000 counts, and if more than 50% of those come from <1% of pixels, then it is considered to be noise-dominated and hence unusable.
| Quadrant | # 1 sec bins | Bins with >0 counts | Bins with >2000 counts | High rate bins dominated by noise | Noise dominated (total time) | Noise dominated (detector-on time) | Marked lightcurve |
|---|---|---|---|---|---|---|---|
| A | 7521 | 7168 | 0 | 0 | 0.00% | 0.00% | 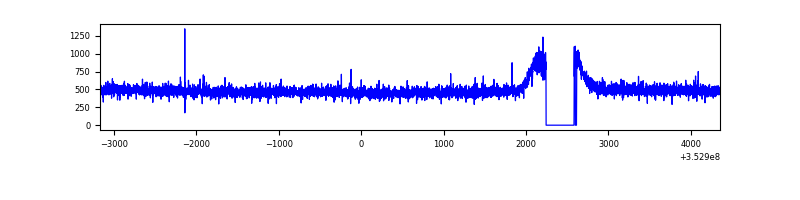 |
| B | 7522 | 7169 | 1 | 1 | 0.01% | 0.01% | 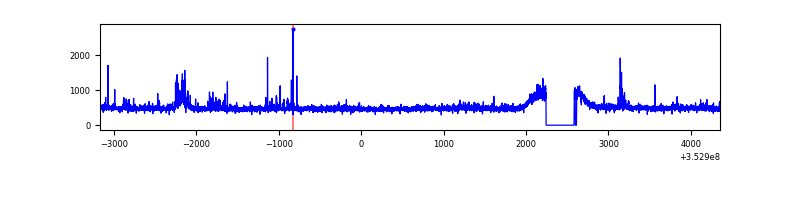 |
| C | 7522 | 7168 | 312 | 312 | 4.15% | 4.35% | 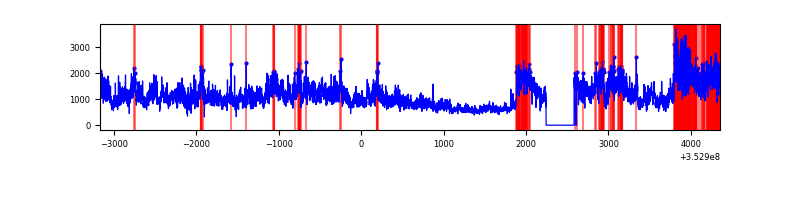 |
| D | 7522 | 7169 | 634 | 634 | 8.43% | 8.84% | 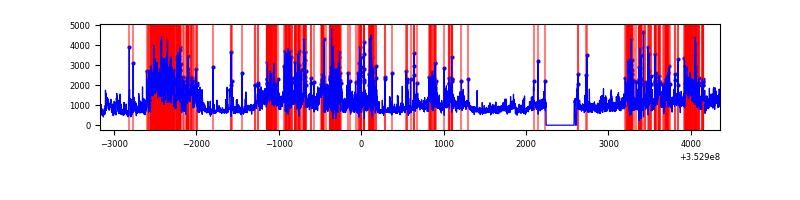 |
Top three noisy pixels from each quadrant. If the there are fewer than three noisy pixels in the level2.evt file, extra rows are filled as -1
| Pixel properties | Quadrant properties | ||||||
|---|---|---|---|---|---|---|---|
| Quadrant | DetID | PixID | Counts | Sigma | Mean | Median | Sigma |
| A | 13 | 254 | 14080 | 71.14 | 911 | 892 | 185.4 |
| A | 3 | 137 | 8873 | 43.05 | 911 | 892 | 185.4 |
| A | 0 | 226 | 7788 | 37.2 | 911 | 892 | 185.4 |
| B | 15 | 33 | 54416 | 311.03 | 897 | 875 | 172.1 |
| B | 0 | 190 | 29125 | 164.11 | 897 | 875 | 172.1 |
| B | 12 | 111 | 21621 | 120.52 | 897 | 875 | 172.1 |
| C | 3 | 233 | 4487475 | 22918.24 | 835 | 842 | 195.8 |
| C | 10 | 9 | 300442 | 1530.39 | 835 | 842 | 195.8 |
| C | 14 | 238 | 151103 | 767.55 | 835 | 842 | 195.8 |
| D | 8 | 195 | 1846739 | 8996.9 | 853 | 831 | 205.2 |
| D | 1 | 52 | 1664182 | 8107.12 | 853 | 831 | 205.2 |
| D | 13 | 104 | 916266 | 4461.8 | 853 | 831 | 205.2 |
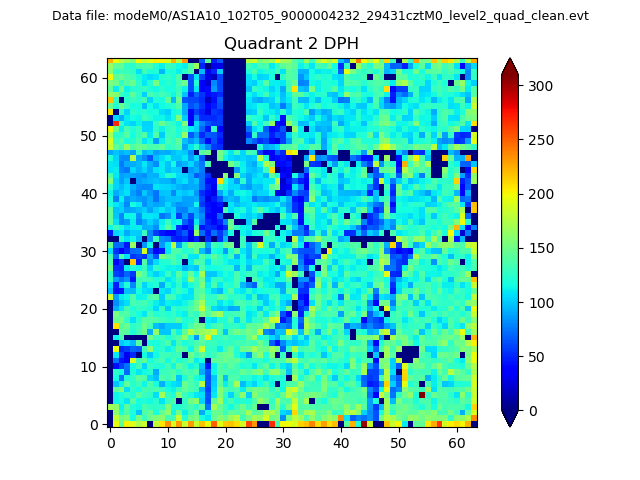
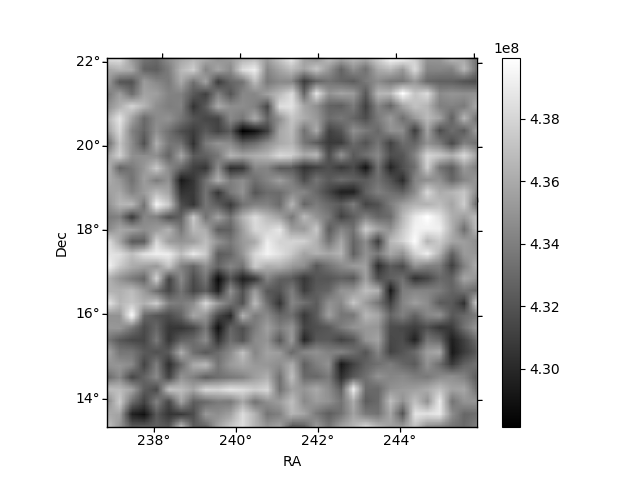
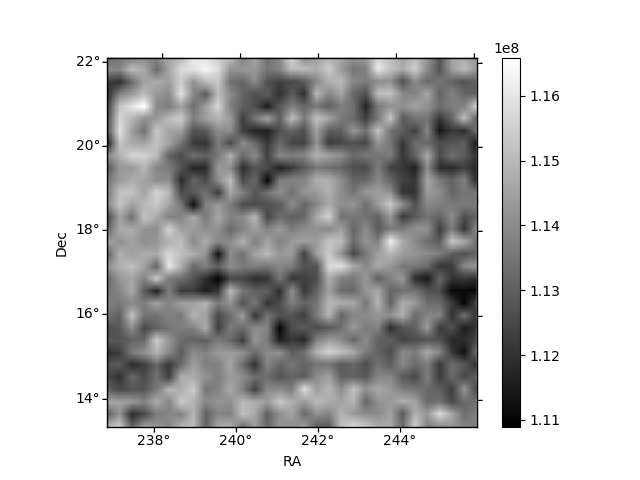
Histogram calculated using DETX and DETY for each event in the final _common_clean file
| Quadrant A | 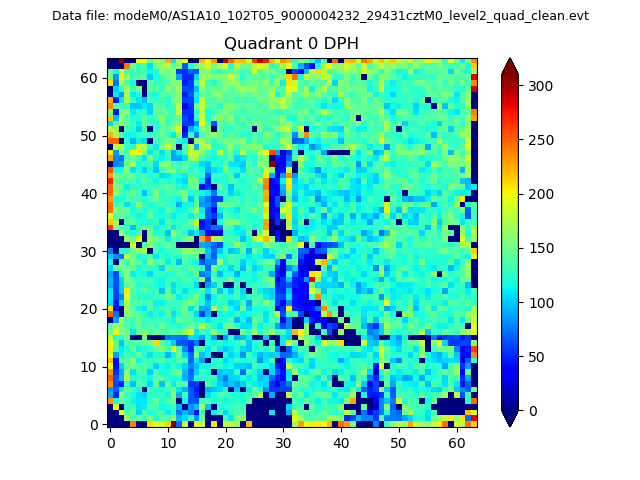 |
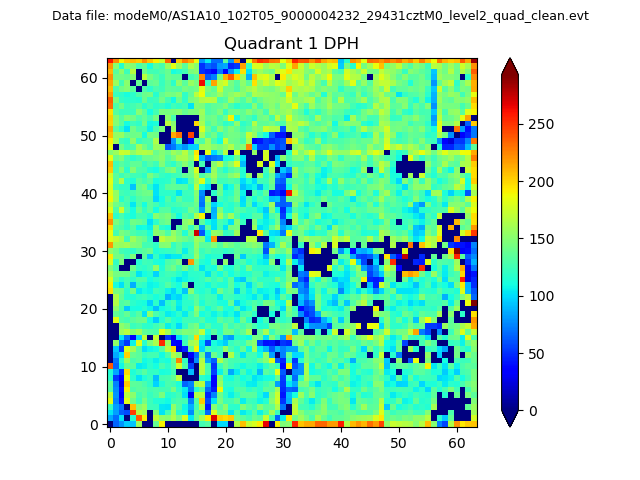 |
Quadrant B |
|---|---|---|---|
| Quadrant D | 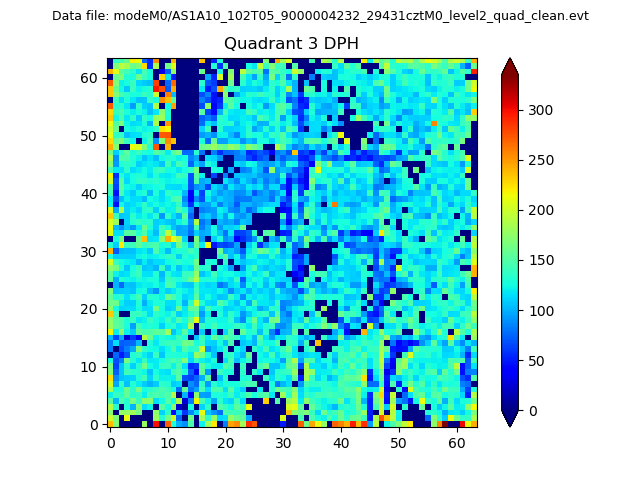 |
 |
Quadrant C |
| Plot type | Count rate plots | Images |
|---|---|---|
| Comparison with Poisson distribution Blue bars denote a histogram of data divided into 1 sec bins. Red curve is a Poisson curve with rate = median count rate of data. |
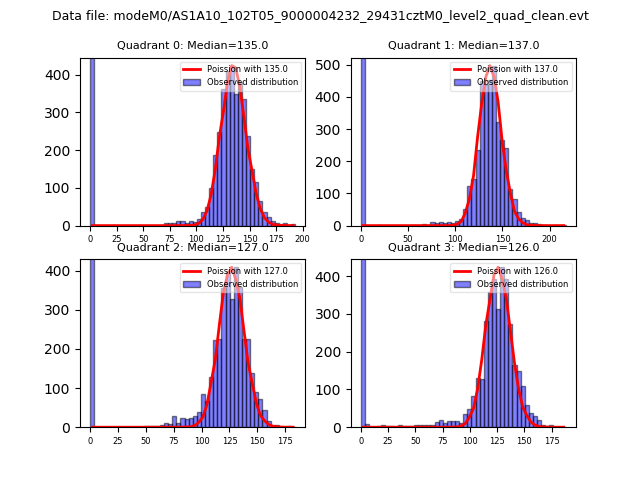 |
 |
| Quadrant-wise count rates Data is divided into 100 sec bins |
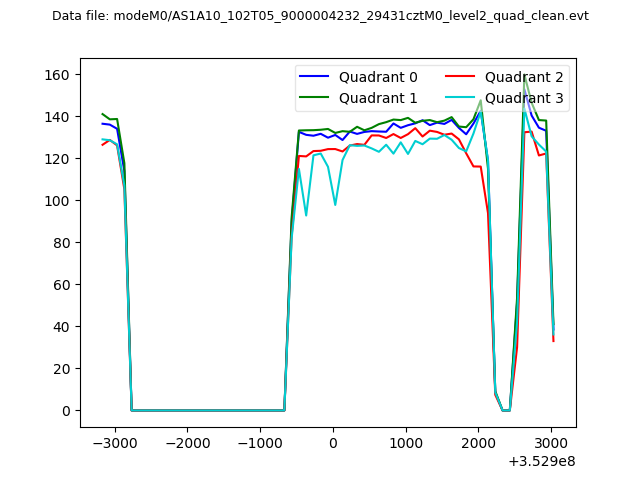 |
|
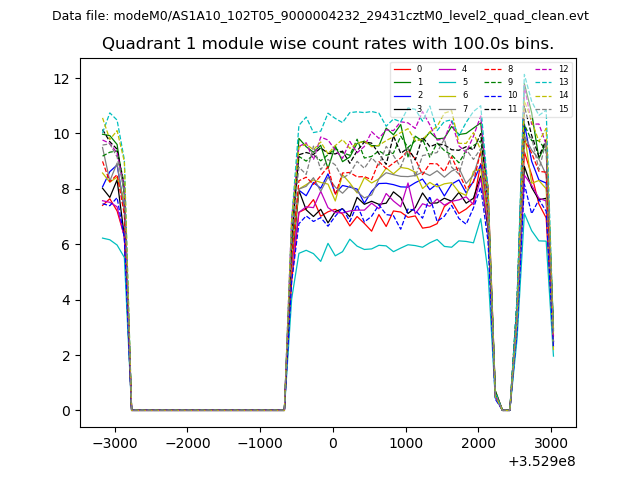
| Module-wise count rates for Quadrant A Data is divided into 100 sec bins |
 |
 |
| Module-wise count rates for Quadrant B Data is divided into 100 sec bins |
 |
 |
| Module-wise count rates for Quadrant C Data is divided into 100 sec bins |
 |
 |
| Module-wise count rates for Quadrant D Data is divided into 100 sec bins |
 |
 |
| Parameter | Plot |
|---|---|
| CZT HV Monitor | 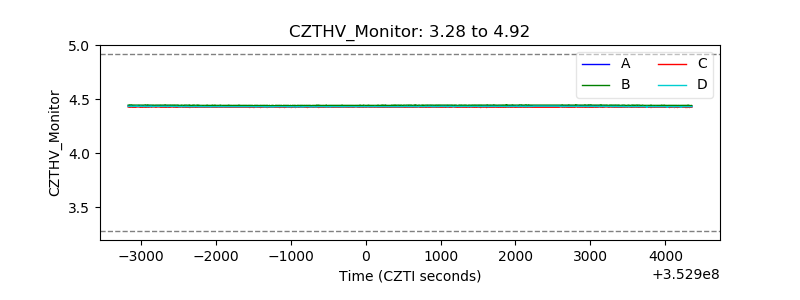 |
| D_VDD | 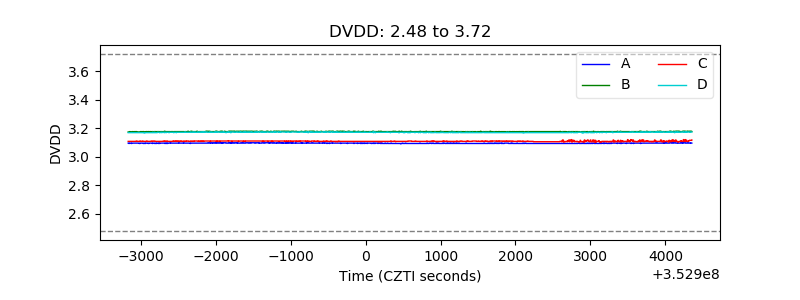 |
| Temperature 1 | 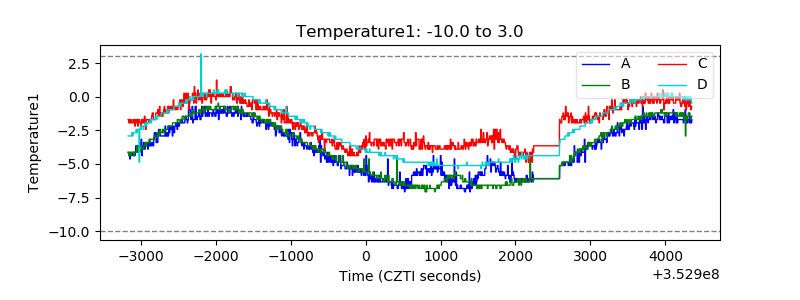 |
| Veto HV Monitor | 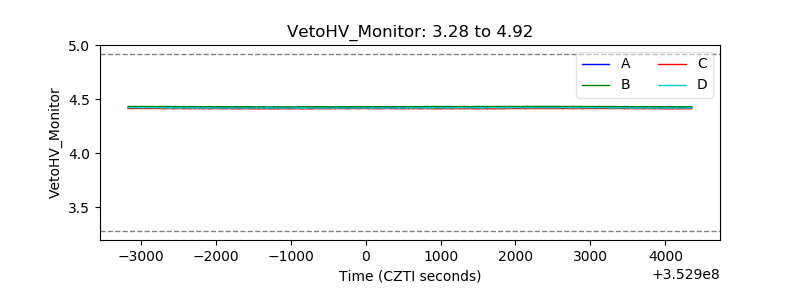 |
| Veto LLD |  |
| Alpha Counter | 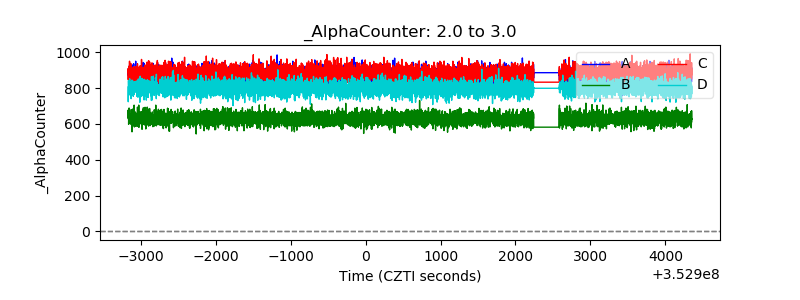 |
| _CPM_Rate | 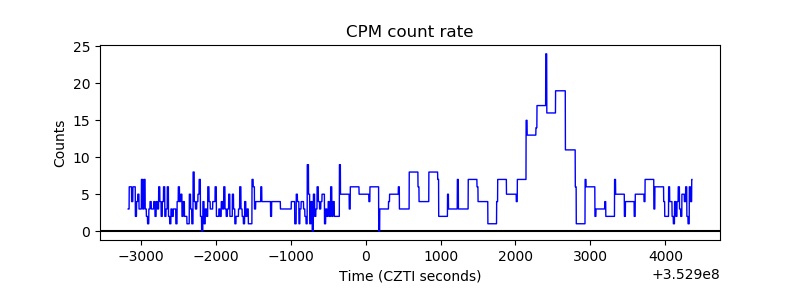 |
| CZT Counter | 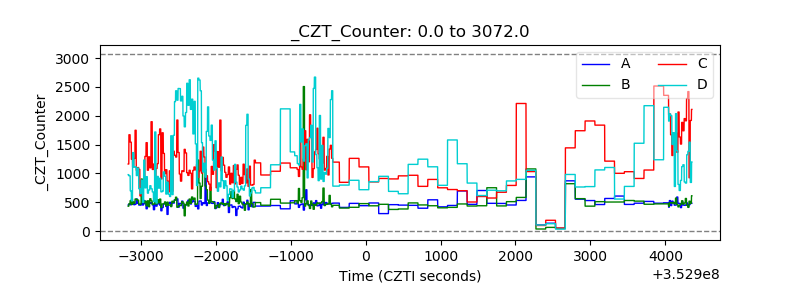 |
| +2.5 Volts monitor |  |
| +5 Volts monitor |  |
| _ROLL_ROT |  |
| _Roll_DEC | 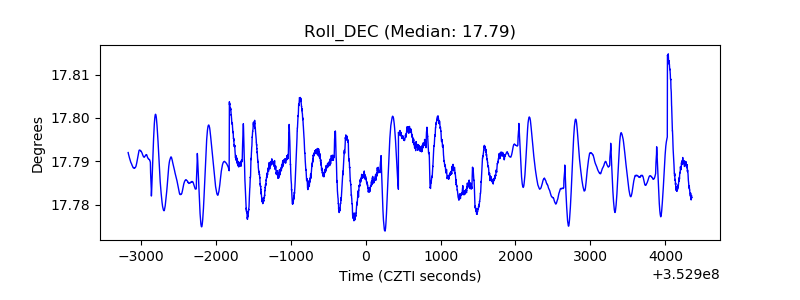 |
| _Roll_RA | 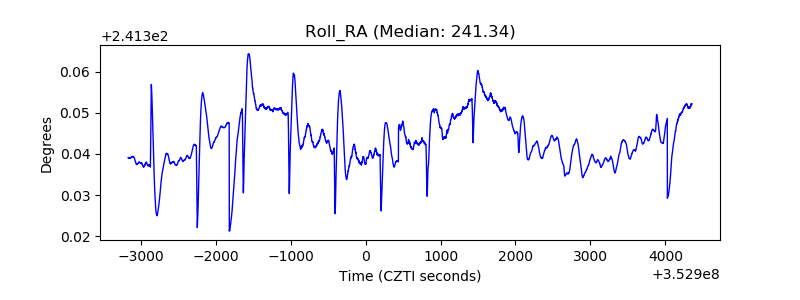 |
| Veto Counter |  |