| Param | Original file | Final file |
|---|---|---|
| Filename | modeM0/AS1A10_102T05_9000004232_29432cztM0_level2.evt | modeM0/AS1A10_102T05_9000004232_29432cztM0_level2_quad_clean.evt |
| Size (bytes) | 871,231,680 | 76,559,040 |
| Size | 830.9 MB | 73.0 MB |
| Events in quadrant A | 3,665,810 | 461,498 |
| Events in quadrant B | 3,862,882 | 470,525 |
| Events in quadrant C | 8,515,860 | 437,766 |
| Events in quadrant D | 9,836,441 | 426,648 |
| Mode M9 | |||
|---|---|---|---|
| Quadrant | BADHDUFLAG | Total packets | Discarded packets |
| A | 0 | 1 | 0 |
| B | 0 | 1 | 0 |
| C | 0 | 1 | 0 |
| D | 0 | 1 | 0 |
| Mode SS | |||
|---|---|---|---|
| Quadrant | BADHDUFLAG | Total packets | Discarded packets |
| A | 0 | 152 | 0 |
| B | 0 | 152 | 0 |
| C | 0 | 152 | 0 |
| D | 0 | 152 | 0 |
| Mode M0 | |||
|---|---|---|---|
| Quadrant | BADHDUFLAG | Total packets | Discarded packets |
| A | 0 | 15592 | 1 |
| B | 0 | 16094 | 1 |
| C | 0 | 30689 | 1 |
| D | 0 | 34474 | 1 |
| Quadrant | Total seconds | Saturated seconds | Saturation percentage |
|---|---|---|---|
| A | 7488 | 178 | 2.377137% |
| B | 7489 | 218 | 2.910936% |
| C | 7489 | 1136 | 15.168914% |
| D | 7489 | 1220 | 16.290559% |
Noise dominated data is calculated using 1-second bins in cleaned event files. If a bin has >2000 counts, and if more than 50% of those come from <1% of pixels, then it is considered to be noise-dominated and hence unusable.
| Quadrant | # 1 sec bins | Bins with >0 counts | Bins with >2000 counts | High rate bins dominated by noise | Noise dominated (total time) | Noise dominated (detector-on time) | Marked lightcurve |
|---|---|---|---|---|---|---|---|
| A | 7563 | 7490 | 0 | 0 | 0.00% | 0.00% | 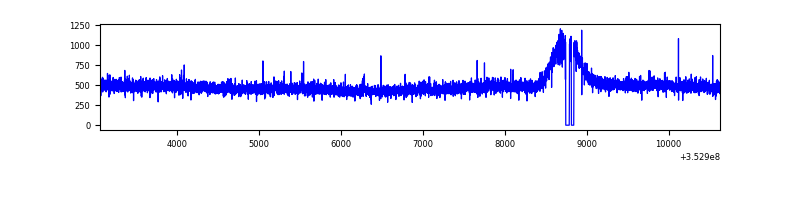 |
| B | 7564 | 7491 | 7 | 7 | 0.09% | 0.09% | 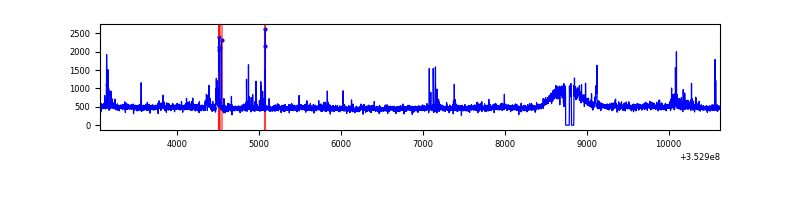 |
| C | 7564 | 7491 | 400 | 400 | 5.29% | 5.34% | 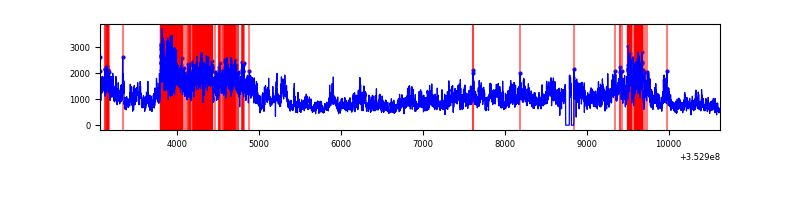 |
| D | 7564 | 7491 | 811 | 811 | 10.72% | 10.83% | 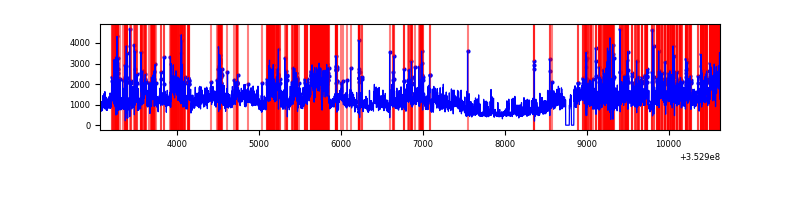 |
Top three noisy pixels from each quadrant. If the there are fewer than three noisy pixels in the level2.evt file, extra rows are filled as -1
| Pixel properties | Quadrant properties | ||||||
|---|---|---|---|---|---|---|---|
| Quadrant | DetID | PixID | Counts | Sigma | Mean | Median | Sigma |
| A | 13 | 254 | 14396 | 69.69 | 948 | 925 | 193.3 |
| A | 3 | 137 | 9541 | 44.57 | 948 | 925 | 193.3 |
| A | 0 | 226 | 8139 | 37.32 | 948 | 925 | 193.3 |
| B | 5 | 255 | 59666 | 319.16 | 937 | 911 | 184.1 |
| B | 0 | 229 | 35656 | 188.73 | 937 | 911 | 184.1 |
| B | 0 | 190 | 26897 | 141.16 | 937 | 911 | 184.1 |
| C | 3 | 233 | 4684672 | 22926.52 | 873 | 878 | 204.3 |
| C | 10 | 9 | 249533 | 1217.13 | 873 | 878 | 204.3 |
| C | 14 | 238 | 137450 | 668.5 | 873 | 878 | 204.3 |
| D | 8 | 195 | 3180995 | 14983.25 | 884 | 860 | 212.2 |
| D | 1 | 52 | 1690151 | 7959.12 | 884 | 860 | 212.2 |
| D | 13 | 104 | 1249180 | 5881.48 | 884 | 860 | 212.2 |
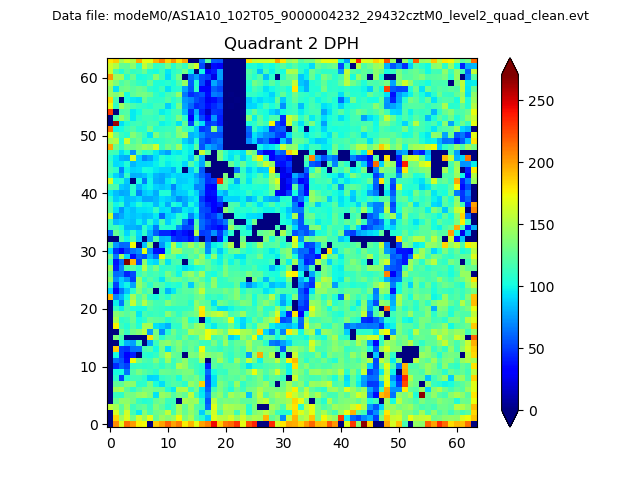
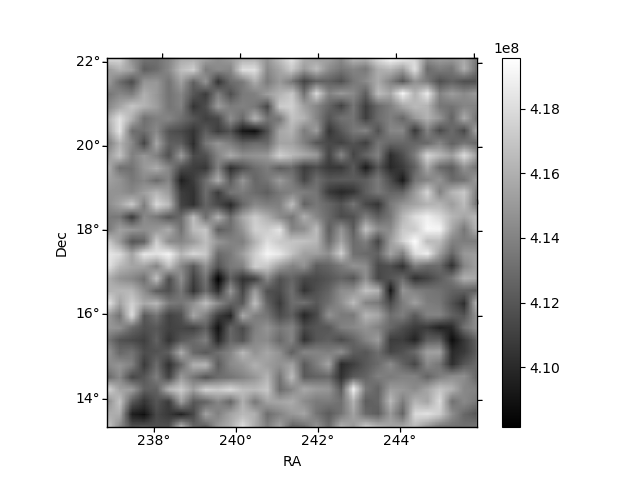
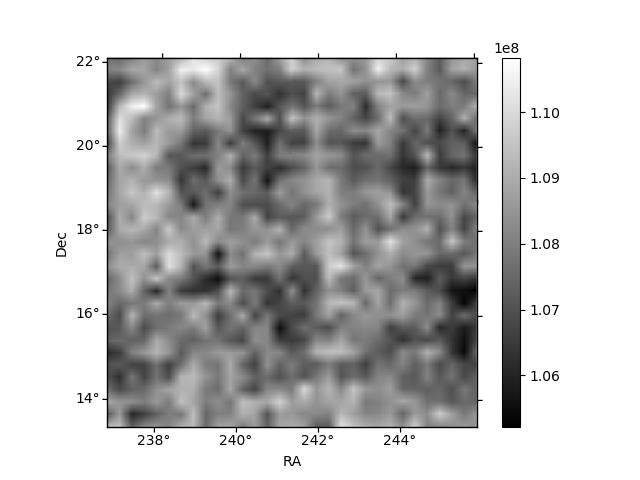
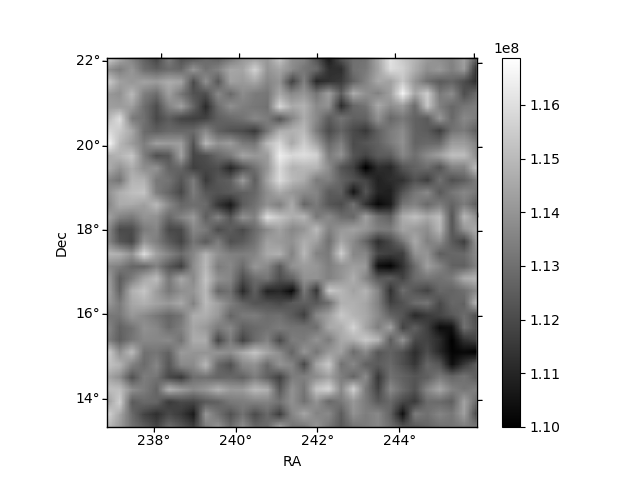
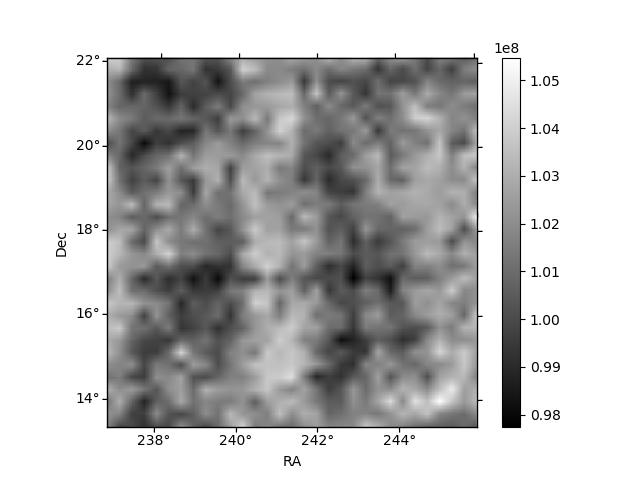
Histogram calculated using DETX and DETY for each event in the final _common_clean file
| Quadrant A | 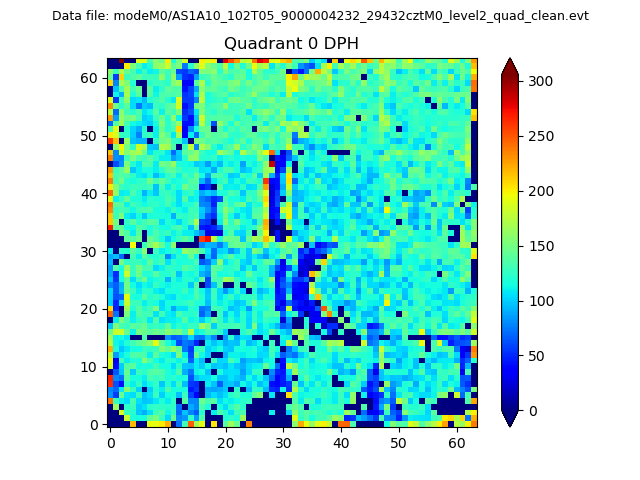 |
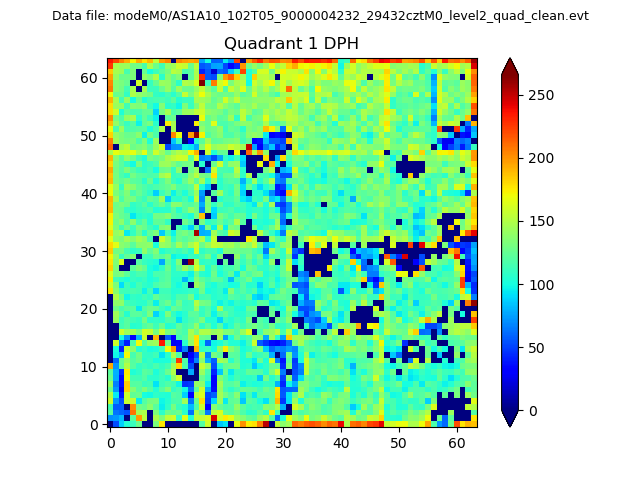 |
Quadrant B |
|---|---|---|---|
| Quadrant D | 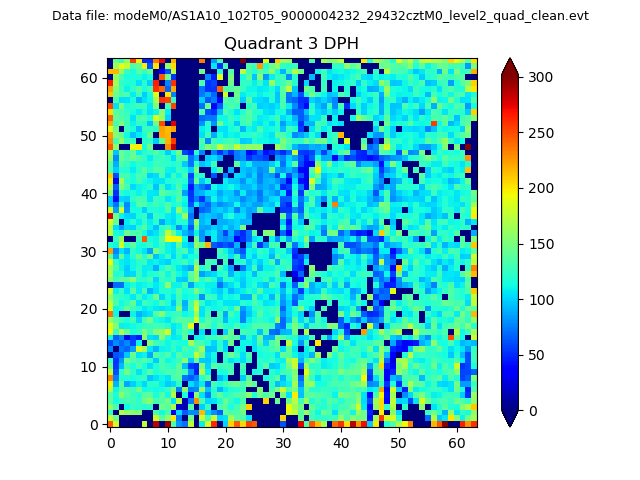 |
 |
Quadrant C |
| Plot type | Count rate plots | Images |
|---|---|---|
| Comparison with Poisson distribution Blue bars denote a histogram of data divided into 1 sec bins. Red curve is a Poisson curve with rate = median count rate of data. |
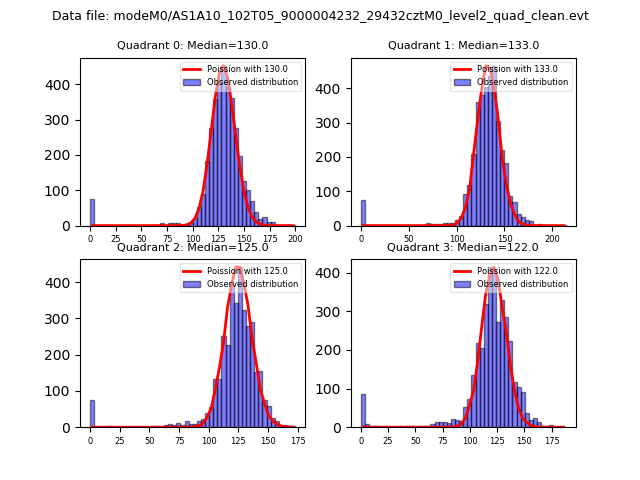 |
 |
| Quadrant-wise count rates Data is divided into 100 sec bins |
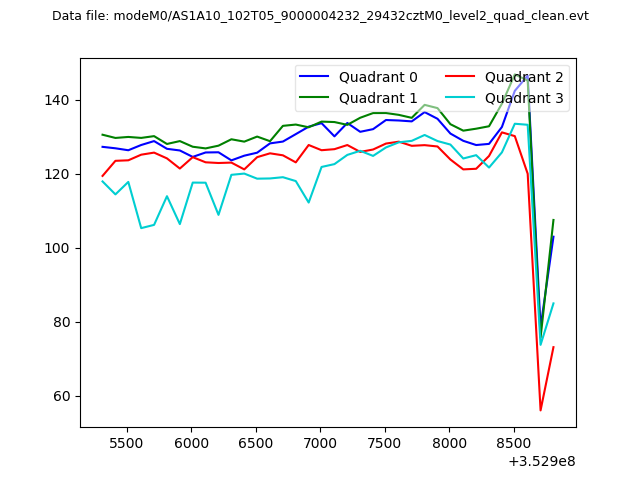 |
|
| Module-wise count rates for Quadrant A Data is divided into 100 sec bins |
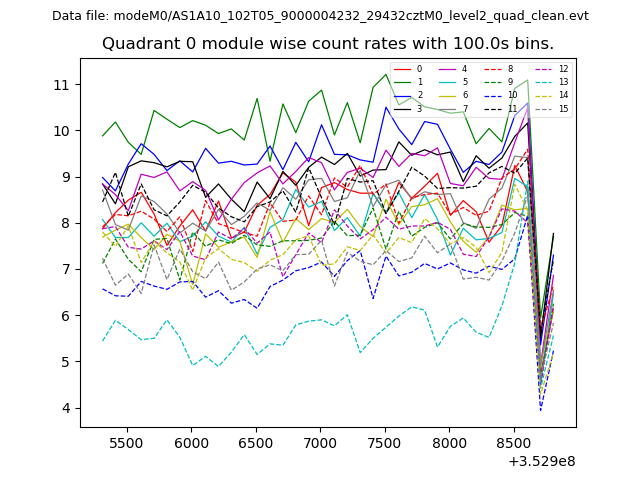 |
 |
| Module-wise count rates for Quadrant B Data is divided into 100 sec bins |
 |
 |
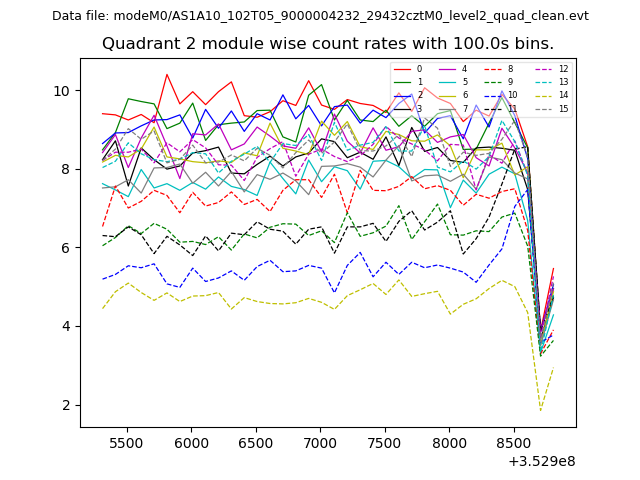
| Module-wise count rates for Quadrant C Data is divided into 100 sec bins |
 |
 |
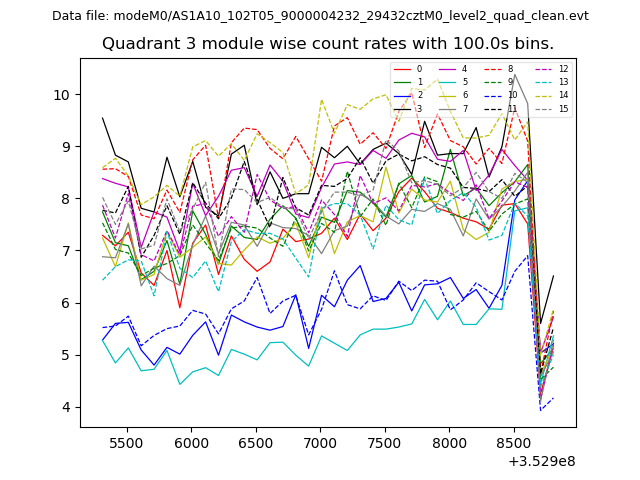
| Module-wise count rates for Quadrant D Data is divided into 100 sec bins |
 |
 |
| Parameter | Plot |
|---|---|
| CZT HV Monitor | 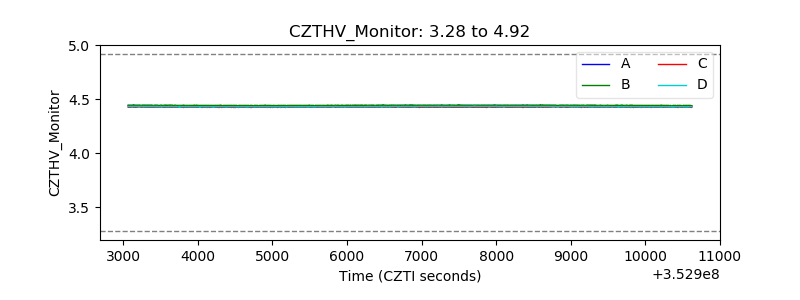 |
| D_VDD | 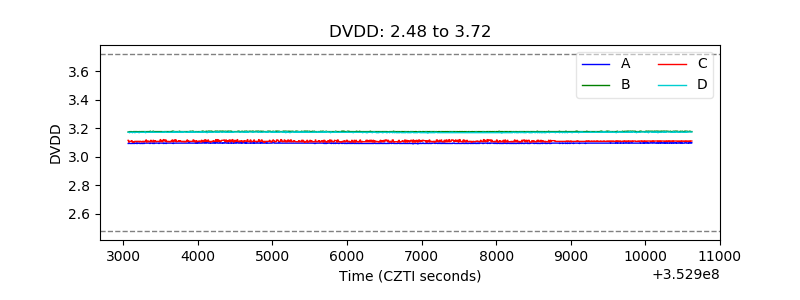 |
| Temperature 1 | 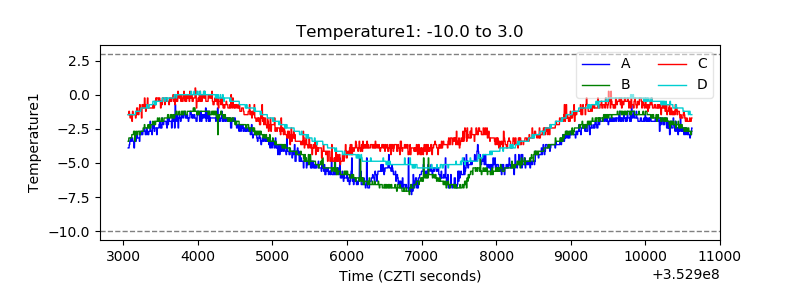 |
| Veto HV Monitor | 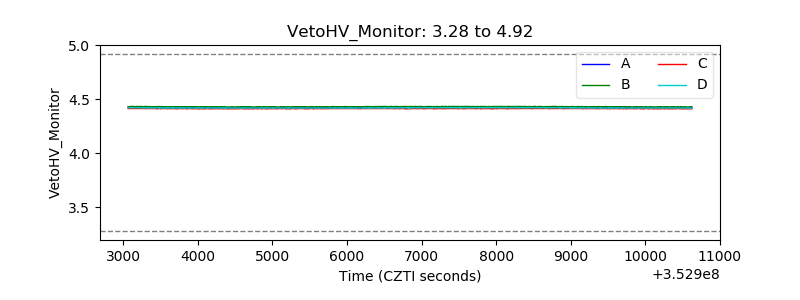 |
| Veto LLD | 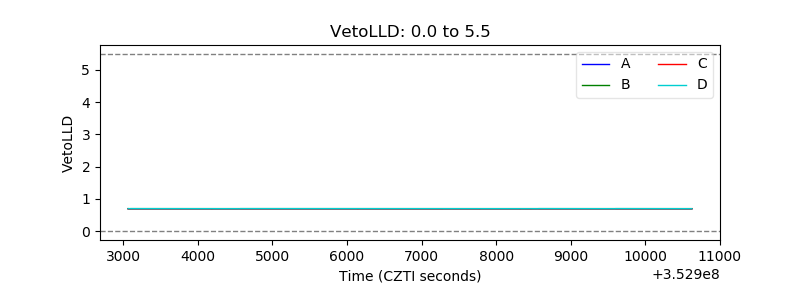 |
| Alpha Counter | 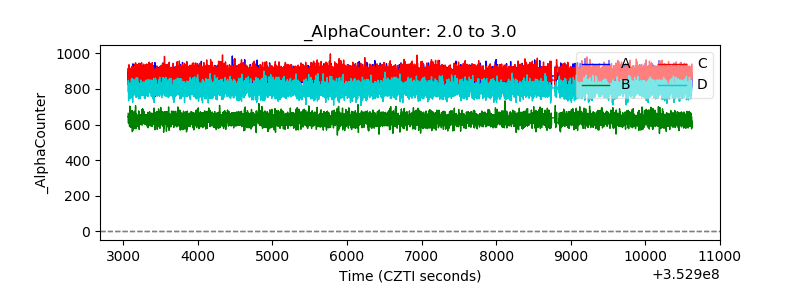 |
| _CPM_Rate | 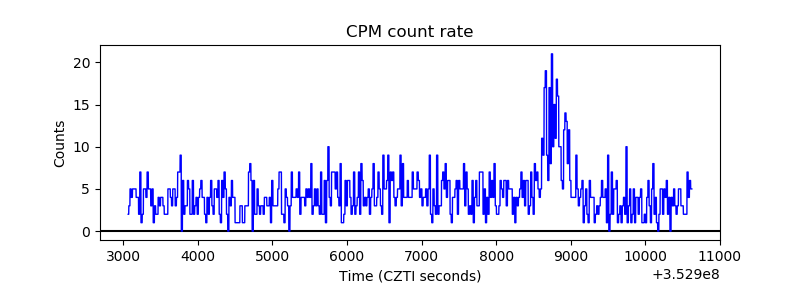 |
| CZT Counter | 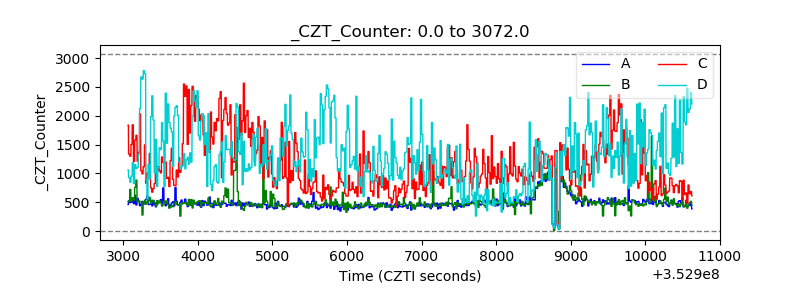 |
| +2.5 Volts monitor |  |
| +5 Volts monitor |  |
| _ROLL_ROT | 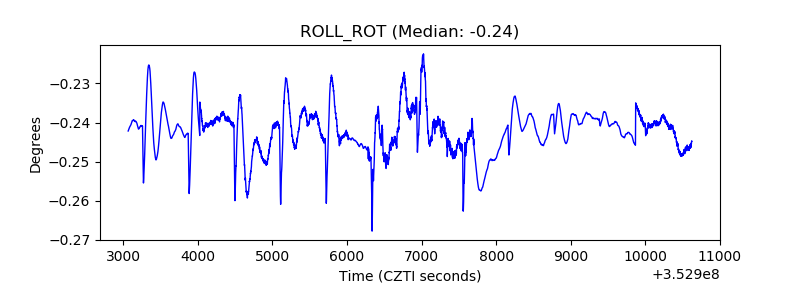 |
| _Roll_DEC | 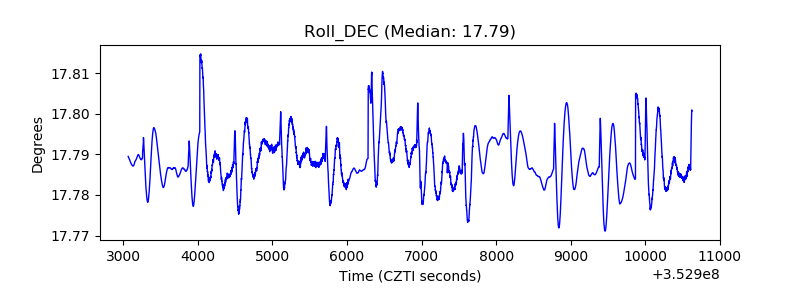 |
| _Roll_RA | 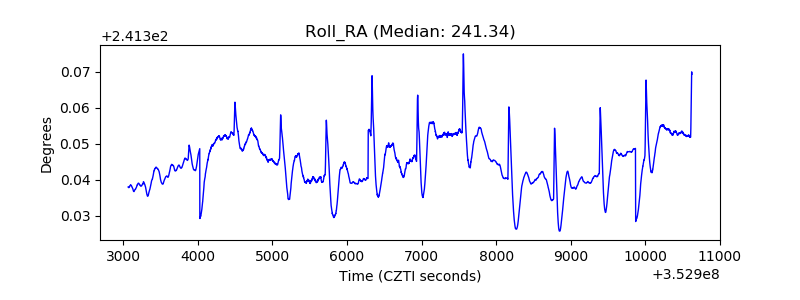 |
| Veto Counter | 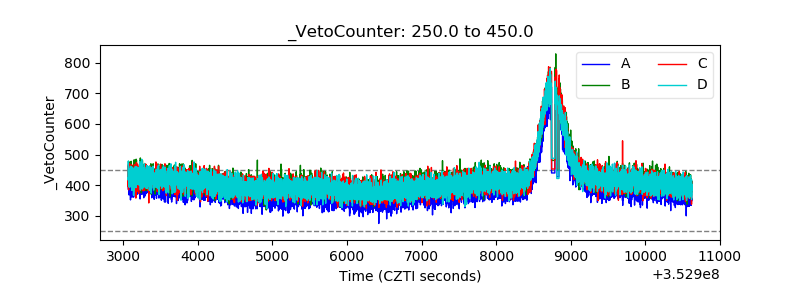 |