| Param | Original file | Final file |
|---|---|---|
| Filename | modeM0/AS1A10_102T05_9000004232_29436cztM0_level2.evt | modeM0/AS1A10_102T05_9000004232_29436cztM0_level2_quad_clean.evt |
| Size (bytes) | 1,921,809,600 | 233,542,080 |
| Size | 1.8 GB | 222.7 MB |
| Events in quadrant A | 8,857,950 | 1,487,886 |
| Events in quadrant B | 9,835,503 | 1,513,737 |
| Events in quadrant C | 13,401,378 | 1,456,035 |
| Events in quadrant D | 24,865,264 | 1,342,627 |
| Mode M9 | |||
|---|---|---|---|
| Quadrant | BADHDUFLAG | Total packets | Discarded packets |
| A | 0 | 23 | 0 |
| B | 0 | 23 | 0 |
| C | 0 | 23 | 0 |
| D | 0 | 23 | 0 |
| Mode SS | |||
|---|---|---|---|
| Quadrant | BADHDUFLAG | Total packets | Discarded packets |
| A | 0 | 382 | 10 |
| B | 0 | 382 | 2 |
| C | 0 | 382 | 10 |
| D | 0 | 382 | 4 |
| Mode M0 | |||
|---|---|---|---|
| Quadrant | BADHDUFLAG | Total packets | Discarded packets |
| A | 0 | 38816 | 411 |
| B | 0 | 41874 | 663 |
| C | 0 | 53411 | 1222 |
| D | 0 | 88617 | 1786 |
| Quadrant | Total seconds | Saturated seconds | Saturation percentage |
|---|---|---|---|
| A | 18562 | 176 | 0.948174% |
| B | 18512 | 385 | 2.079732% |
| C | 18437 | 820 | 4.447578% |
| D | 18377 | 4755 | 25.874735% |
Noise dominated data is calculated using 1-second bins in cleaned event files. If a bin has >2000 counts, and if more than 50% of those come from <1% of pixels, then it is considered to be noise-dominated and hence unusable.
| Quadrant | # 1 sec bins | Bins with >0 counts | Bins with >2000 counts | High rate bins dominated by noise | Noise dominated (total time) | Noise dominated (detector-on time) | Marked lightcurve |
|---|---|---|---|---|---|---|---|
| A | 21000 | 18736 | 0 | 0 | 0.00% | 0.00% | 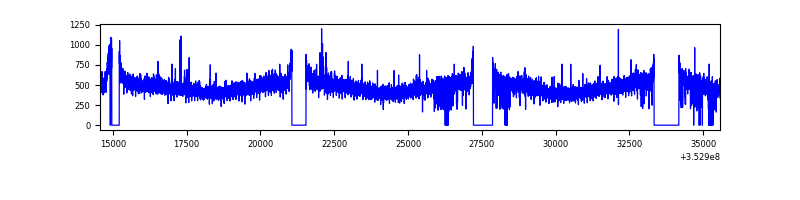 |
| B | 21000 | 18733 | 32 | 32 | 0.15% | 0.17% | 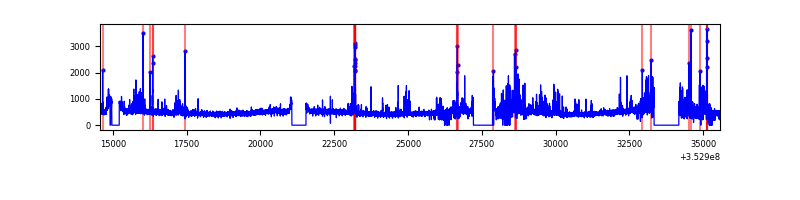 |
| C | 21001 | 18705 | 49 | 49 | 0.23% | 0.26% | 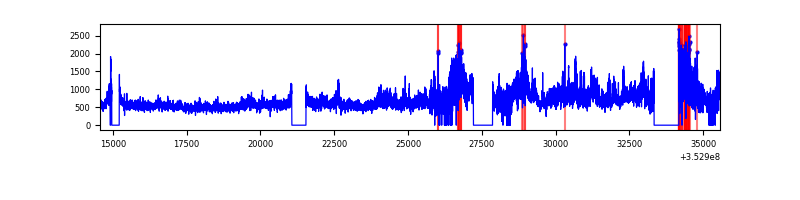 |
| D | 21001 | 18668 | 3413 | 3413 | 16.25% | 18.28% | 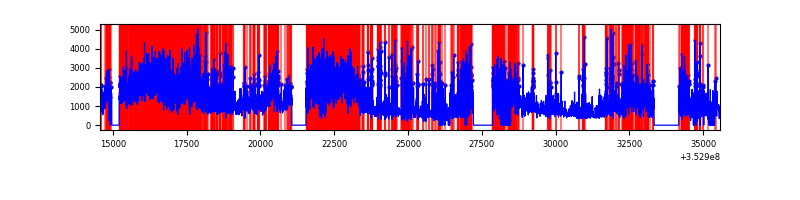 |
Top three noisy pixels from each quadrant. If the there are fewer than three noisy pixels in the level2.evt file, extra rows are filled as -1
| Pixel properties | Quadrant properties | ||||||
|---|---|---|---|---|---|---|---|
| Quadrant | DetID | PixID | Counts | Sigma | Mean | Median | Sigma |
| A | 1 | 113 | 49833 | 104.15 | 2277 | 2225 | 457.1 |
| A | 13 | 254 | 35963 | 73.81 | 2277 | 2225 | 457.1 |
| A | 3 | 137 | 23234 | 45.96 | 2277 | 2225 | 457.1 |
| B | 10 | 245 | 736299 | 1682.02 | 2252 | 2192 | 436.4 |
| B | 5 | 255 | 74332 | 165.29 | 2252 | 2192 | 436.4 |
| B | 0 | 229 | 72850 | 161.9 | 2252 | 2192 | 436.4 |
| C | 3 | 233 | 4581065 | 9080.37 | 2157 | 2168 | 504.3 |
| C | 14 | 238 | 356179 | 702.04 | 2157 | 2168 | 504.3 |
| C | 2 | 114 | 43990 | 82.94 | 2157 | 2168 | 504.3 |
| D | 8 | 195 | 6993147 | 14658.23 | 1991 | 1937 | 476.9 |
| D | 1 | 52 | 5246861 | 10996.85 | 1991 | 1937 | 476.9 |
| D | 13 | 104 | 2887888 | 6050.87 | 1991 | 1937 | 476.9 |
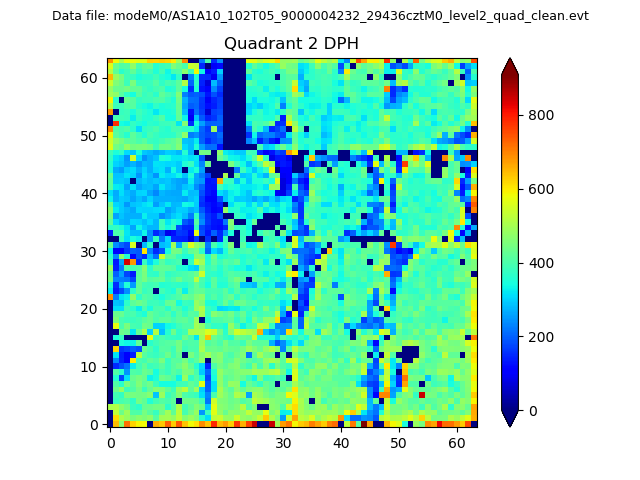
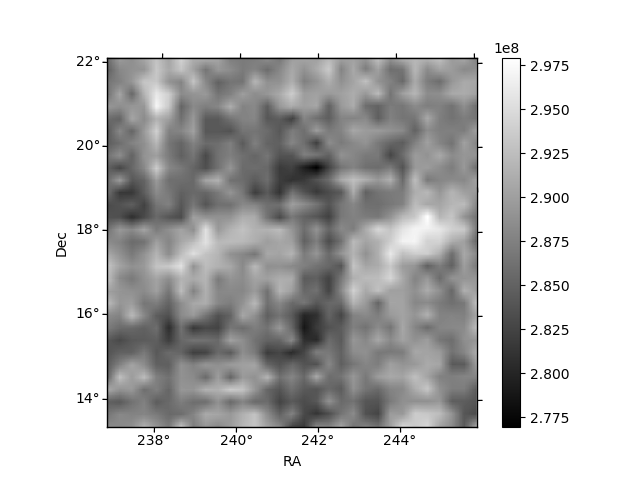
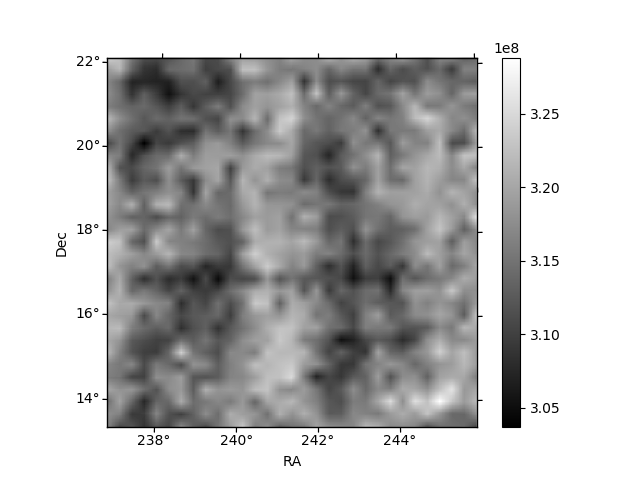
Histogram calculated using DETX and DETY for each event in the final _common_clean file
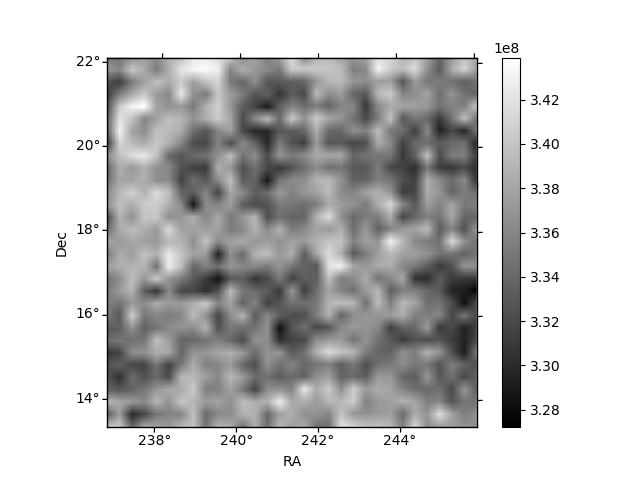
| Quadrant A |  |
 |
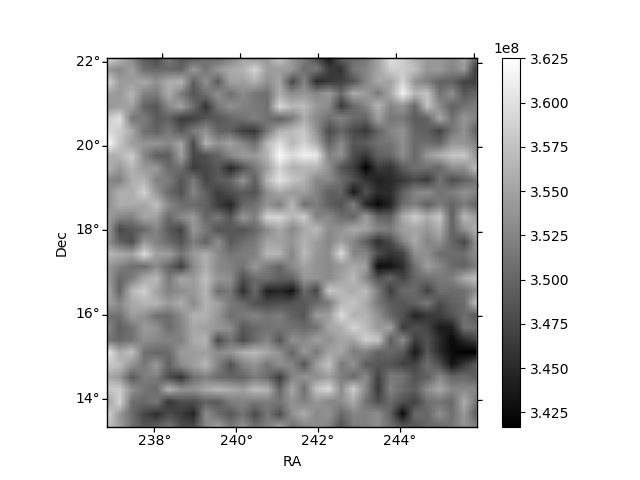
Quadrant B |
|---|---|---|---|
| Quadrant D |  |
 |
Quadrant C |
| Plot type | Count rate plots | Images |
|---|---|---|
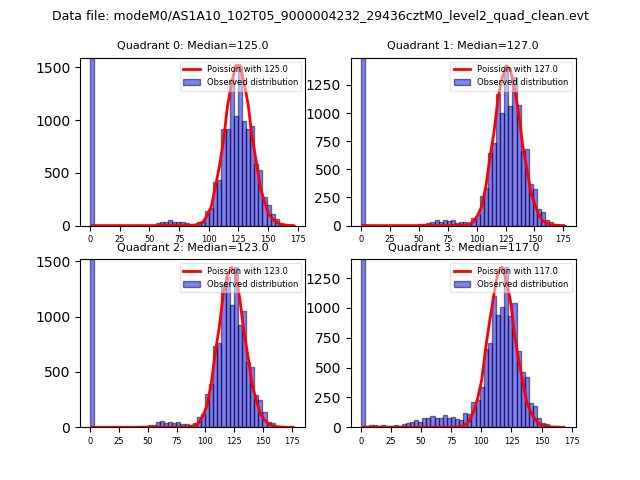
| Comparison with Poisson distribution Blue bars denote a histogram of data divided into 1 sec bins. Red curve is a Poisson curve with rate = median count rate of data. |
 |
 |
| Quadrant-wise count rates Data is divided into 100 sec bins |
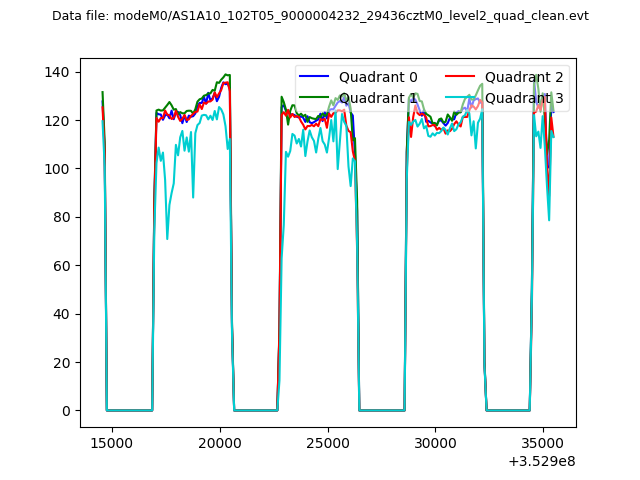 |
|
| Module-wise count rates for Quadrant A Data is divided into 100 sec bins |
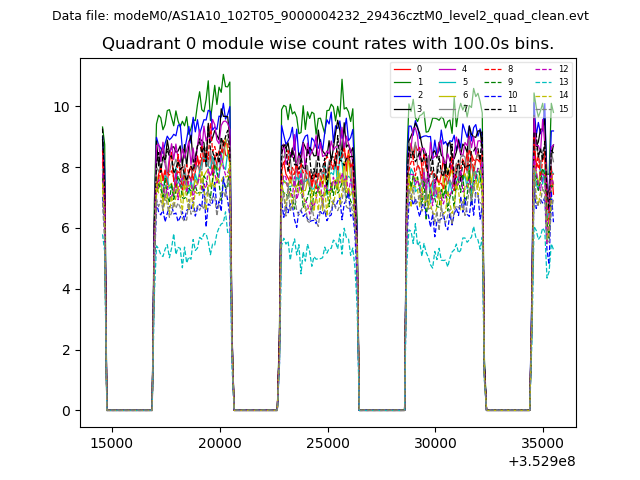 |
 |
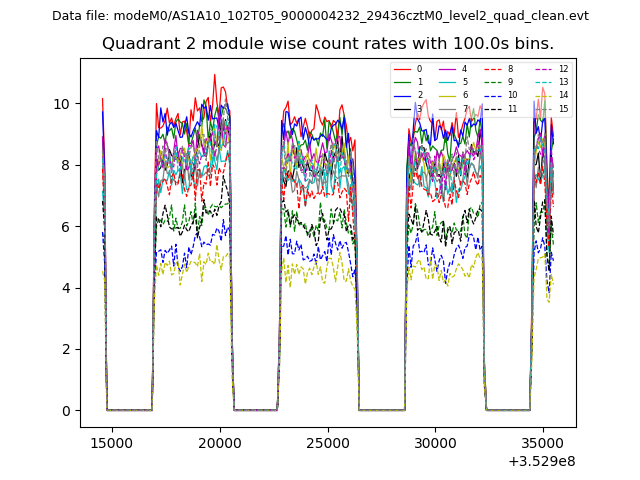
| Module-wise count rates for Quadrant B Data is divided into 100 sec bins |
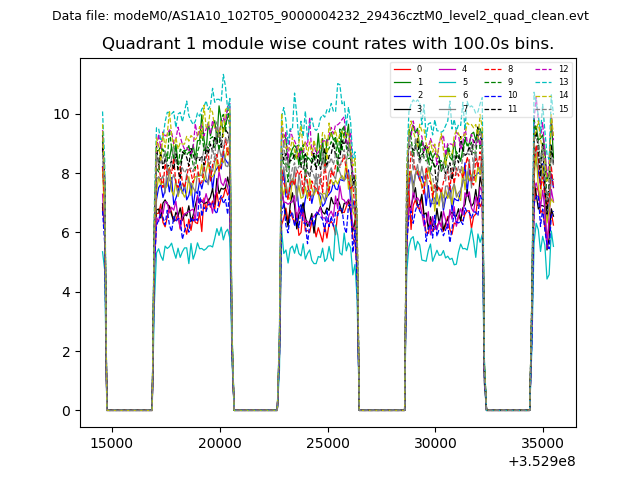 |
 |
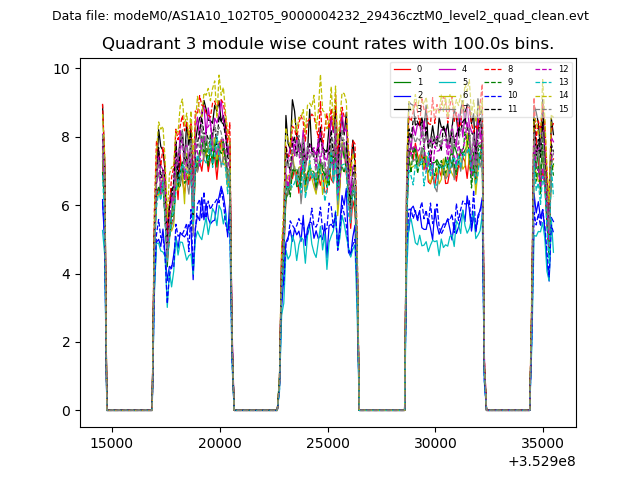
| Module-wise count rates for Quadrant C Data is divided into 100 sec bins |
 |
 |
| Module-wise count rates for Quadrant D Data is divided into 100 sec bins |
 |
 |
| Parameter | Plot |
|---|---|
| CZT HV Monitor | 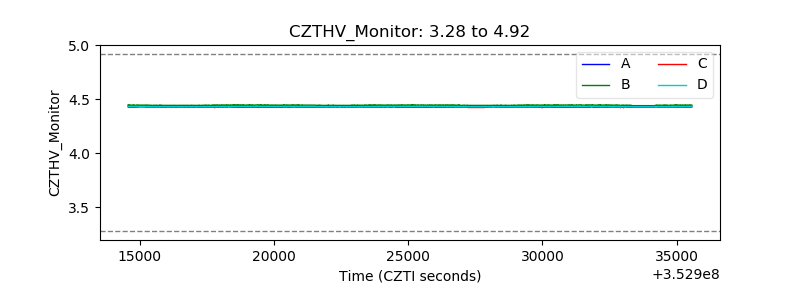 |
| D_VDD | 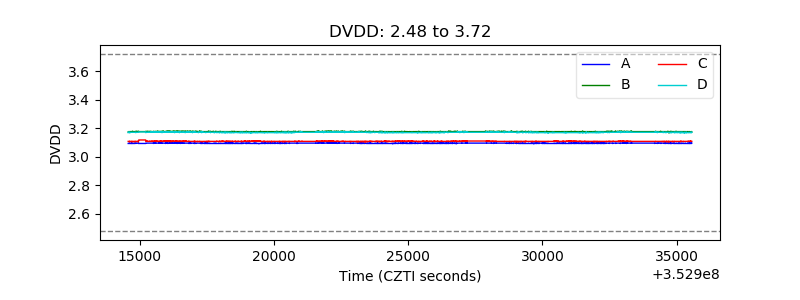 |
| Temperature 1 | 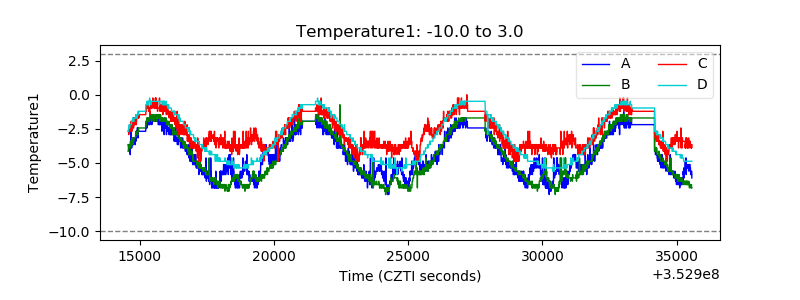 |
| Veto HV Monitor | 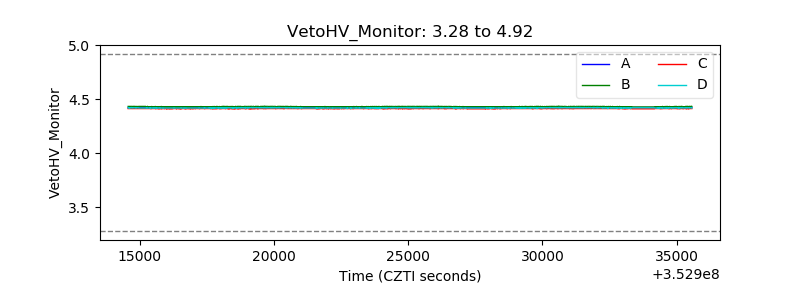 |
| Veto LLD | 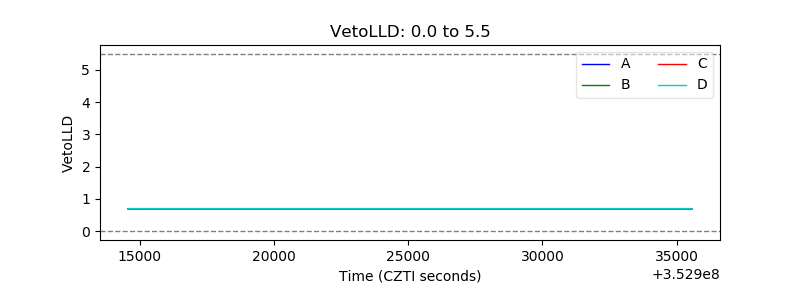 |
| Alpha Counter | 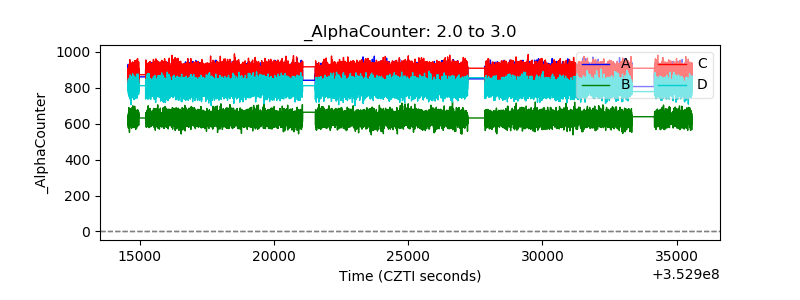 |
| _CPM_Rate | 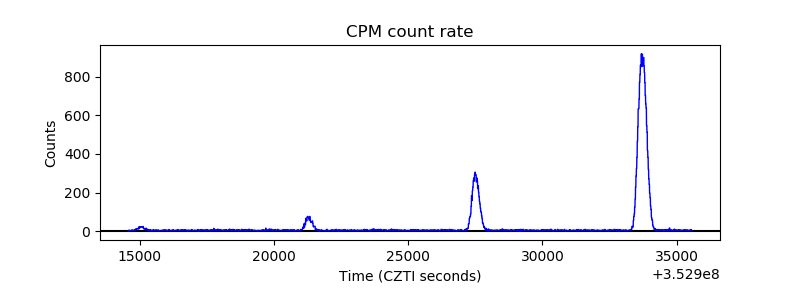 |
| CZT Counter | 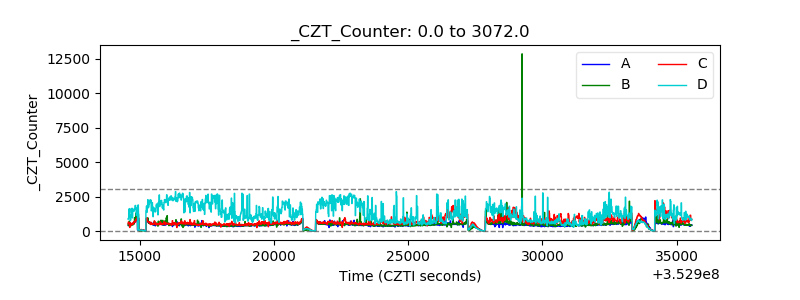 |
| +2.5 Volts monitor |  |
| +5 Volts monitor | 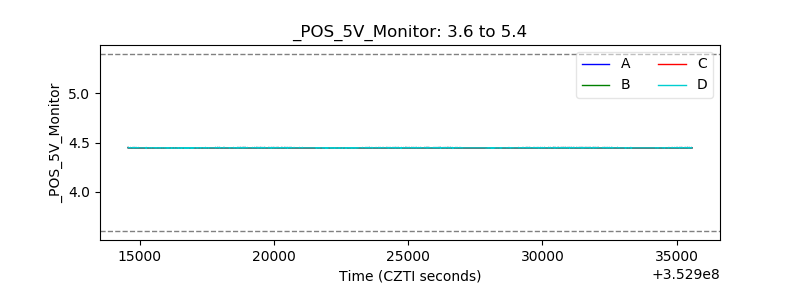 |
| _ROLL_ROT | 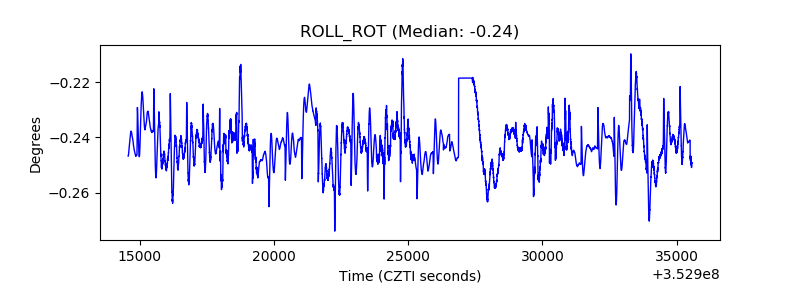 |
| _Roll_DEC | 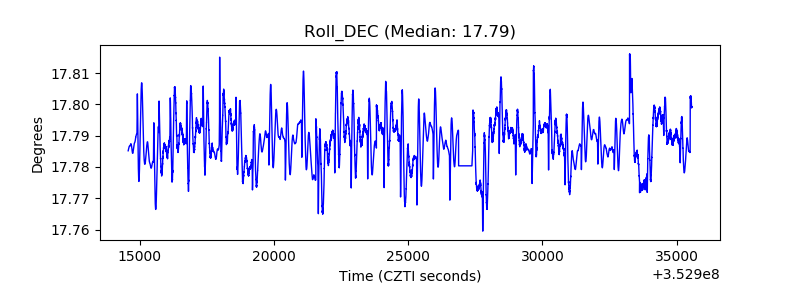 |
| _Roll_RA | 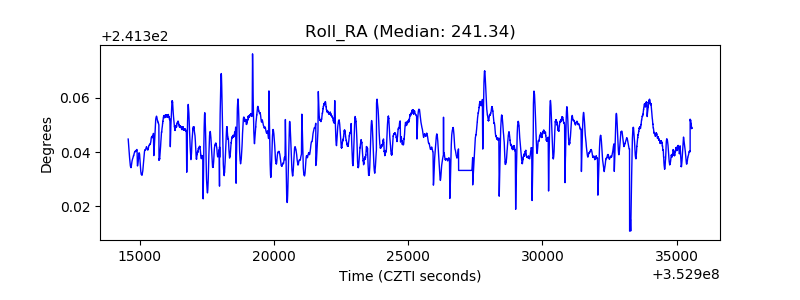 |
| Veto Counter | 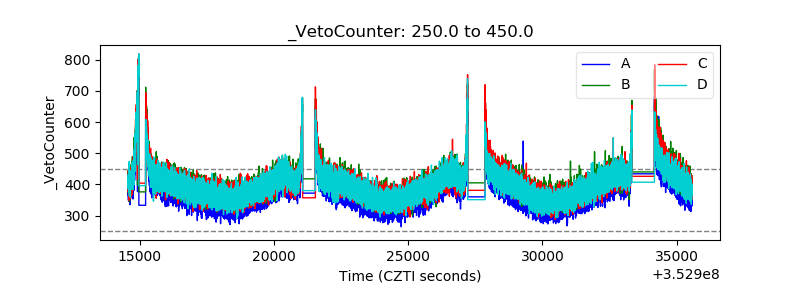 |