| Param | Original file | Final file |
|---|---|---|
| Filename | modeM0/AS1A10_102T05_9000004232_29439cztM0_level2.evt | modeM0/AS1A10_102T05_9000004232_29439cztM0_level2_quad_clean.evt |
| Size (bytes) | 361,261,440 | 50,063,040 |
| Size | 344.5 MB | 47.7 MB |
| Events in quadrant A | 1,839,620 | 318,973 |
| Events in quadrant B | 2,225,456 | 329,676 |
| Events in quadrant C | 3,235,128 | 310,318 |
| Events in quadrant D | 3,389,323 | 295,214 |
| Mode M9 | |||
|---|---|---|---|
| Quadrant | BADHDUFLAG | Total packets | Discarded packets |
| A | 0 | 10 | 0 |
| B | 0 | 10 | 0 |
| C | 0 | 10 | 0 |
| D | 0 | 10 | 0 |
| Mode SS | |||
|---|---|---|---|
| Quadrant | BADHDUFLAG | Total packets | Discarded packets |
| A | 0 | 76 | 0 |
| B | 0 | 76 | 0 |
| C | 0 | 76 | 0 |
| D | 0 | 76 | 0 |
| Mode M0 | |||
|---|---|---|---|
| Quadrant | BADHDUFLAG | Total packets | Discarded packets |
| A | 0 | 7740 | 1 |
| B | 0 | 8958 | 1 |
| C | 0 | 12241 | 1 |
| D | 0 | 12670 | 1 |
| Quadrant | Total seconds | Saturated seconds | Saturation percentage |
|---|---|---|---|
| A | 3696 | 18 | 0.487013% |
| B | 3696 | 78 | 2.110390% |
| C | 3697 | 196 | 5.301596% |
| D | 3697 | 308 | 8.331079% |
Noise dominated data is calculated using 1-second bins in cleaned event files. If a bin has >2000 counts, and if more than 50% of those come from <1% of pixels, then it is considered to be noise-dominated and hence unusable.
| Quadrant | # 1 sec bins | Bins with >0 counts | Bins with >2000 counts | High rate bins dominated by noise | Noise dominated (total time) | Noise dominated (detector-on time) | Marked lightcurve |
|---|---|---|---|---|---|---|---|
| A | 4696 | 3697 | 0 | 0 | 0.00% | 0.00% | 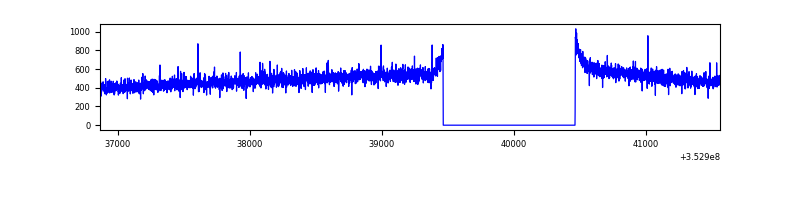 |
| B | 4696 | 3697 | 12 | 12 | 0.26% | 0.32% | 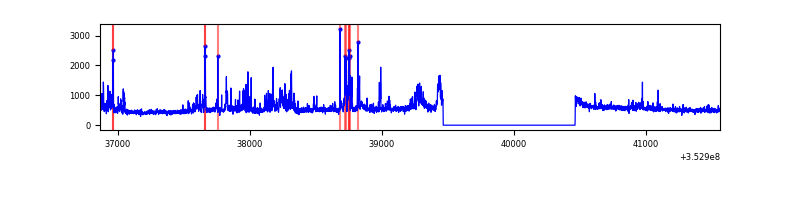 |
| C | 4697 | 3698 | 3 | 3 | 0.06% | 0.08% | 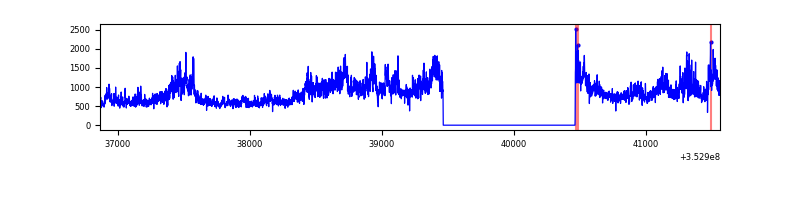 |
| D | 4697 | 3698 | 201 | 201 | 4.28% | 5.44% | 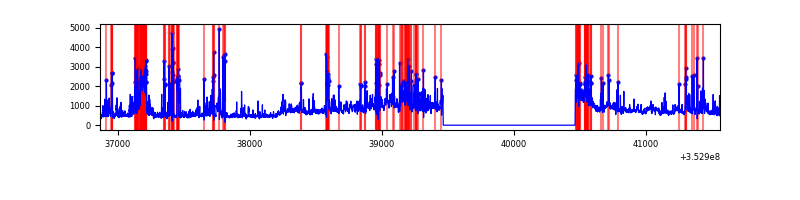 |
Top three noisy pixels from each quadrant. If the there are fewer than three noisy pixels in the level2.evt file, extra rows are filled as -1
| Pixel properties | Quadrant properties | ||||||
|---|---|---|---|---|---|---|---|
| Quadrant | DetID | PixID | Counts | Sigma | Mean | Median | Sigma |
| A | 13 | 254 | 6428 | 61.79 | 474 | 464 | 96.5 |
| A | 3 | 137 | 4742 | 44.32 | 474 | 464 | 96.5 |
| A | 1 | 113 | 4311 | 39.86 | 474 | 464 | 96.5 |
| B | 10 | 245 | 302880 | 3290.17 | 470 | 458 | 91.9 |
| B | 5 | 255 | 43893 | 472.55 | 470 | 458 | 91.9 |
| B | 0 | 190 | 14927 | 157.41 | 470 | 458 | 91.9 |
| C | 3 | 233 | 1398009 | 13164.4 | 450 | 451 | 106.2 |
| C | 14 | 238 | 72401 | 677.74 | 450 | 451 | 106.2 |
| C | 2 | 114 | 8811 | 78.75 | 450 | 451 | 106.2 |
| D | 1 | 52 | 524259 | 4812.69 | 448 | 437 | 108.8 |
| D | 13 | 104 | 457159 | 4196.2 | 448 | 437 | 108.8 |
| D | 13 | 153 | 288470 | 2646.35 | 448 | 437 | 108.8 |
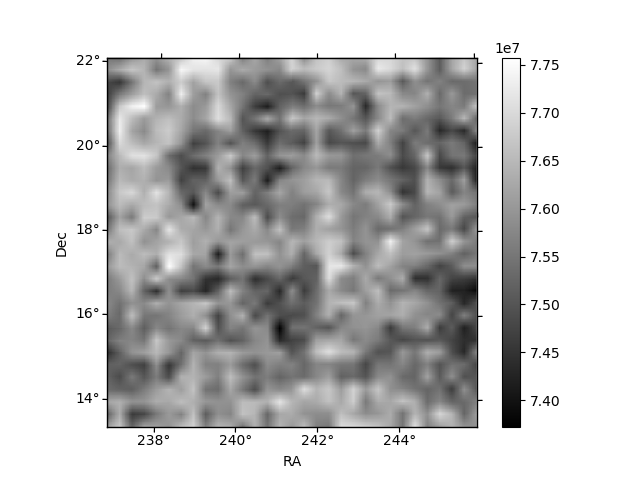
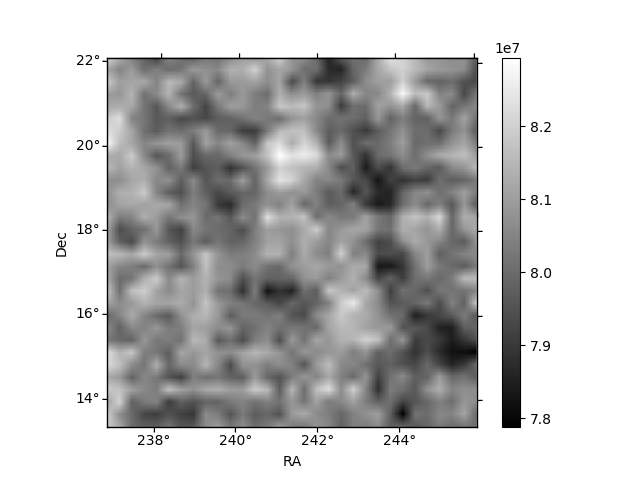
Histogram calculated using DETX and DETY for each event in the final _common_clean file
| Quadrant A |  |
 |
Quadrant B |
|---|---|---|---|
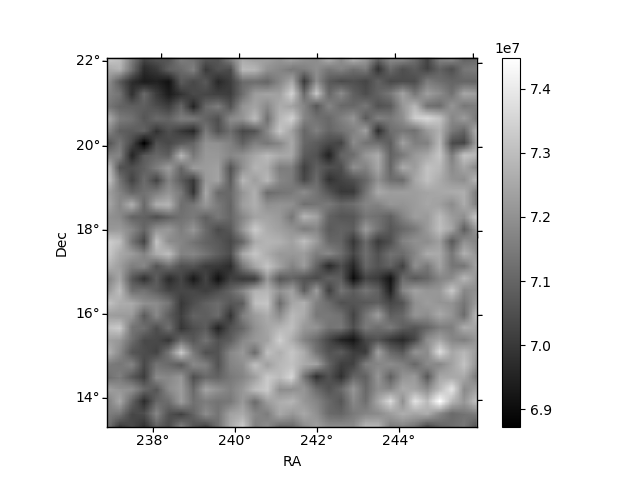
| Quadrant D |  |
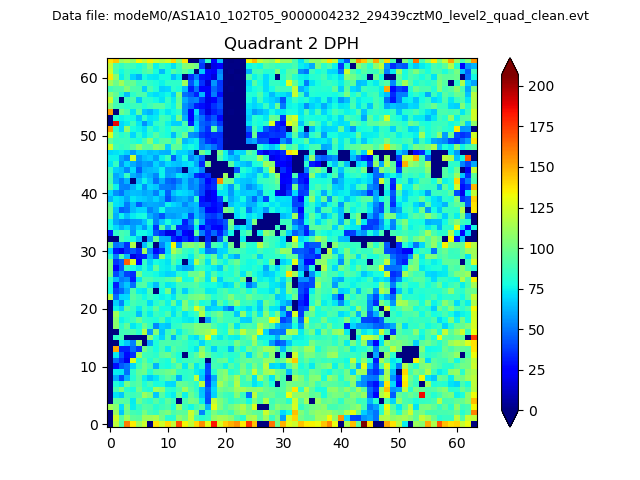 |
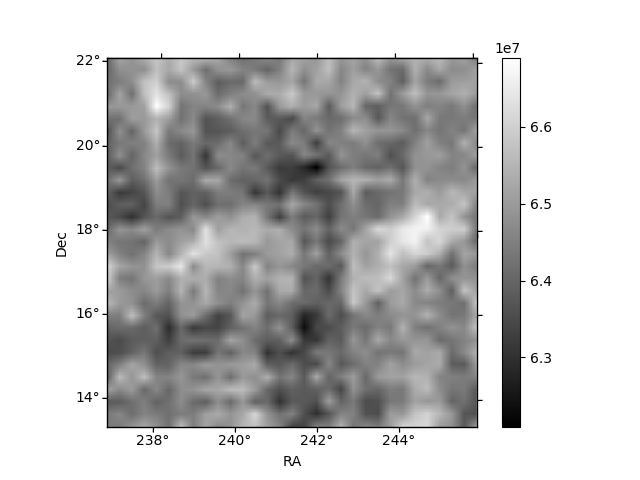
Quadrant C |
| Plot type | Count rate plots | Images |
|---|---|---|
| Comparison with Poisson distribution Blue bars denote a histogram of data divided into 1 sec bins. Red curve is a Poisson curve with rate = median count rate of data. |
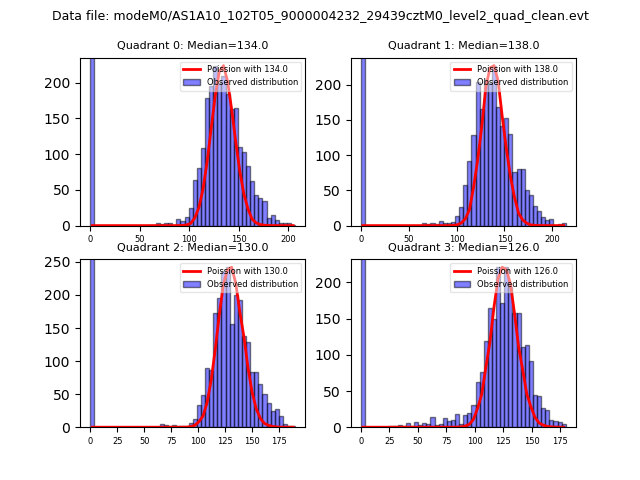 |
 |
| Quadrant-wise count rates Data is divided into 100 sec bins |
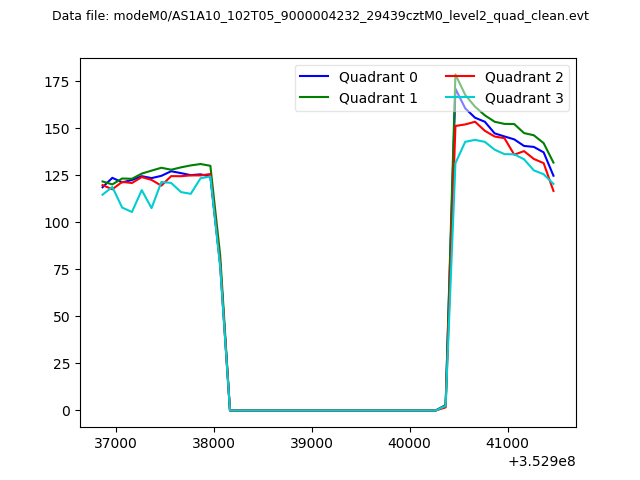 |
|
| Module-wise count rates for Quadrant A Data is divided into 100 sec bins |
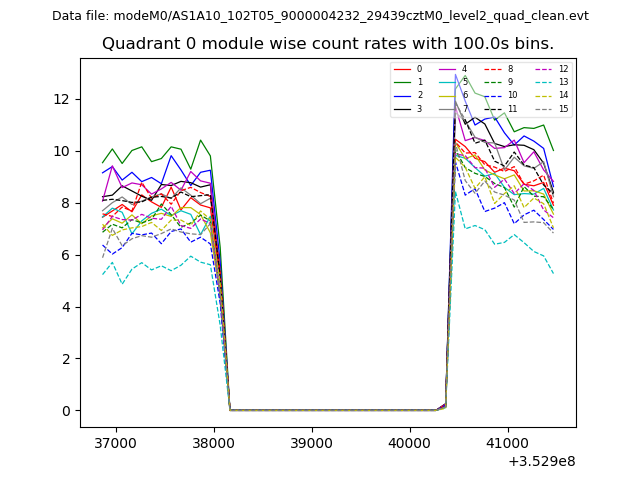 |
 |
| Module-wise count rates for Quadrant B Data is divided into 100 sec bins |
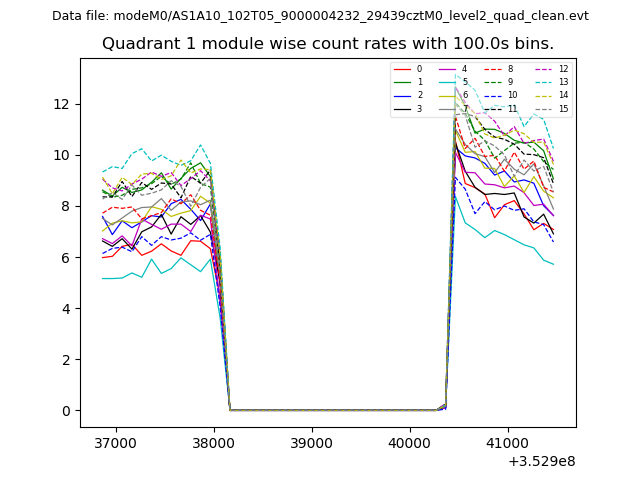 |
 |
| Module-wise count rates for Quadrant C Data is divided into 100 sec bins |
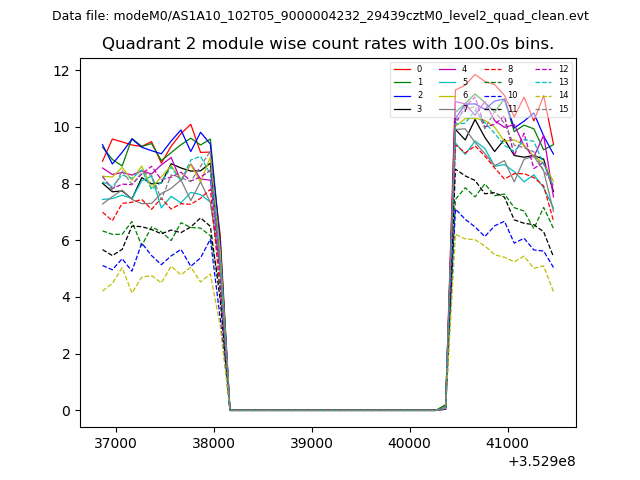 |
 |
| Module-wise count rates for Quadrant D Data is divided into 100 sec bins |
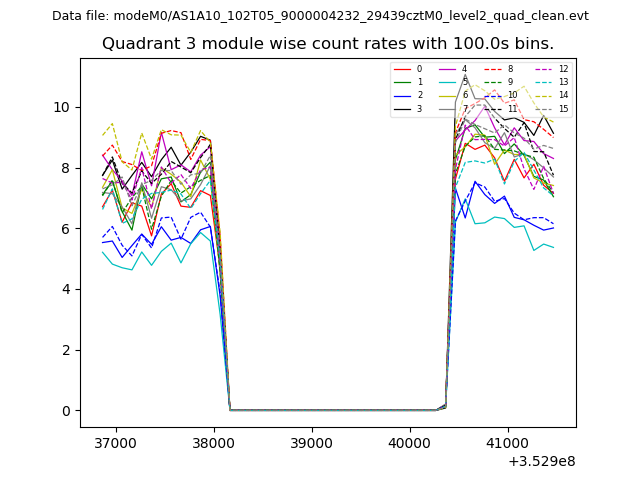 |
 |
| Parameter | Plot |
|---|---|
| CZT HV Monitor | 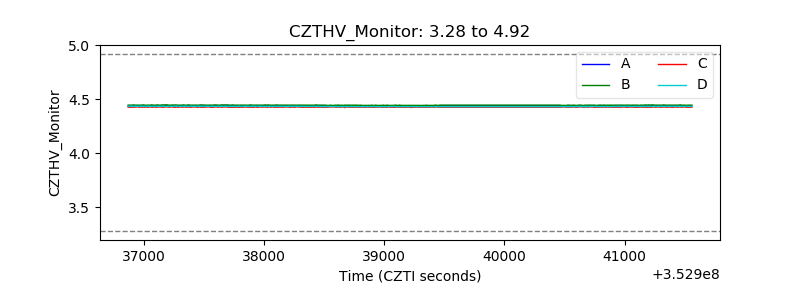 |
| D_VDD | 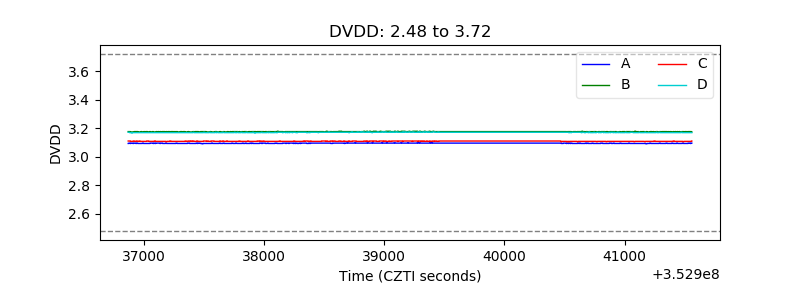 |
| Temperature 1 | 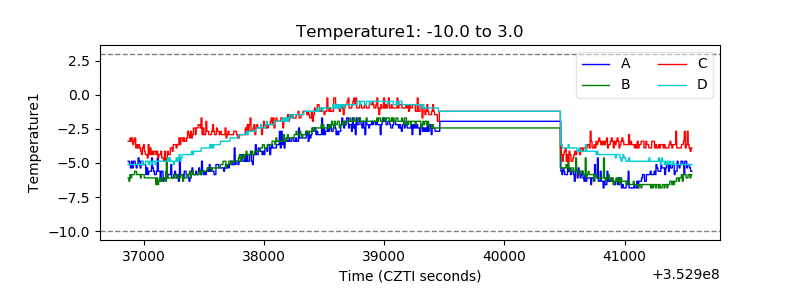 |
| Veto HV Monitor | 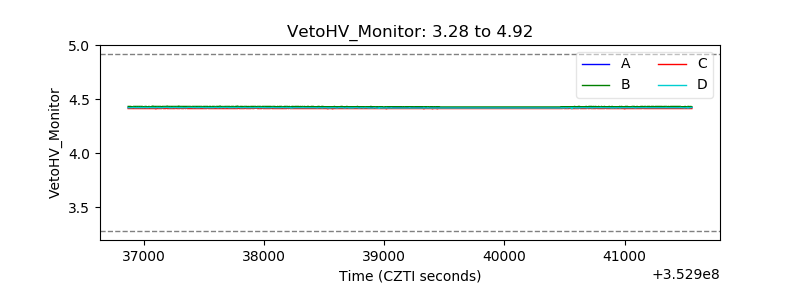 |
| Veto LLD |  |
| Alpha Counter | 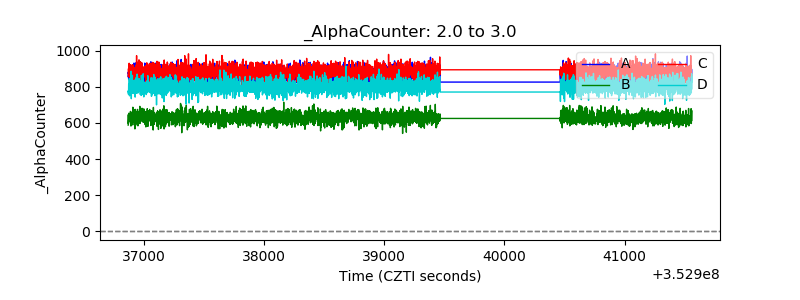 |
| _CPM_Rate | 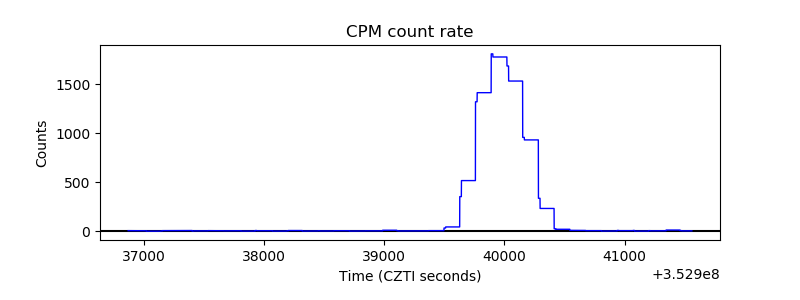 |
| CZT Counter | 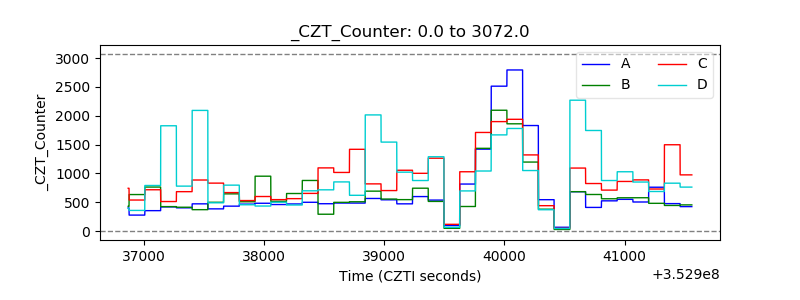 |
| +2.5 Volts monitor |  |
| +5 Volts monitor | 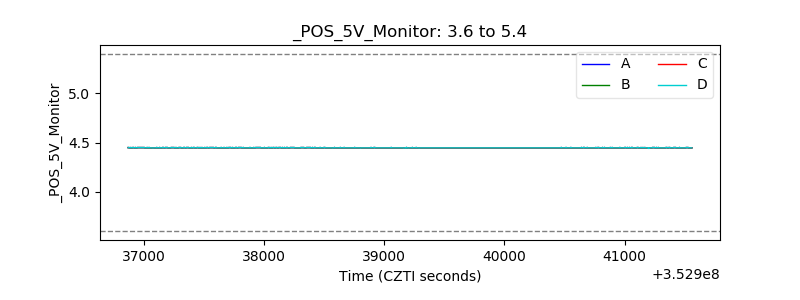 |
| _ROLL_ROT | 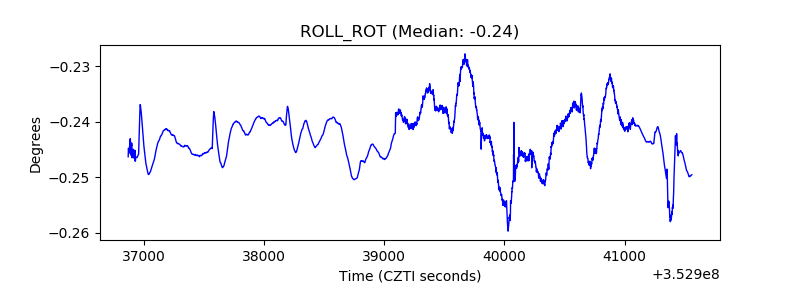 |
| _Roll_DEC | 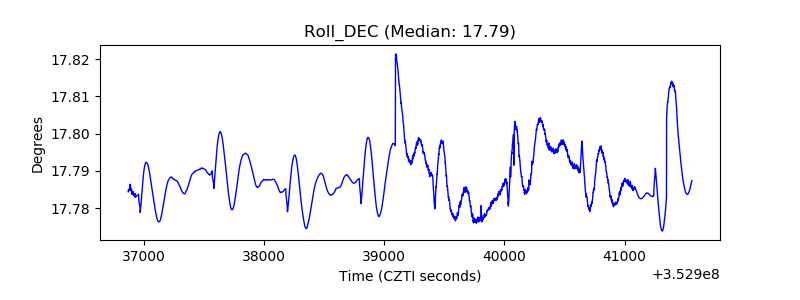 |
| _Roll_RA | 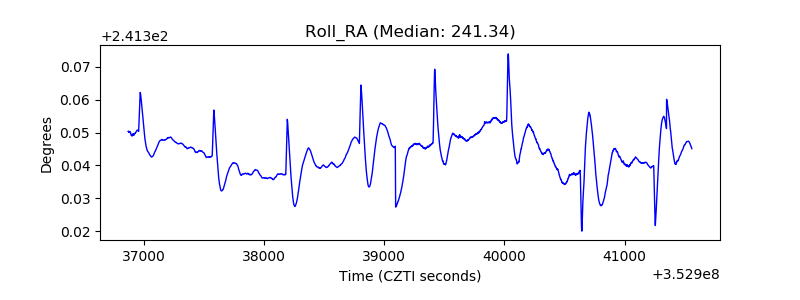 |
| Veto Counter | 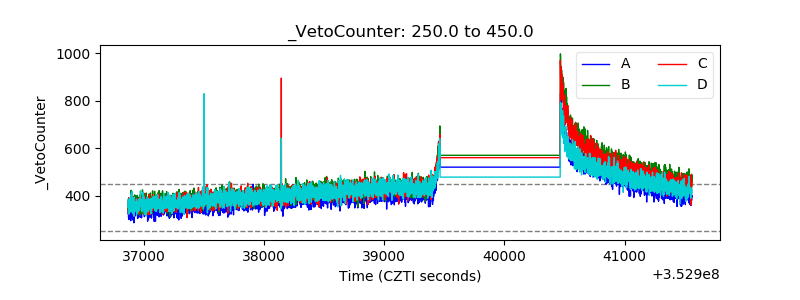 |