| Param | Original file | Final file |
|---|---|---|
| Filename | modeM0/AS1A10_110T02_9000004234_29439cztM0_level2.evt | modeM0/AS1A10_110T02_9000004234_29439cztM0_level2_quad_clean.evt |
| Size (bytes) | 519,589,440 | 63,601,920 |
| Size | 495.5 MB | 60.7 MB |
| Events in quadrant A | 2,498,390 | 403,588 |
| Events in quadrant B | 2,538,314 | 414,780 |
| Events in quadrant C | 6,362,131 | 368,603 |
| Events in quadrant D | 3,991,612 | 381,395 |
| Mode SS | |||
|---|---|---|---|
| Quadrant | BADHDUFLAG | Total packets | Discarded packets |
| A | 0 | 106 | 2 |
| B | 0 | 106 | 0 |
| C | 0 | 106 | 4 |
| D | 0 | 106 | 0 |
| Mode M0 | |||
|---|---|---|---|
| Quadrant | BADHDUFLAG | Total packets | Discarded packets |
| A | 0 | 10765 | 163 |
| B | 0 | 10870 | 175 |
| C | 0 | 23138 | 660 |
| D | 0 | 15517 | 183 |
| Mode M9 | |||
|---|---|---|---|
| Quadrant | BADHDUFLAG | Total packets | Discarded packets |
| A | 0 | 11 | 0 |
| B | 0 | 11 | 0 |
| C | 0 | 11 | 0 |
| D | 0 | 11 | 0 |
| Quadrant | Total seconds | Saturated seconds | Saturation percentage |
|---|---|---|---|
| A | 5113 | 35 | 0.684530% |
| B | 5110 | 39 | 0.763209% |
| C | 5047 | 947 | 18.763622% |
| D | 5111 | 167 | 3.267462% |
Noise dominated data is calculated using 1-second bins in cleaned event files. If a bin has >2000 counts, and if more than 50% of those come from <1% of pixels, then it is considered to be noise-dominated and hence unusable.
| Quadrant | # 1 sec bins | Bins with >0 counts | Bins with >2000 counts | High rate bins dominated by noise | Noise dominated (total time) | Noise dominated (detector-on time) | Marked lightcurve |
|---|---|---|---|---|---|---|---|
| A | 6317 | 5185 | 0 | 0 | 0.00% | 0.00% | 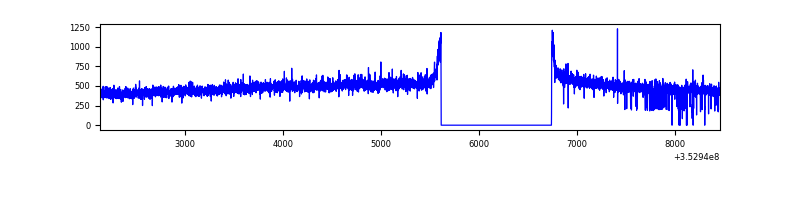 |
| B | 6317 | 5176 | 0 | 0 | 0.00% | 0.00% | 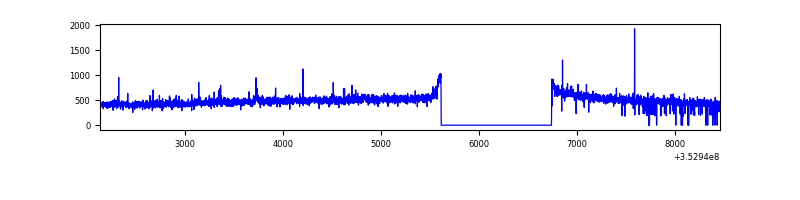 |
| C | 6315 | 5163 | 375 | 375 | 5.94% | 7.26% | 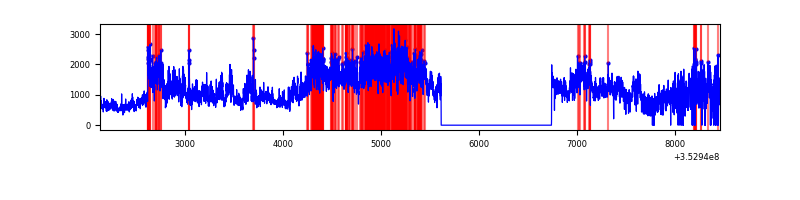 |
| D | 6316 | 5184 | 95 | 95 | 1.50% | 1.83% | 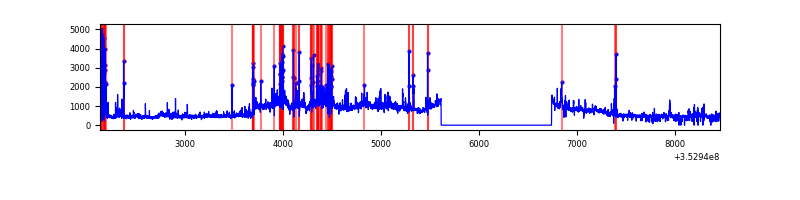 |
Top three noisy pixels from each quadrant. If the there are fewer than three noisy pixels in the level2.evt file, extra rows are filled as -1
| Pixel properties | Quadrant properties | ||||||
|---|---|---|---|---|---|---|---|
| Quadrant | DetID | PixID | Counts | Sigma | Mean | Median | Sigma |
| A | 13 | 254 | 9519 | 68.32 | 645 | 633 | 130.1 |
| A | 3 | 137 | 6096 | 42.0 | 645 | 633 | 130.1 |
| A | 0 | 226 | 5594 | 38.14 | 645 | 633 | 130.1 |
| B | 12 | 111 | 14815 | 116.17 | 640 | 625 | 122.1 |
| B | 11 | 111 | 13698 | 107.03 | 640 | 625 | 122.1 |
| B | 14 | 111 | 12629 | 98.27 | 640 | 625 | 122.1 |
| C | 3 | 233 | 3979122 | 29347.13 | 581 | 585 | 135.6 |
| C | 14 | 238 | 96386 | 706.66 | 581 | 585 | 135.6 |
| C | 2 | 114 | 11334 | 79.29 | 581 | 585 | 135.6 |
| D | 13 | 104 | 857619 | 5831.71 | 613 | 597 | 147.0 |
| D | 1 | 52 | 441624 | 3001.02 | 613 | 597 | 147.0 |
| D | 8 | 195 | 168204 | 1140.5 | 613 | 597 | 147.0 |
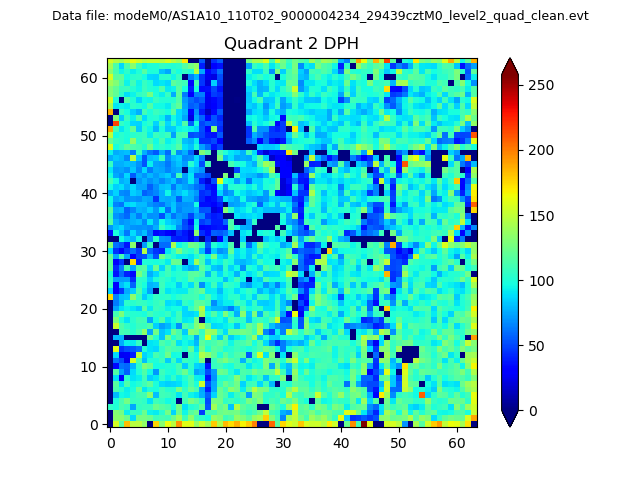
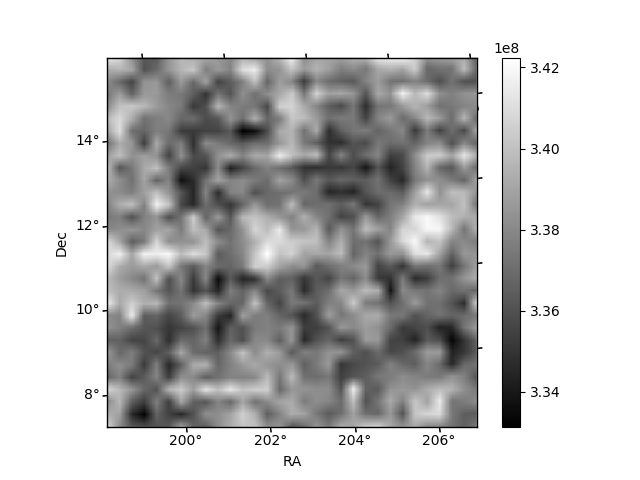
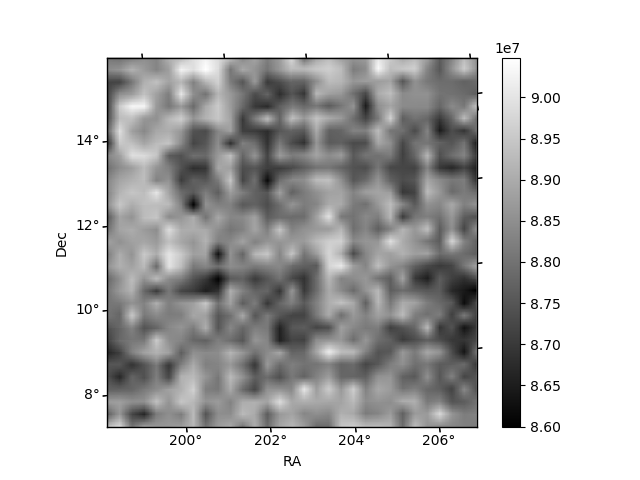
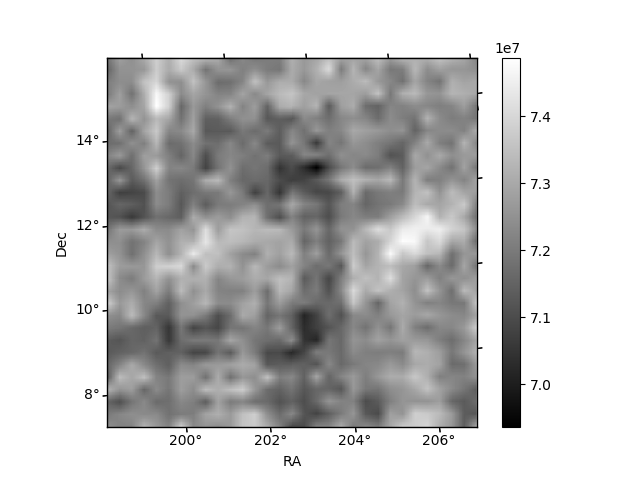
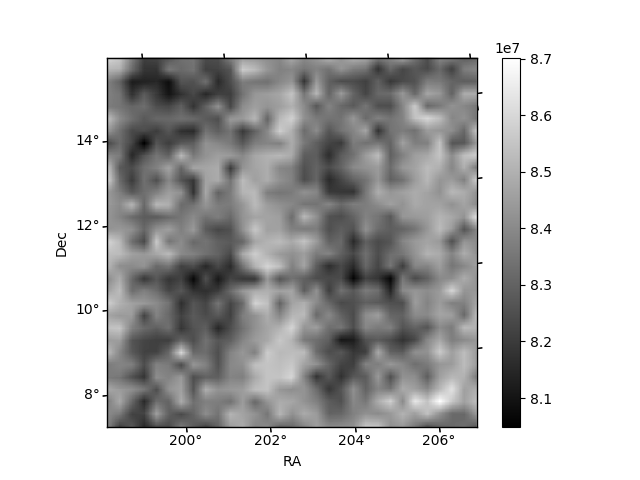
Histogram calculated using DETX and DETY for each event in the final _common_clean file
| Quadrant A | 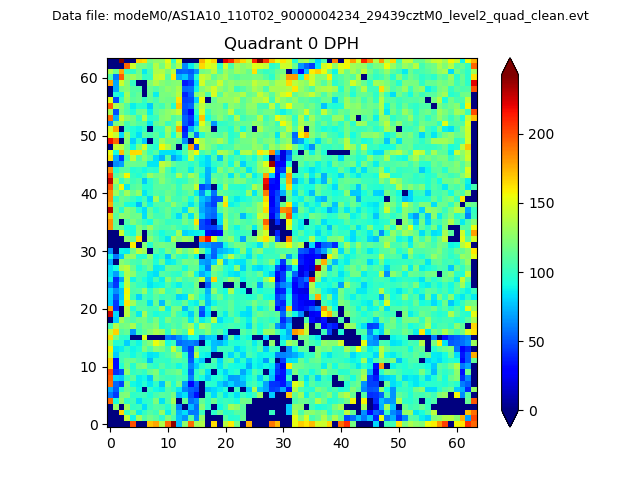 |
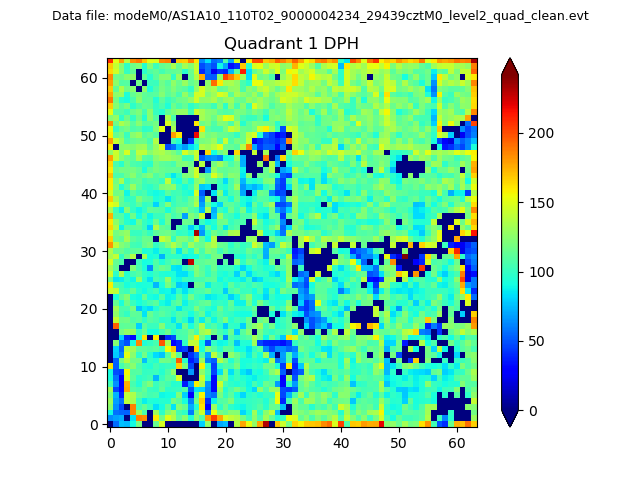 |
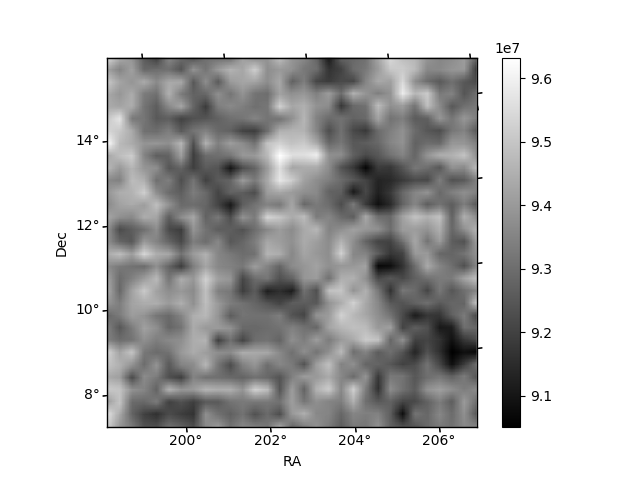
Quadrant B |
|---|---|---|---|
| Quadrant D | 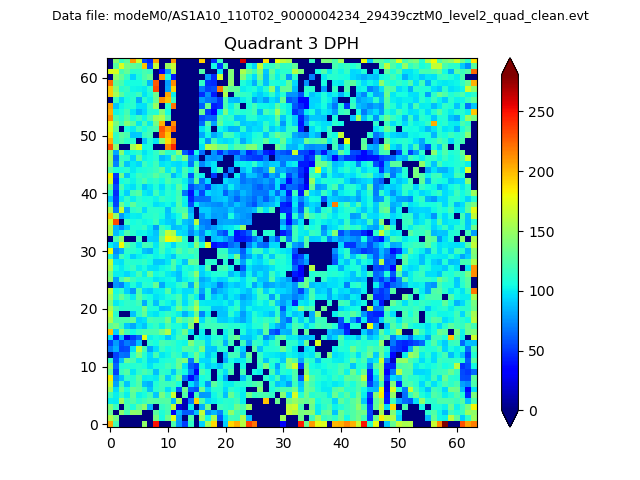 |
 |
Quadrant C |
| Plot type | Count rate plots | Images |
|---|---|---|
| Comparison with Poisson distribution Blue bars denote a histogram of data divided into 1 sec bins. Red curve is a Poisson curve with rate = median count rate of data. |
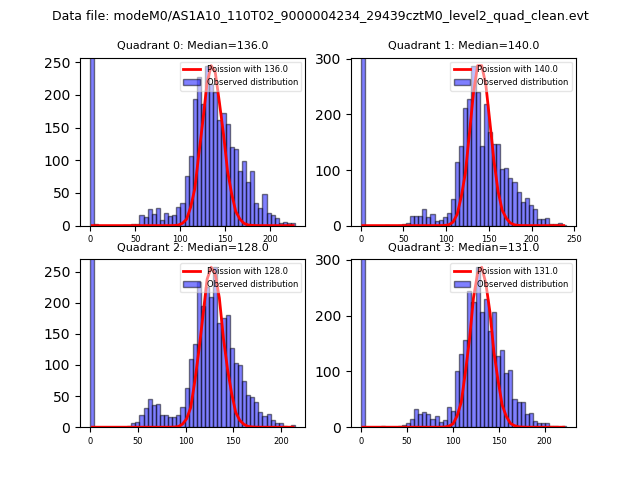 |
 |
| Quadrant-wise count rates Data is divided into 100 sec bins |
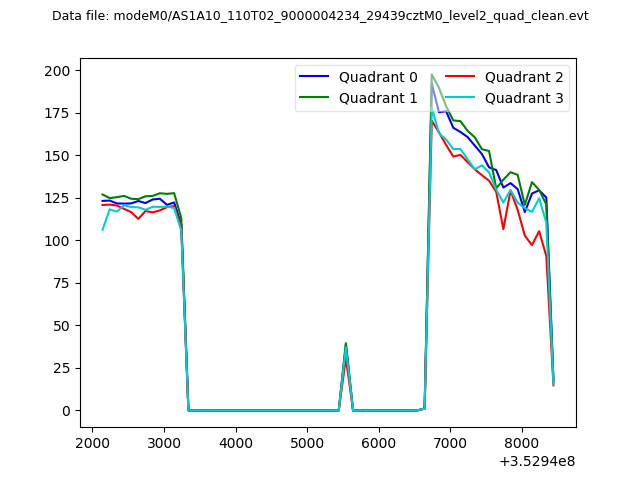 |
|
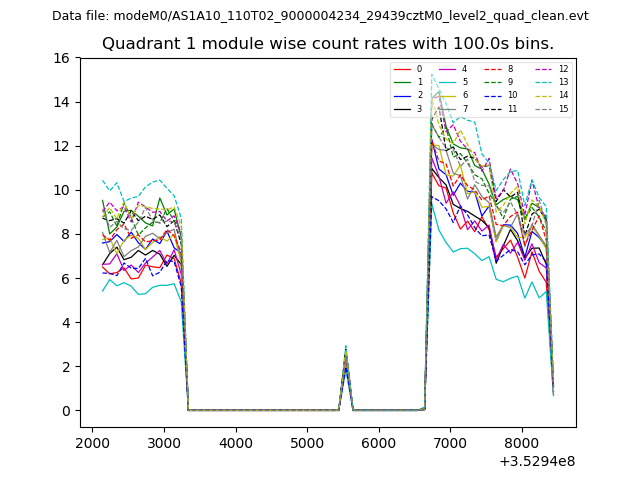
| Module-wise count rates for Quadrant A Data is divided into 100 sec bins |
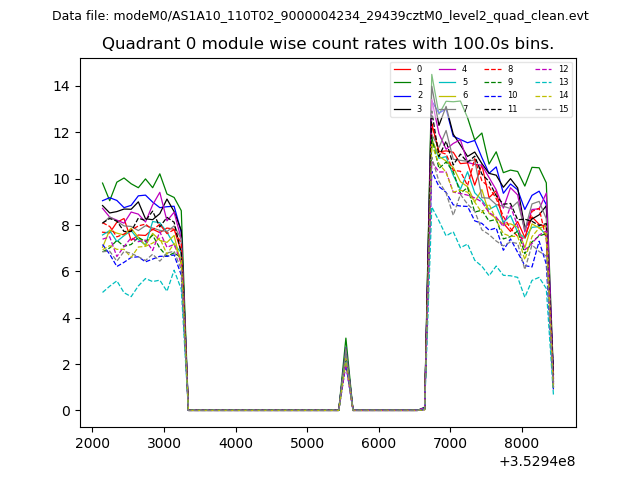 |
 |
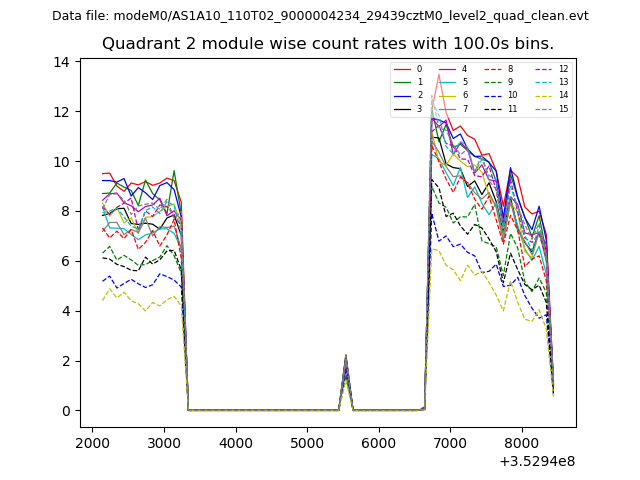
| Module-wise count rates for Quadrant B Data is divided into 100 sec bins |
 |
 |
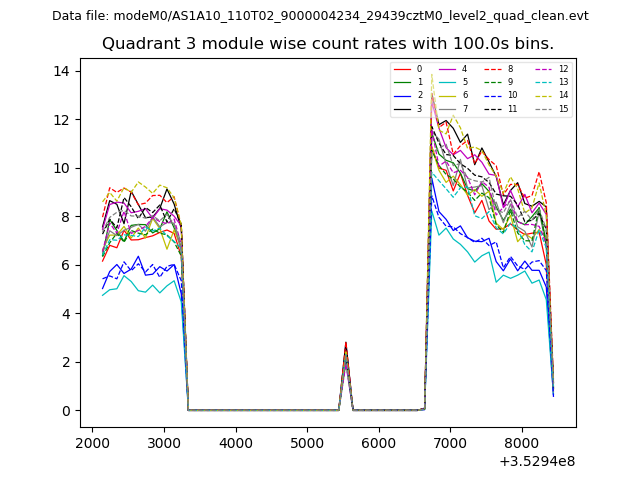
| Module-wise count rates for Quadrant C Data is divided into 100 sec bins |
 |
 |
| Module-wise count rates for Quadrant D Data is divided into 100 sec bins |
 |
 |
| Parameter | Plot |
|---|---|
| CZT HV Monitor | 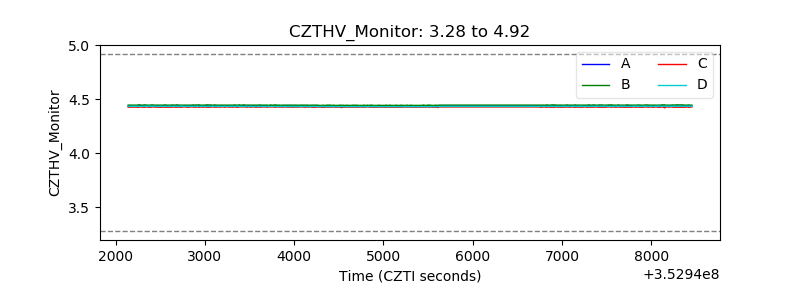 |
| D_VDD | 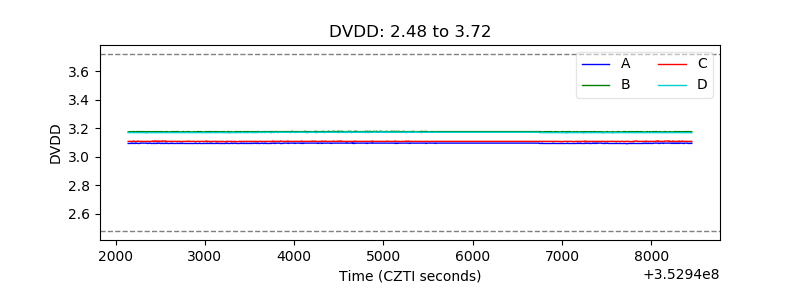 |
| Temperature 1 | 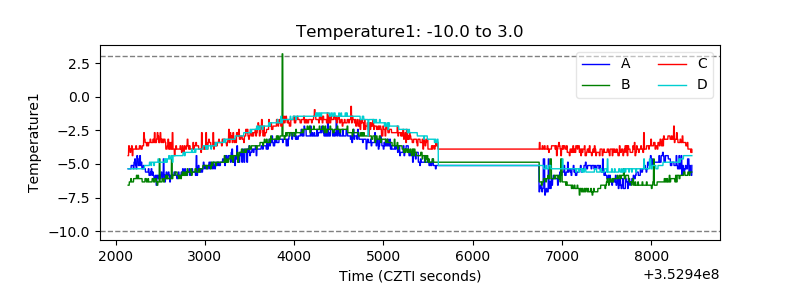 |
| Veto HV Monitor | 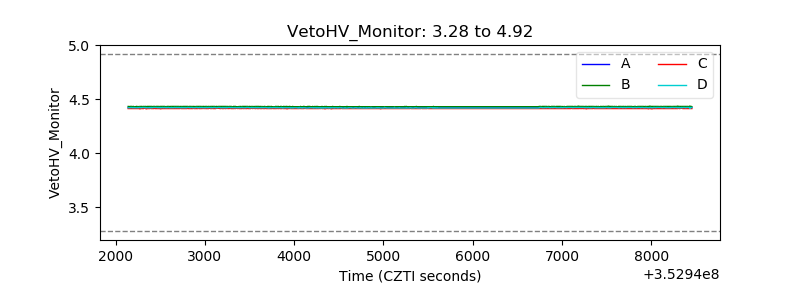 |
| Veto LLD | 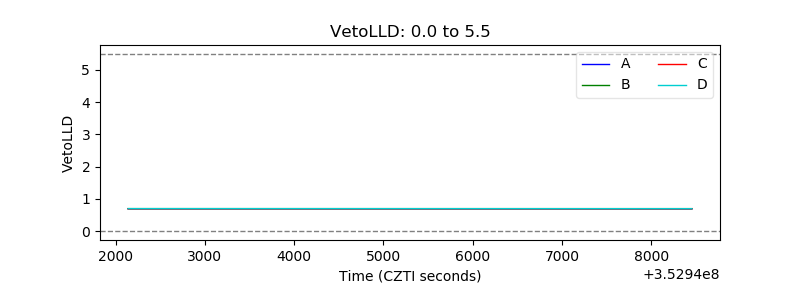 |
| Alpha Counter | 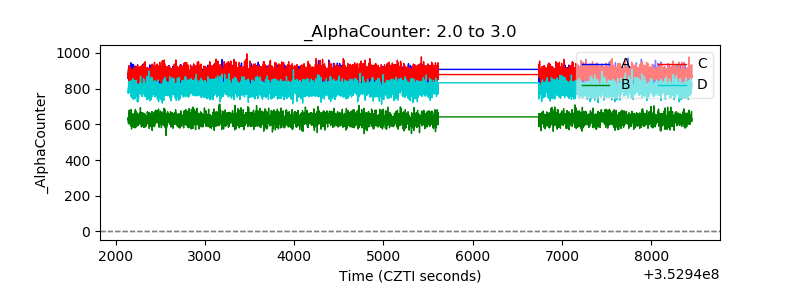 |
| _CPM_Rate | 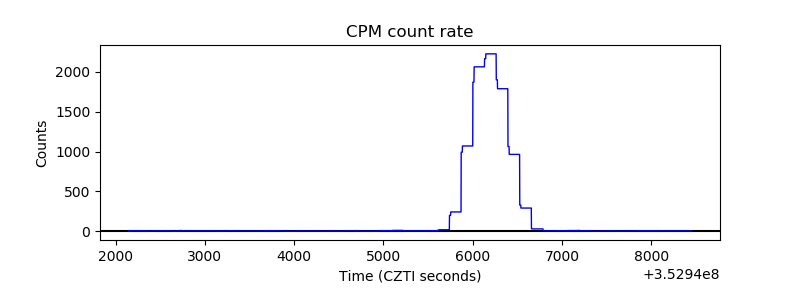 |
| CZT Counter | 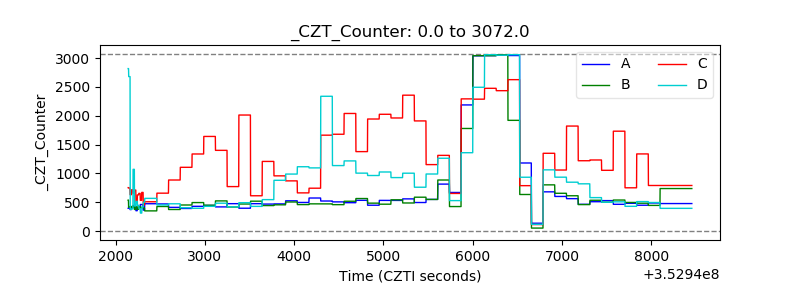 |
| +2.5 Volts monitor |  |
| +5 Volts monitor |  |
| _ROLL_ROT | 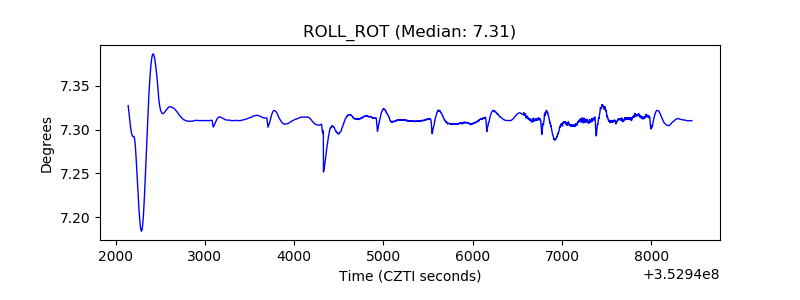 |
| _Roll_DEC | 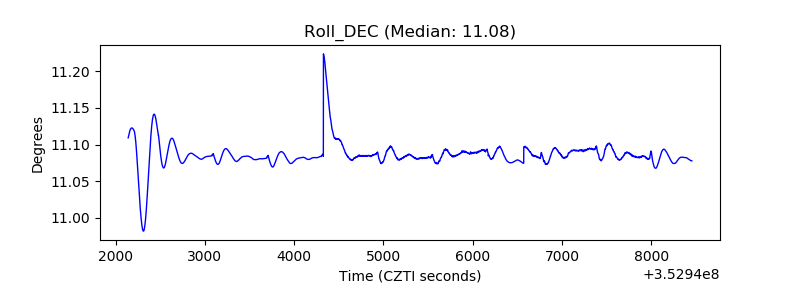 |
| _Roll_RA | 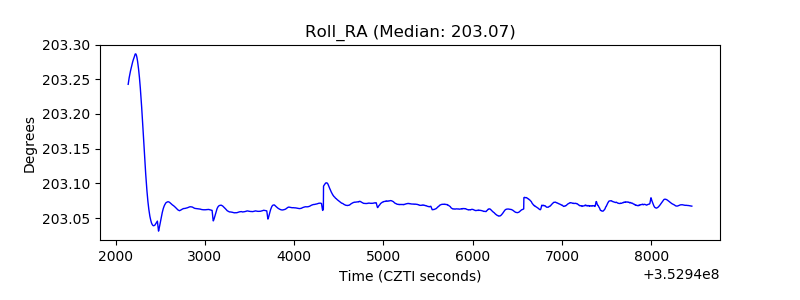 |
| Veto Counter | 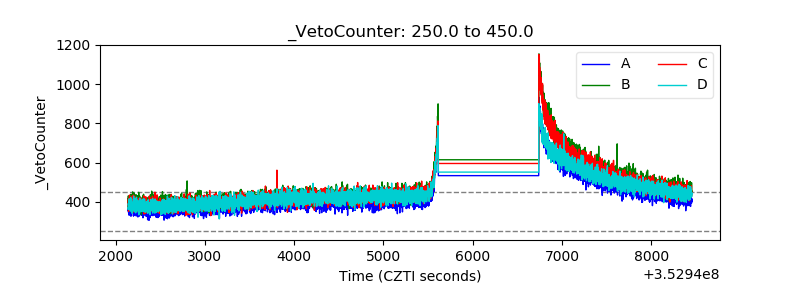 |