| Param | Original file | Final file |
|---|---|---|
| Filename | modeM0/AS1A10_110T02_9000004234_29441cztM0_level2.evt | modeM0/AS1A10_110T02_9000004234_29441cztM0_level2_quad_clean.evt |
| Size (bytes) | 650,494,080 | 105,554,880 |
| Size | 620.4 MB | 100.7 MB |
| Events in quadrant A | 3,534,155 | 717,713 |
| Events in quadrant B | 3,615,828 | 727,949 |
| Events in quadrant C | 7,236,930 | 630,581 |
| Events in quadrant D | 4,871,770 | 665,024 |
| Mode SS | |||
|---|---|---|---|
| Quadrant | BADHDUFLAG | Total packets | Discarded packets |
| A | 0 | 132 | 0 |
| B | 0 | 132 | 0 |
| C | 0 | 132 | 0 |
| D | 0 | 132 | 0 |
| Mode M0 | |||
|---|---|---|---|
| Quadrant | BADHDUFLAG | Total packets | Discarded packets |
| A | 0 | 14187 | 2 |
| B | 0 | 14519 | 2 |
| C | 0 | 26175 | 2 |
| D | 0 | 18939 | 2 |
| Mode M9 | |||
|---|---|---|---|
| Quadrant | BADHDUFLAG | Total packets | Discarded packets |
| A | 0 | 16 | 0 |
| B | 0 | 16 | 0 |
| C | 0 | 17 | 0 |
| D | 0 | 17 | 0 |
| Quadrant | Total seconds | Saturated seconds | Saturation percentage |
|---|---|---|---|
| A | 6531 | 65 | 0.995253% |
| B | 6530 | 78 | 1.194487% |
| C | 6530 | 1553 | 23.782542% |
| D | 6530 | 214 | 3.277182% |
Noise dominated data is calculated using 1-second bins in cleaned event files. If a bin has >2000 counts, and if more than 50% of those come from <1% of pixels, then it is considered to be noise-dominated and hence unusable.
| Quadrant | # 1 sec bins | Bins with >0 counts | Bins with >2000 counts | High rate bins dominated by noise | Noise dominated (total time) | Noise dominated (detector-on time) | Marked lightcurve |
|---|---|---|---|---|---|---|---|
| A | 7816 | 6532 | 0 | 0 | 0.00% | 0.00% | 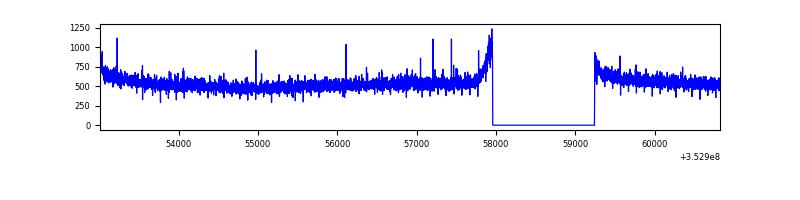 |
| B | 7815 | 6531 | 3 | 3 | 0.04% | 0.05% | 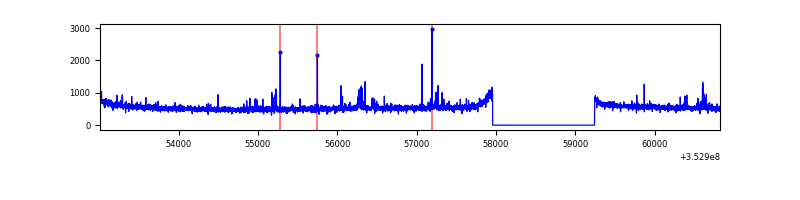 |
| C | 7815 | 6531 | 107 | 107 | 1.37% | 1.64% | 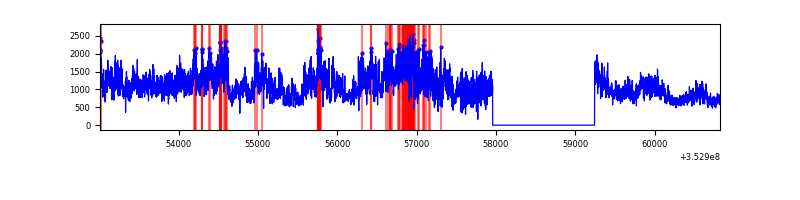 |
| D | 7815 | 6531 | 127 | 127 | 1.63% | 1.94% | 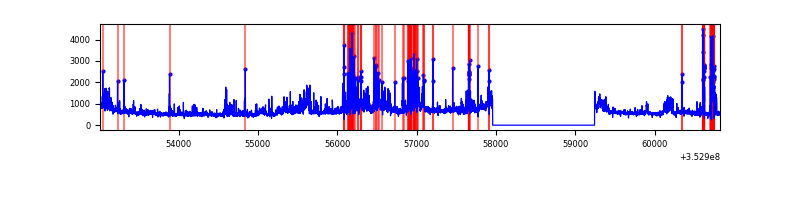 |
Top three noisy pixels from each quadrant. If the there are fewer than three noisy pixels in the level2.evt file, extra rows are filled as -1
| Pixel properties | Quadrant properties | ||||||
|---|---|---|---|---|---|---|---|
| Quadrant | DetID | PixID | Counts | Sigma | Mean | Median | Sigma |
| A | 1 | 113 | 14752 | 76.84 | 911 | 897 | 180.3 |
| A | 13 | 254 | 12560 | 64.68 | 911 | 897 | 180.3 |
| A | 5 | 98 | 8657 | 43.04 | 911 | 897 | 180.3 |
| B | 10 | 245 | 57018 | 338.44 | 892 | 874 | 165.9 |
| B | 12 | 111 | 19809 | 114.14 | 892 | 874 | 165.9 |
| B | 0 | 229 | 19724 | 113.63 | 892 | 874 | 165.9 |
| C | 3 | 233 | 3516984 | 20092.35 | 767 | 775 | 175.0 |
| C | 14 | 254 | 359060 | 2047.32 | 767 | 775 | 175.0 |
| C | 14 | 238 | 351411 | 2003.61 | 767 | 775 | 175.0 |
| D | 1 | 52 | 851095 | 4198.3 | 863 | 843 | 202.5 |
| D | 8 | 195 | 329602 | 1623.32 | 863 | 843 | 202.5 |
| D | 13 | 104 | 230757 | 1135.25 | 863 | 843 | 202.5 |
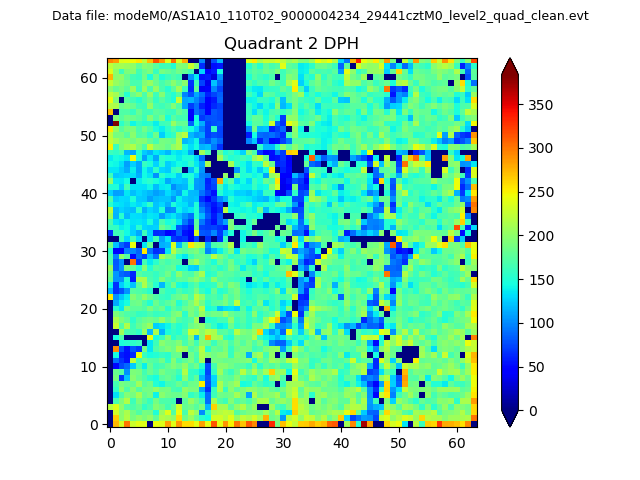
Histogram calculated using DETX and DETY for each event in the final _common_clean file
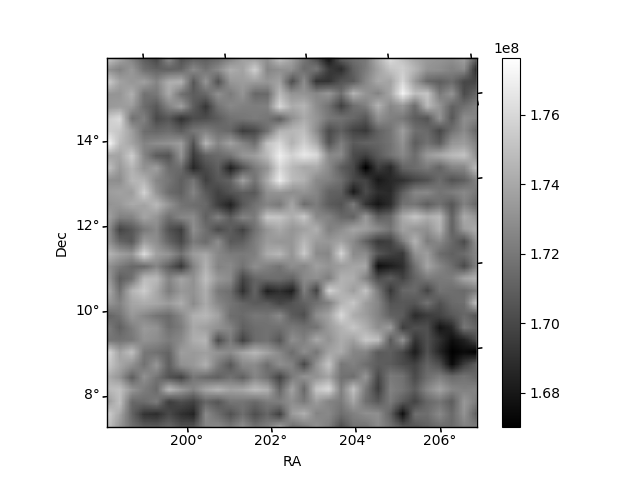
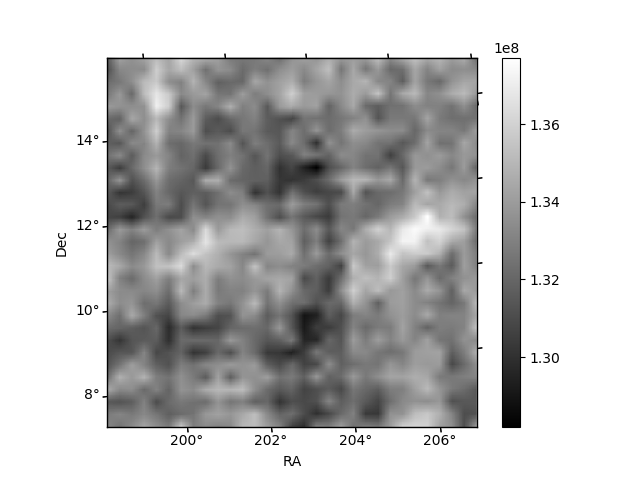
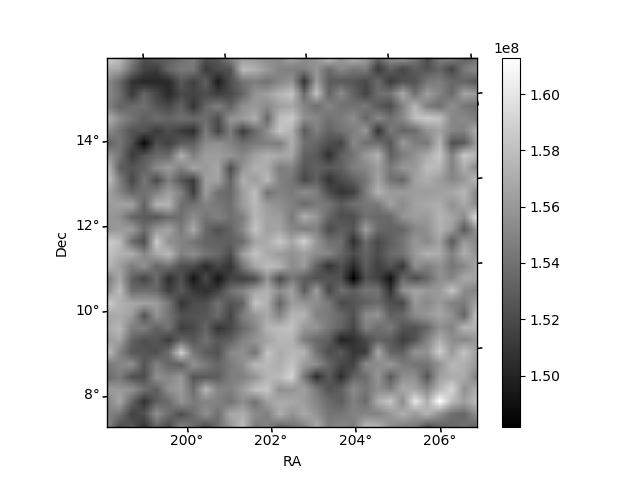
| Quadrant A | 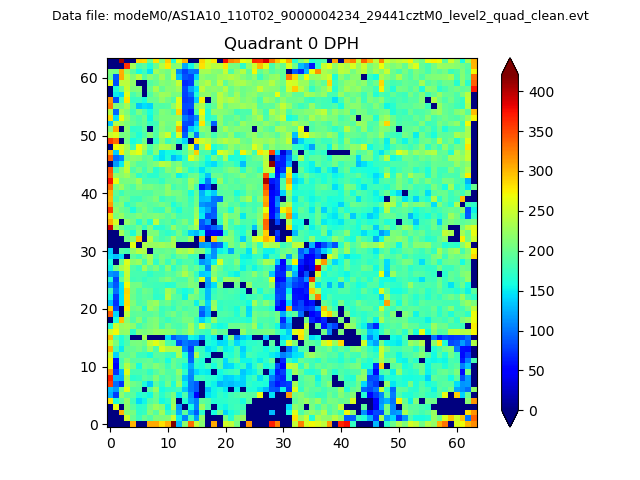 |
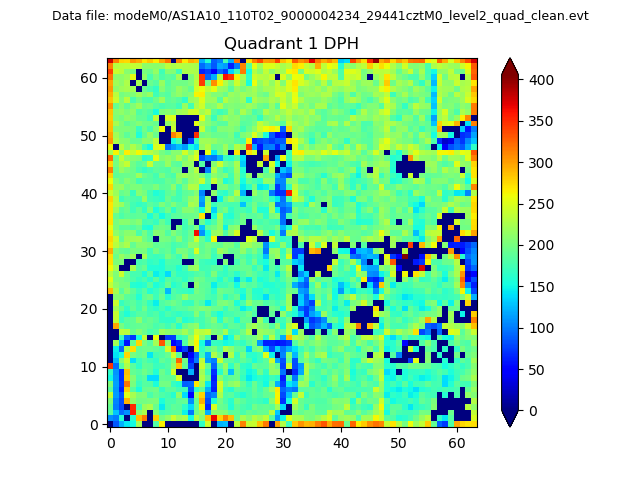 |
Quadrant B |
|---|---|---|---|
| Quadrant D | 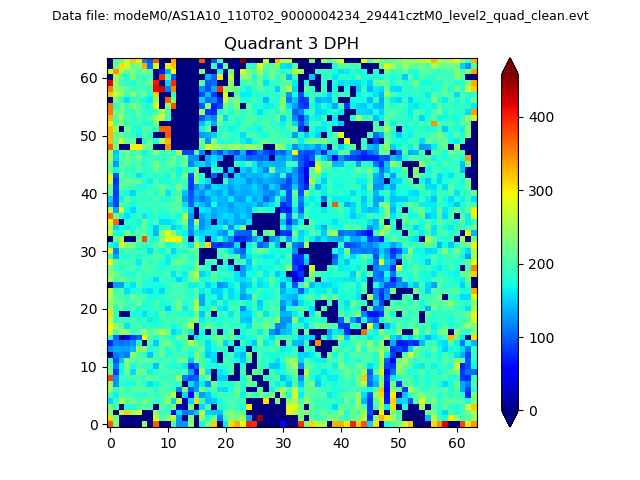 |
 |
Quadrant C |
| Plot type | Count rate plots | Images |
|---|---|---|
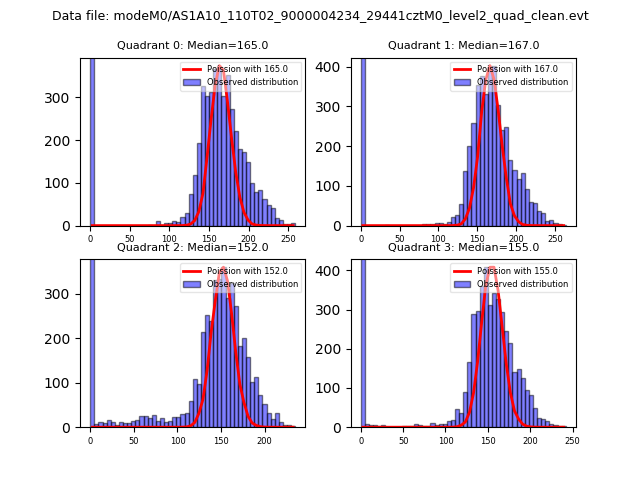
| Comparison with Poisson distribution Blue bars denote a histogram of data divided into 1 sec bins. Red curve is a Poisson curve with rate = median count rate of data. |
 |
 |
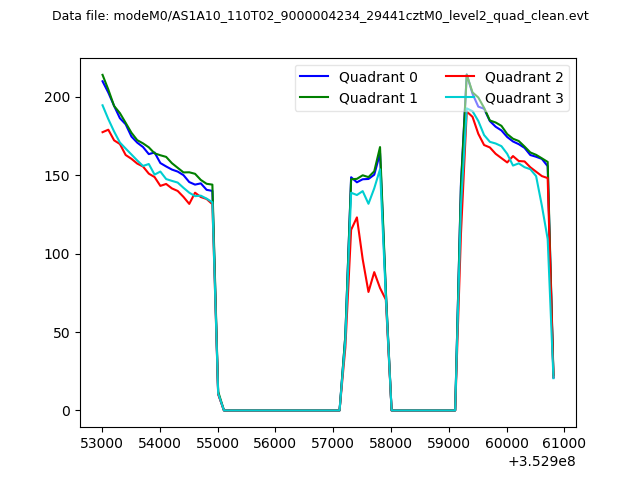
| Quadrant-wise count rates Data is divided into 100 sec bins |
 |
|
| Module-wise count rates for Quadrant A Data is divided into 100 sec bins |
 |
 |
| Module-wise count rates for Quadrant B Data is divided into 100 sec bins |
 |
 |
| Module-wise count rates for Quadrant C Data is divided into 100 sec bins |
 |
 |
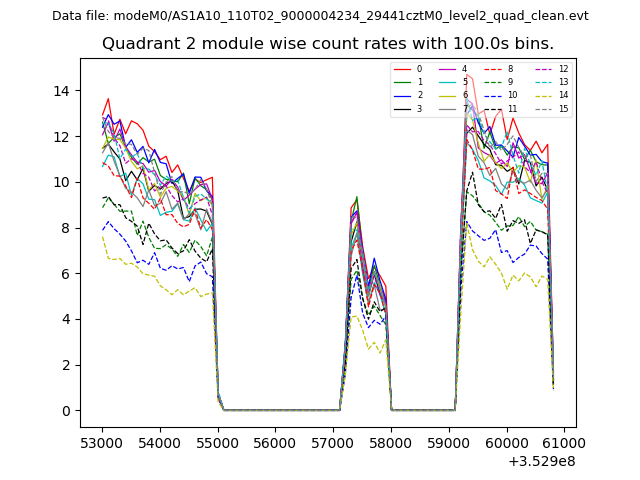
| Module-wise count rates for Quadrant D Data is divided into 100 sec bins |
 |
 |
| Parameter | Plot |
|---|---|
| CZT HV Monitor | 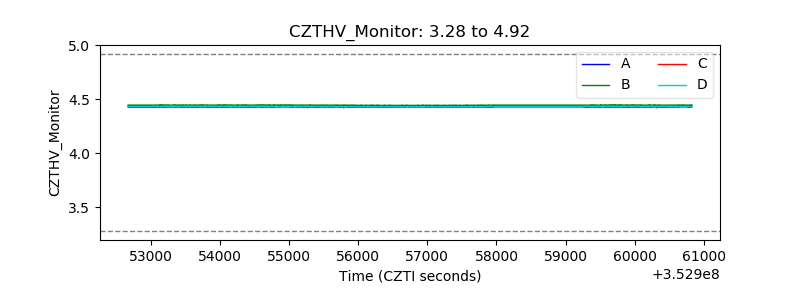 |
| D_VDD | 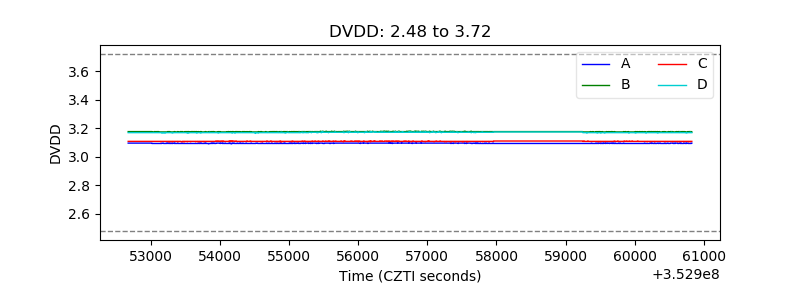 |
| Temperature 1 | 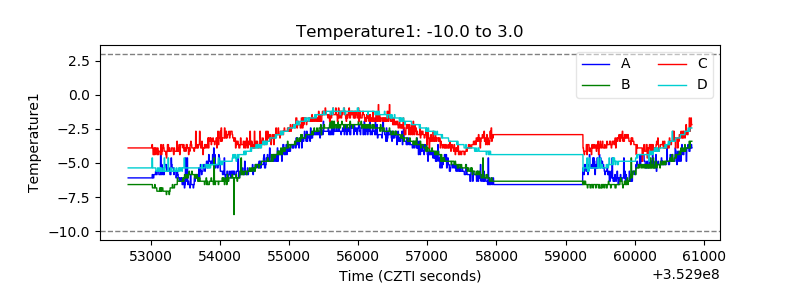 |
| Veto HV Monitor | 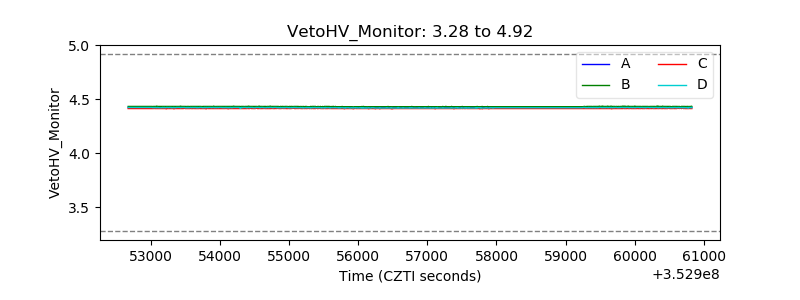 |
| Veto LLD | 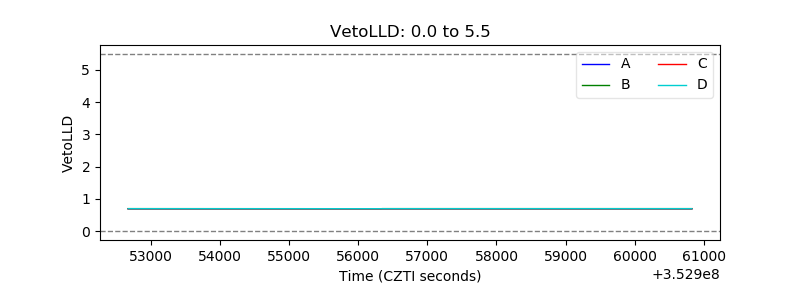 |
| Alpha Counter | 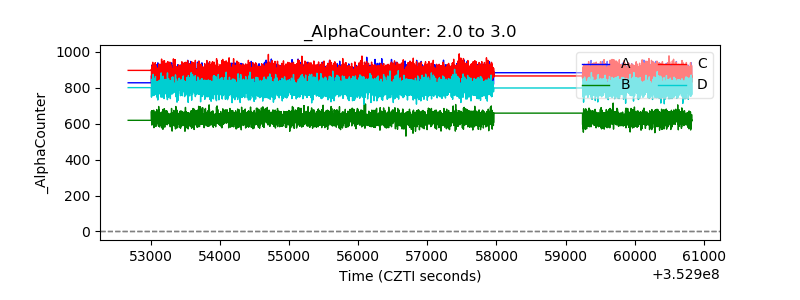 |
| _CPM_Rate | 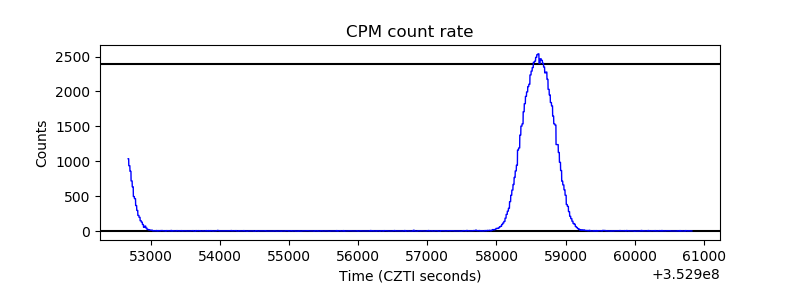 |
| CZT Counter | 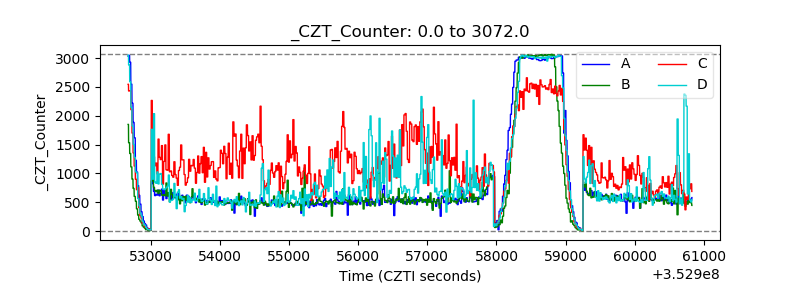 |
| +2.5 Volts monitor | 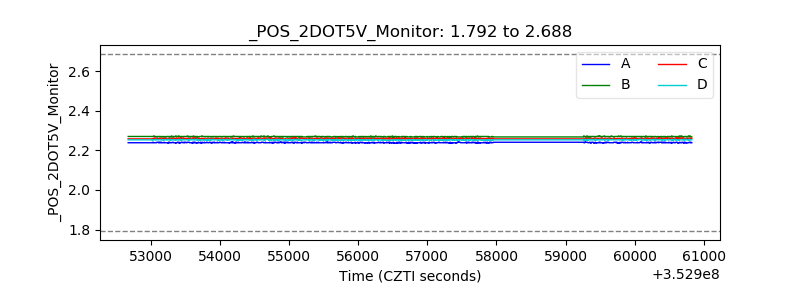 |
| +5 Volts monitor |  |
| _ROLL_ROT | 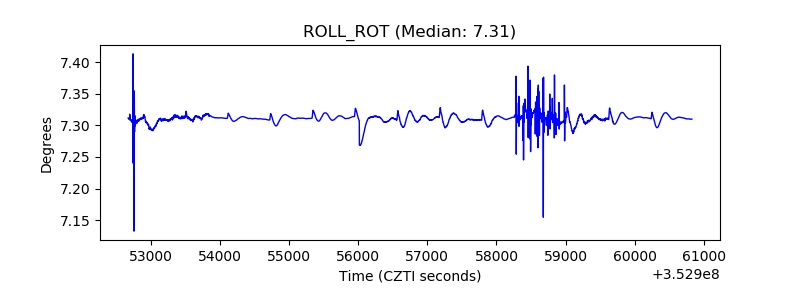 |
| _Roll_DEC | 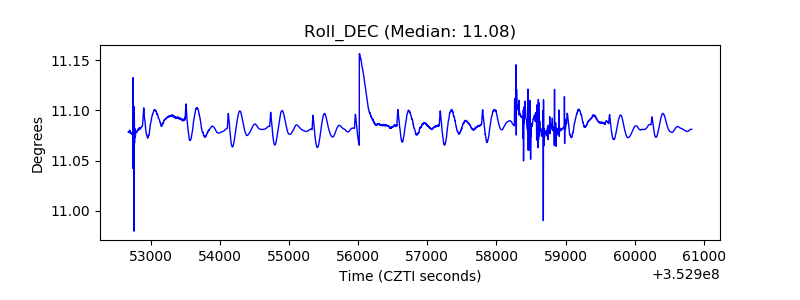 |
| _Roll_RA | 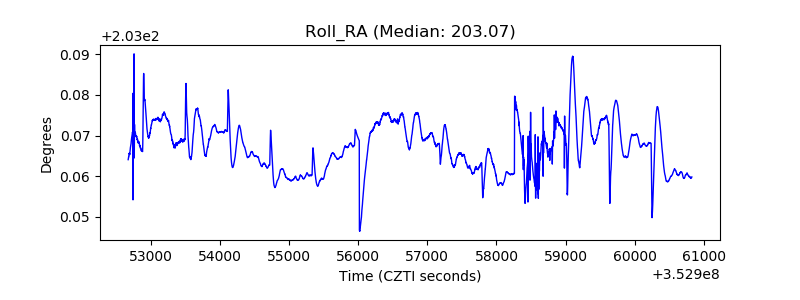 |
| Veto Counter |  |