| Param | Original file | Final file |
|---|---|---|
| Filename | modeM0/AS1A10_110T02_9000004234_29444cztM0_level2.evt | modeM0/AS1A10_110T02_9000004234_29444cztM0_level2_quad_clean.evt |
| Size (bytes) | 1,140,096,960 | 131,351,040 |
| Size | 1.1 GB | 125.3 MB |
| Events in quadrant A | 5,927,491 | 831,717 |
| Events in quadrant B | 6,079,528 | 839,775 |
| Events in quadrant C | 7,692,174 | 794,027 |
| Events in quadrant D | 14,069,384 | 732,365 |
| Mode SS | |||
|---|---|---|---|
| Quadrant | BADHDUFLAG | Total packets | Discarded packets |
| A | 0 | 230 | 0 |
| B | 0 | 230 | 0 |
| C | 0 | 230 | 0 |
| D | 0 | 230 | 0 |
| Mode M0 | |||
|---|---|---|---|
| Quadrant | BADHDUFLAG | Total packets | Discarded packets |
| A | 0 | 23728 | 2 |
| B | 0 | 24300 | 2 |
| C | 0 | 30066 | 5 |
| D | 0 | 49624 | 2 |
| Mode M9 | |||
|---|---|---|---|
| Quadrant | BADHDUFLAG | Total packets | Discarded packets |
| A | 0 | 23 | 0 |
| B | 0 | 23 | 0 |
| C | 0 | 23 | 0 |
| D | 0 | 23 | 0 |
| Quadrant | Total seconds | Saturated seconds | Saturation percentage |
|---|---|---|---|
| A | 11259 | 189 | 1.678657% |
| B | 11260 | 213 | 1.891652% |
| C | 11259 | 379 | 3.366196% |
| D | 11260 | 3104 | 27.566607% |
Noise dominated data is calculated using 1-second bins in cleaned event files. If a bin has >2000 counts, and if more than 50% of those come from <1% of pixels, then it is considered to be noise-dominated and hence unusable.
| Quadrant | # 1 sec bins | Bins with >0 counts | Bins with >2000 counts | High rate bins dominated by noise | Noise dominated (total time) | Noise dominated (detector-on time) | Marked lightcurve |
|---|---|---|---|---|---|---|---|
| A | 13574 | 11260 | 2 | 2 | 0.01% | 0.02% | 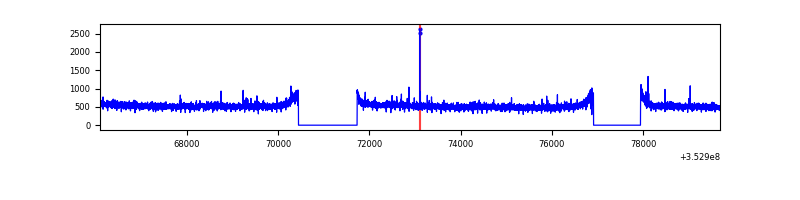 |
| B | 13575 | 11262 | 10 | 10 | 0.07% | 0.09% | 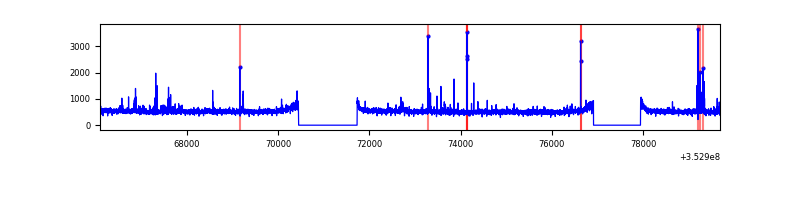 |
| C | 13575 | 11262 | 7 | 7 | 0.05% | 0.06% | 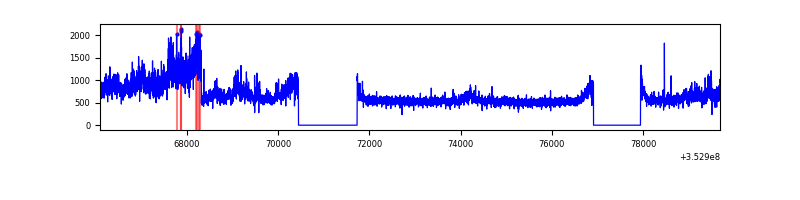 |
| D | 13575 | 11262 | 2382 | 2382 | 17.55% | 21.15% | 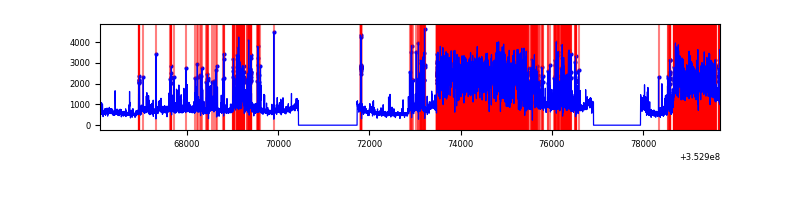 |
Top three noisy pixels from each quadrant. If the there are fewer than three noisy pixels in the level2.evt file, extra rows are filled as -1
| Pixel properties | Quadrant properties | ||||||
|---|---|---|---|---|---|---|---|
| Quadrant | DetID | PixID | Counts | Sigma | Mean | Median | Sigma |
| A | 1 | 113 | 30123 | 94.45 | 1528 | 1502 | 303.0 |
| A | 13 | 254 | 20672 | 63.26 | 1528 | 1502 | 303.0 |
| A | 3 | 137 | 14006 | 41.26 | 1528 | 1502 | 303.0 |
| B | 0 | 156 | 68248 | 237.63 | 1491 | 1454 | 281.1 |
| B | 0 | 229 | 42166 | 144.84 | 1491 | 1454 | 281.1 |
| B | 12 | 111 | 34099 | 116.14 | 1491 | 1454 | 281.1 |
| C | 3 | 233 | 1834232 | 5553.02 | 1432 | 1443 | 330.1 |
| C | 14 | 238 | 240000 | 722.78 | 1432 | 1443 | 330.1 |
| C | 2 | 114 | 26706 | 76.54 | 1432 | 1443 | 330.1 |
| D | 12 | 33 | 3976004 | 12558.8 | 1327 | 1293 | 316.5 |
| D | 1 | 52 | 1836187 | 5797.67 | 1327 | 1293 | 316.5 |
| D | 13 | 104 | 1462774 | 4617.81 | 1327 | 1293 | 316.5 |
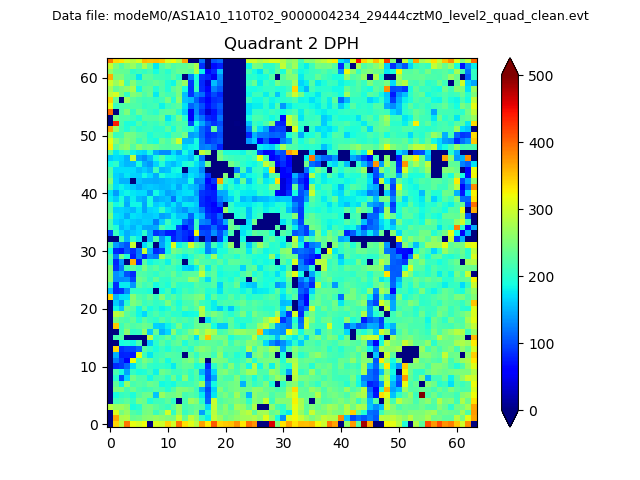
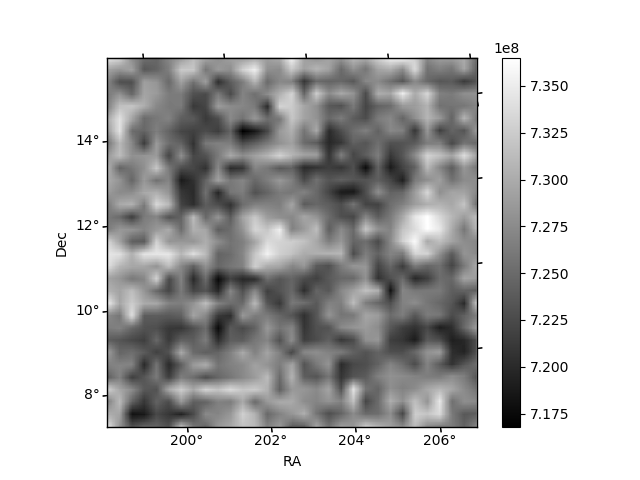
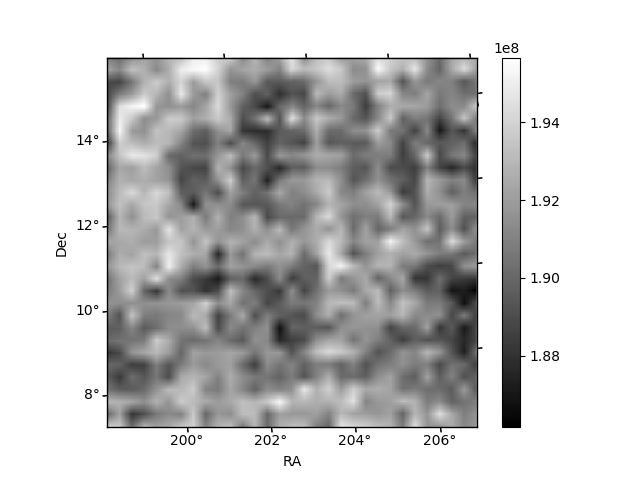
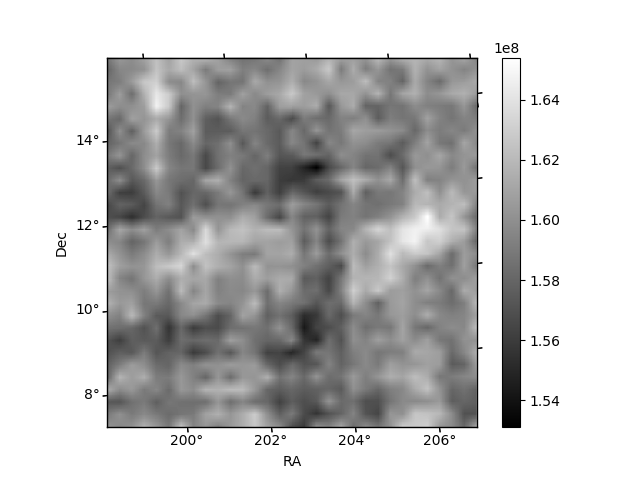
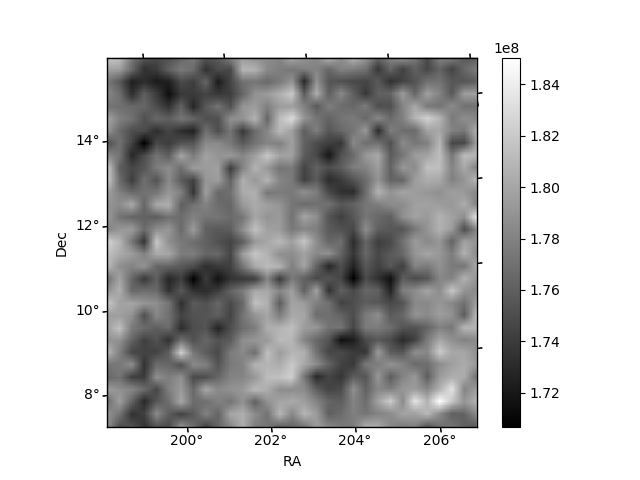
Histogram calculated using DETX and DETY for each event in the final _common_clean file
| Quadrant A | 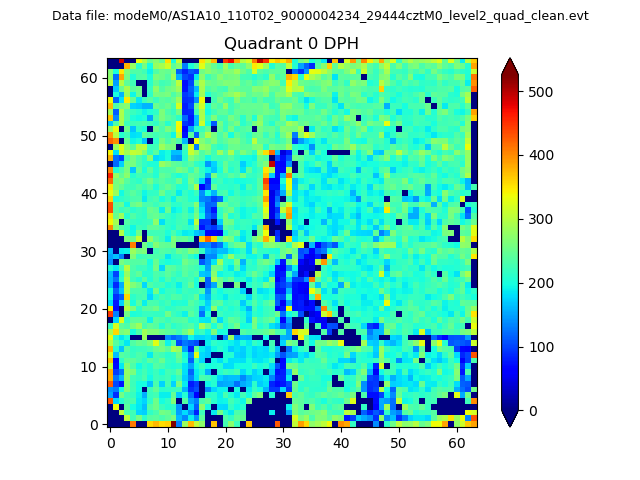 |
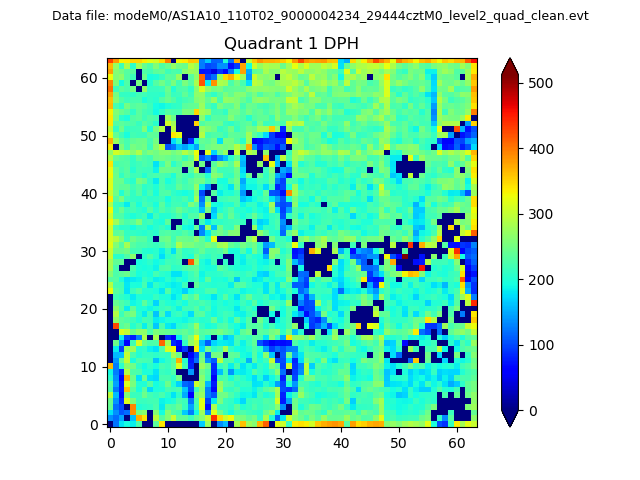 |
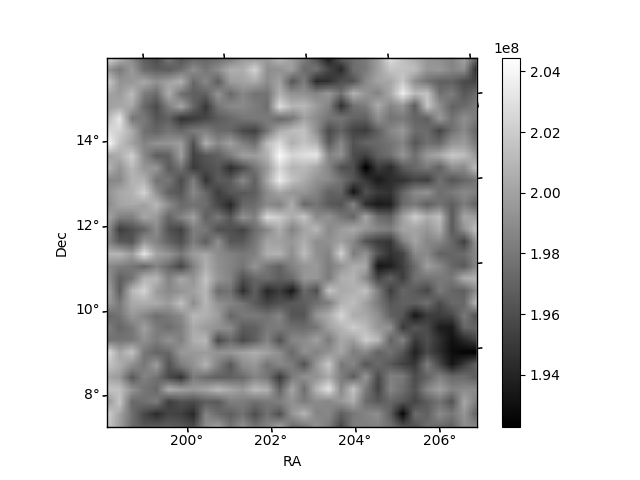
Quadrant B |
|---|---|---|---|
| Quadrant D | 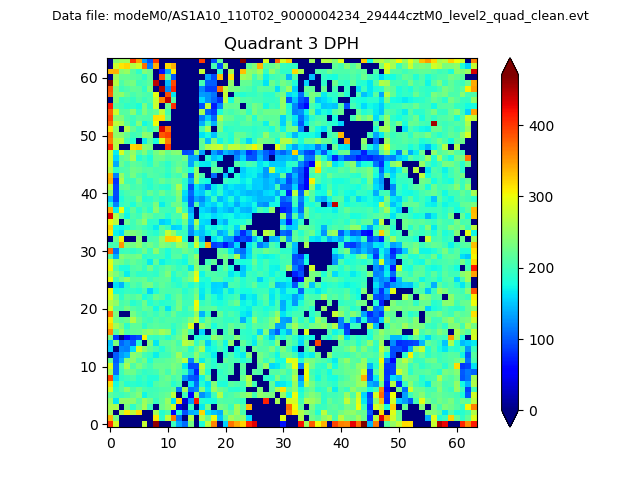 |
 |
Quadrant C |
| Plot type | Count rate plots | Images |
|---|---|---|
| Comparison with Poisson distribution Blue bars denote a histogram of data divided into 1 sec bins. Red curve is a Poisson curve with rate = median count rate of data. |
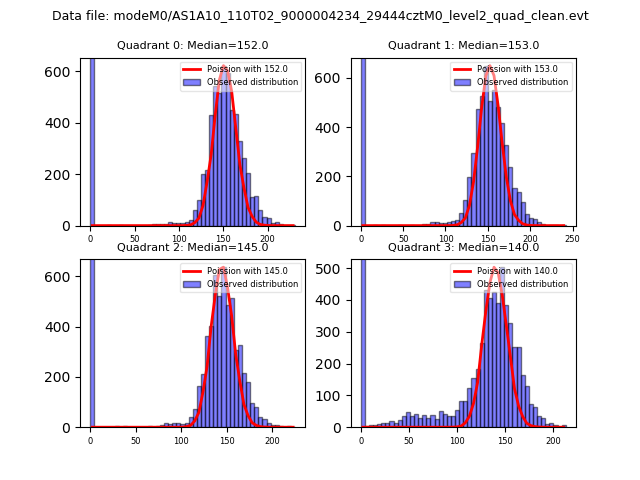 |
 |
| Quadrant-wise count rates Data is divided into 100 sec bins |
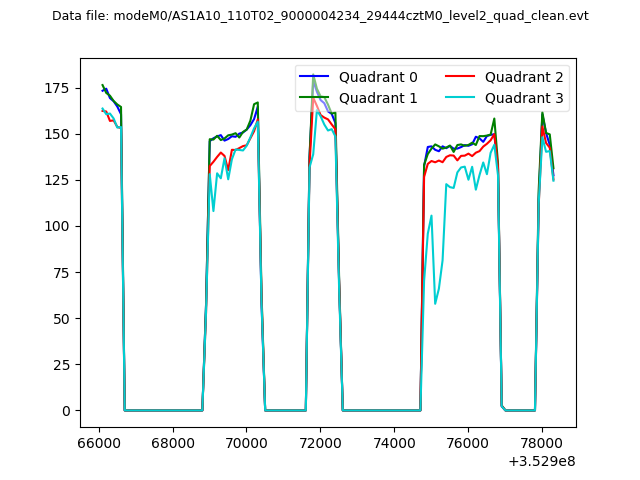 |
|
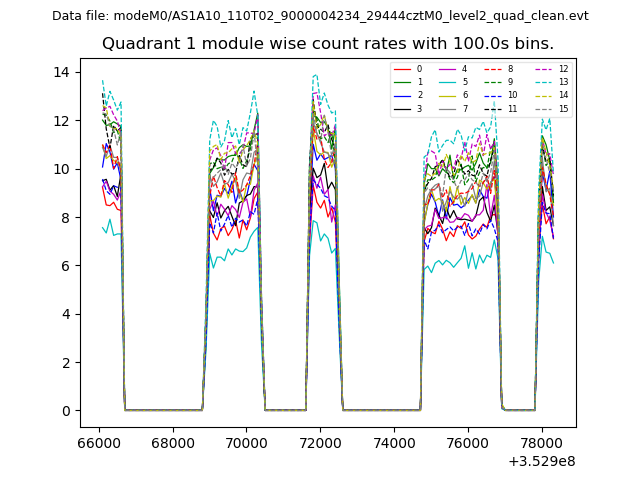
| Module-wise count rates for Quadrant A Data is divided into 100 sec bins |
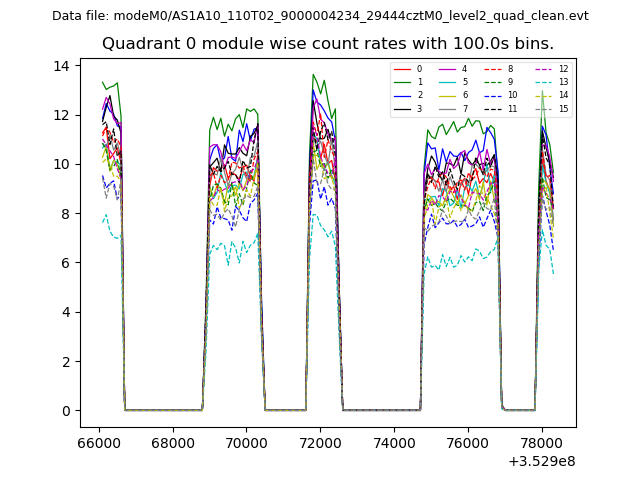 |
 |
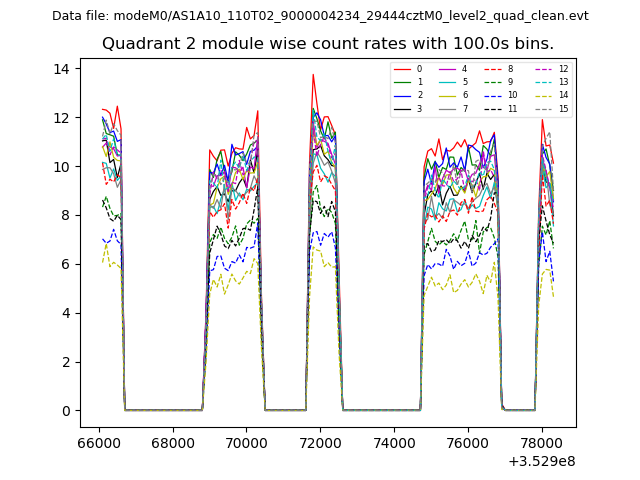
| Module-wise count rates for Quadrant B Data is divided into 100 sec bins |
 |
 |
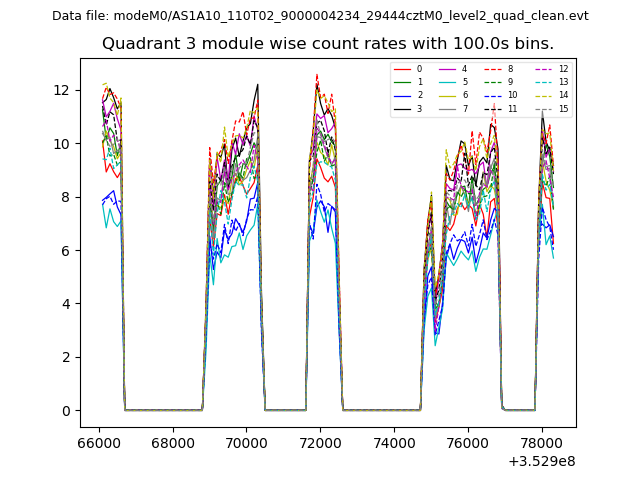
| Module-wise count rates for Quadrant C Data is divided into 100 sec bins |
 |
 |
| Module-wise count rates for Quadrant D Data is divided into 100 sec bins |
 |
 |
| Parameter | Plot |
|---|---|
| CZT HV Monitor | 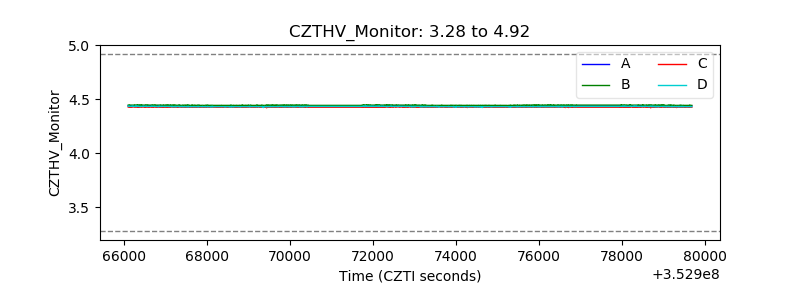 |
| D_VDD | 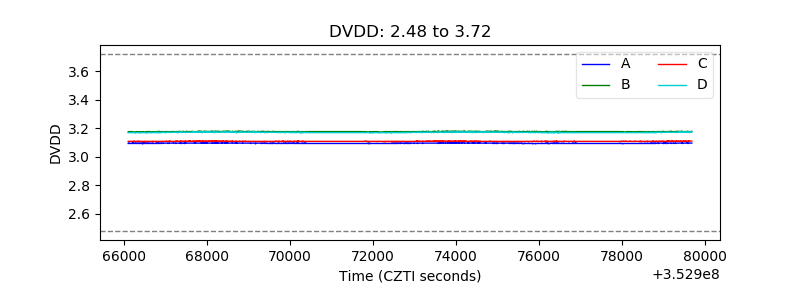 |
| Temperature 1 | 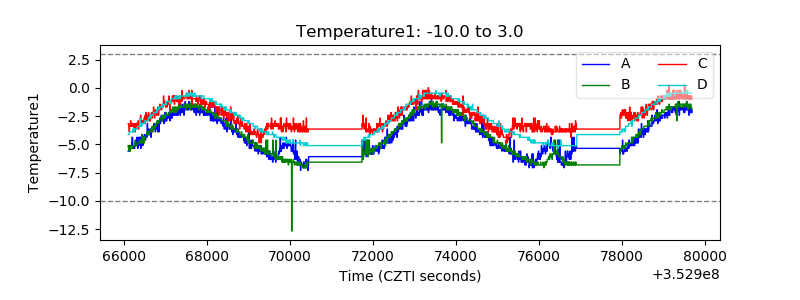 |
| Veto HV Monitor | 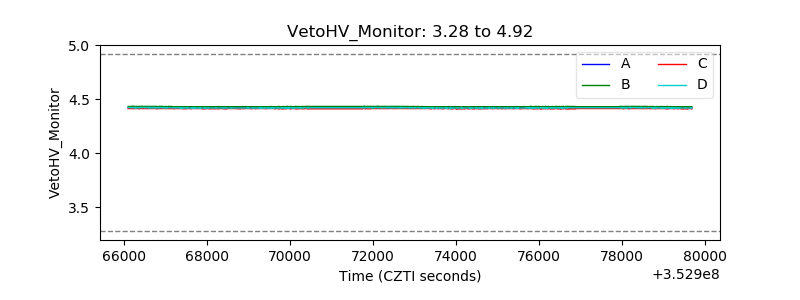 |
| Veto LLD | 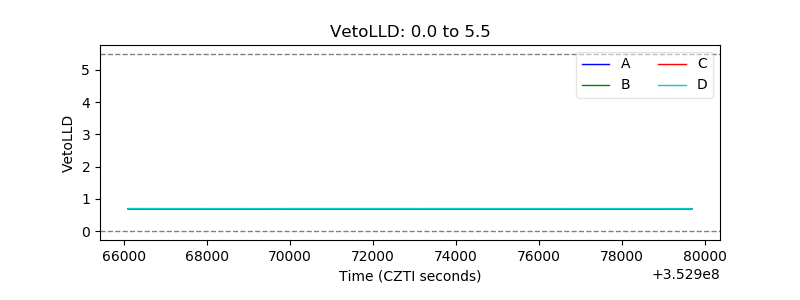 |
| Alpha Counter | 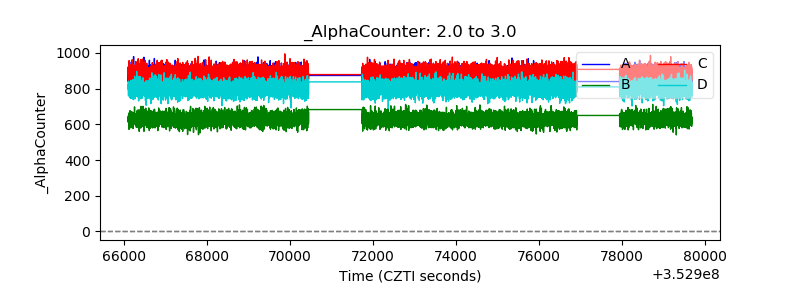 |
| _CPM_Rate | 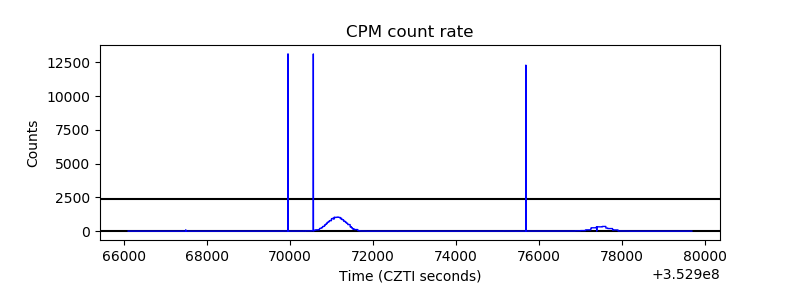 |
| CZT Counter | 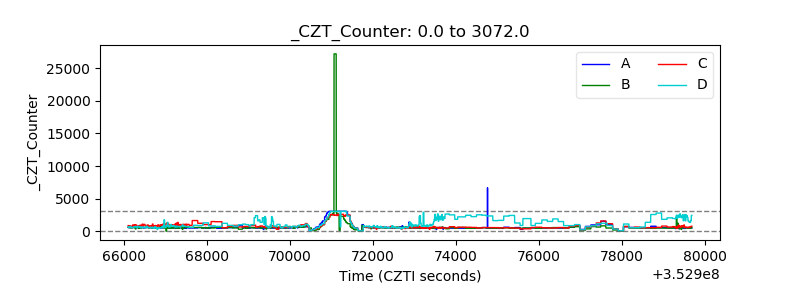 |
| +2.5 Volts monitor |  |
| +5 Volts monitor |  |
| _ROLL_ROT | 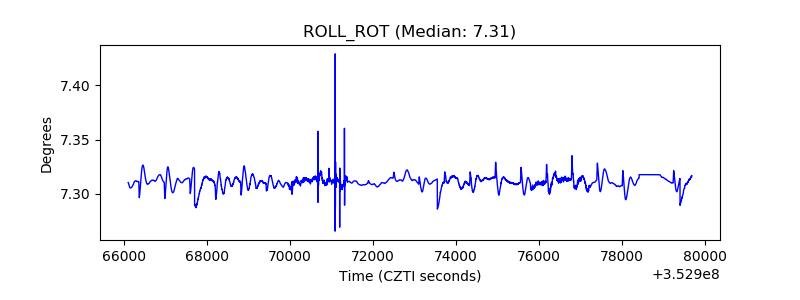 |
| _Roll_DEC | 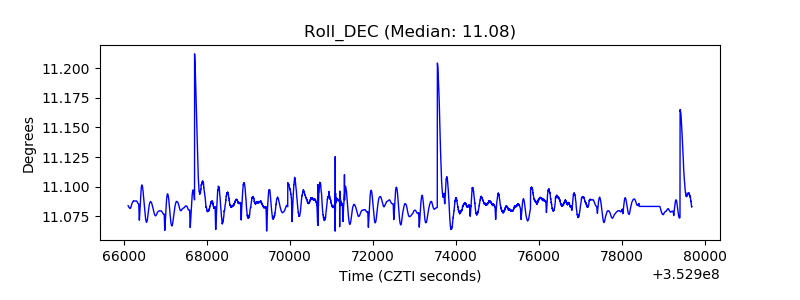 |
| _Roll_RA | 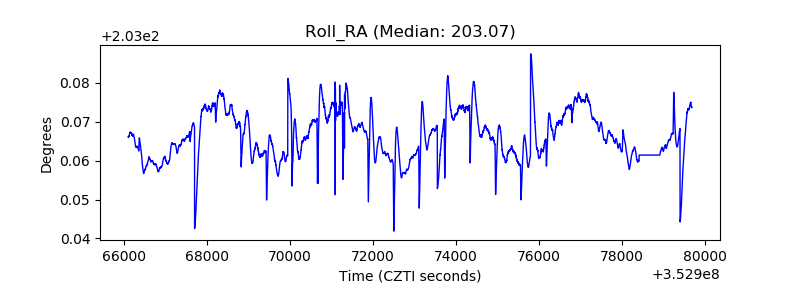 |
| Veto Counter | 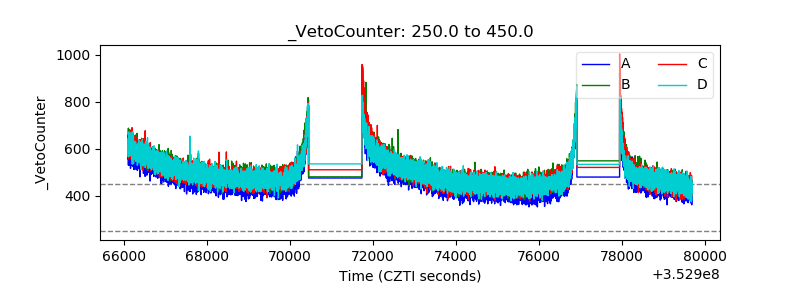 |