| Param | Original file | Final file |
|---|---|---|
| Filename | modeM0/AS1A10_110T02_9000004234_29445cztM0_level2.evt | modeM0/AS1A10_110T02_9000004234_29445cztM0_level2_quad_clean.evt |
| Size (bytes) | 2,047,723,200 | 234,959,040 |
| Size | 1.9 GB | 224.1 MB |
| Events in quadrant A | 10,335,045 | 1,508,706 |
| Events in quadrant B | 10,551,737 | 1,517,974 |
| Events in quadrant C | 14,211,369 | 1,427,625 |
| Events in quadrant D | 25,610,901 | 1,322,168 |
| Mode SS | |||
|---|---|---|---|
| Quadrant | BADHDUFLAG | Total packets | Discarded packets |
| A | 0 | 394 | 0 |
| B | 0 | 394 | 0 |
| C | 0 | 394 | 0 |
| D | 0 | 394 | 0 |
| Mode M0 | |||
|---|---|---|---|
| Quadrant | BADHDUFLAG | Total packets | Discarded packets |
| A | 0 | 42092 | 73 |
| B | 0 | 42582 | 74 |
| C | 0 | 55537 | 50 |
| D | 0 | 89661 | 48 |
| Mode M9 | |||
|---|---|---|---|
| Quadrant | BADHDUFLAG | Total packets | Discarded packets |
| A | 0 | 43 | 1 |
| B | 0 | 43 | 1 |
| C | 0 | 43 | 1 |
| D | 0 | 43 | 1 |
| Quadrant | Total seconds | Saturated seconds | Saturation percentage |
|---|---|---|---|
| A | 19433 | 354 | 1.821644% |
| B | 19435 | 402 | 2.068433% |
| C | 19444 | 804 | 4.134952% |
| D | 19446 | 5561 | 28.597141% |
Noise dominated data is calculated using 1-second bins in cleaned event files. If a bin has >2000 counts, and if more than 50% of those come from <1% of pixels, then it is considered to be noise-dominated and hence unusable.
| Quadrant | # 1 sec bins | Bins with >0 counts | Bins with >2000 counts | High rate bins dominated by noise | Noise dominated (total time) | Noise dominated (detector-on time) | Marked lightcurve |
|---|---|---|---|---|---|---|---|
| A | 23773 | 19462 | 2 | 2 | 0.01% | 0.01% | 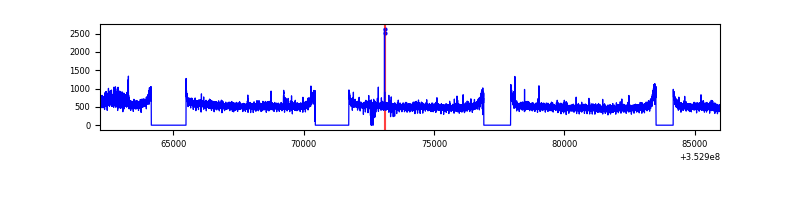 |
| B | 23774 | 19465 | 20 | 20 | 0.08% | 0.10% | 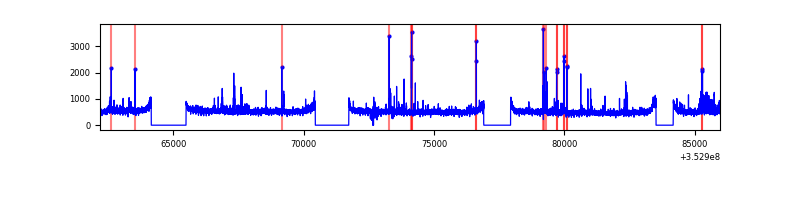 |
| C | 23774 | 19466 | 31 | 31 | 0.13% | 0.16% | 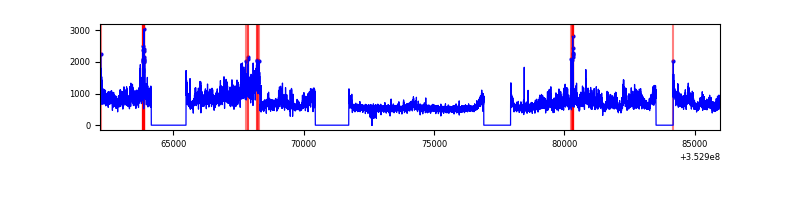 |
| D | 23773 | 19465 | 4161 | 4161 | 17.50% | 21.38% | 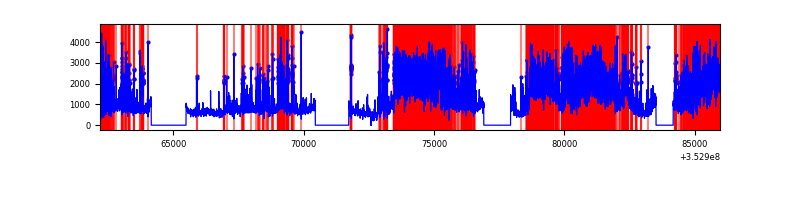 |
Top three noisy pixels from each quadrant. If the there are fewer than three noisy pixels in the level2.evt file, extra rows are filled as -1
| Pixel properties | Quadrant properties | ||||||
|---|---|---|---|---|---|---|---|
| Quadrant | DetID | PixID | Counts | Sigma | Mean | Median | Sigma |
| A | 1 | 113 | 220198 | 417.87 | 2622 | 2570 | 520.8 |
| A | 13 | 254 | 35928 | 64.05 | 2622 | 2570 | 520.8 |
| A | 3 | 137 | 24530 | 42.17 | 2622 | 2570 | 520.8 |
| B | 0 | 229 | 100638 | 202.13 | 2566 | 2501 | 485.5 |
| B | 0 | 156 | 97033 | 194.7 | 2566 | 2501 | 485.5 |
| B | 15 | 33 | 85486 | 170.92 | 2566 | 2501 | 485.5 |
| C | 3 | 233 | 4131471 | 7256.33 | 2462 | 2479 | 569.0 |
| C | 14 | 238 | 415189 | 725.3 | 2462 | 2479 | 569.0 |
| C | 2 | 114 | 46519 | 77.4 | 2462 | 2479 | 569.0 |
| D | 12 | 33 | 7595415 | 13773.7 | 2303 | 2245 | 551.3 |
| D | 1 | 52 | 3591312 | 6510.42 | 2303 | 2245 | 551.3 |
| D | 13 | 104 | 2782705 | 5043.64 | 2303 | 2245 | 551.3 |
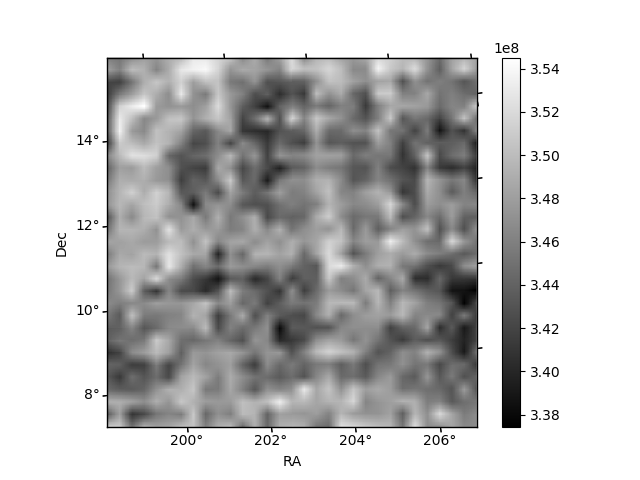
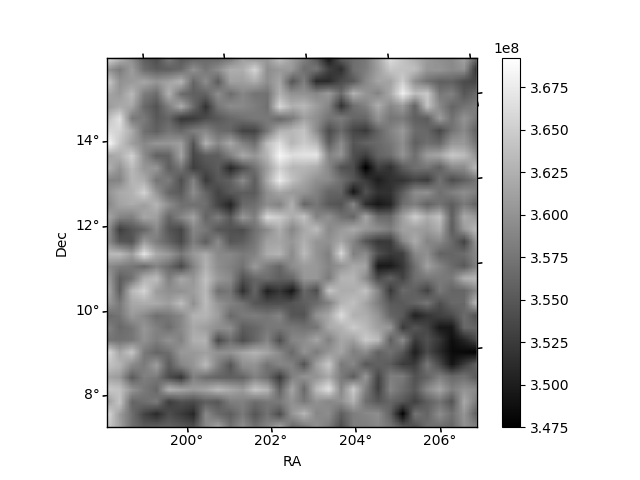
Histogram calculated using DETX and DETY for each event in the final _common_clean file
| Quadrant A |  |
 |
Quadrant B |
|---|---|---|---|
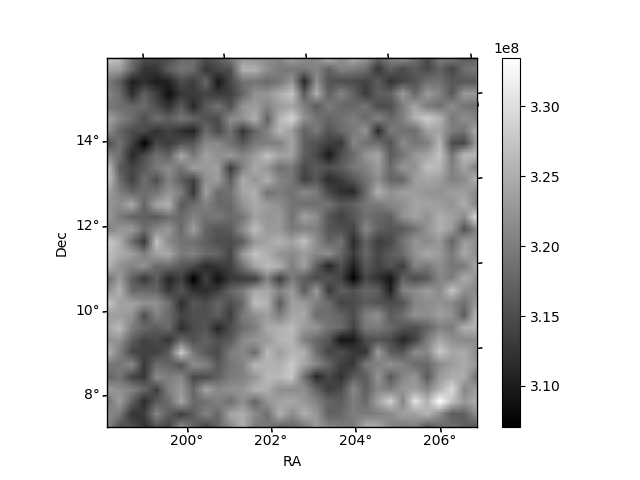
| Quadrant D |  |
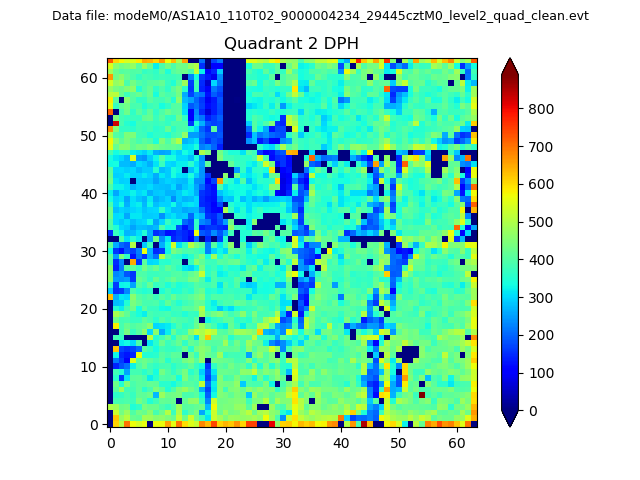 |
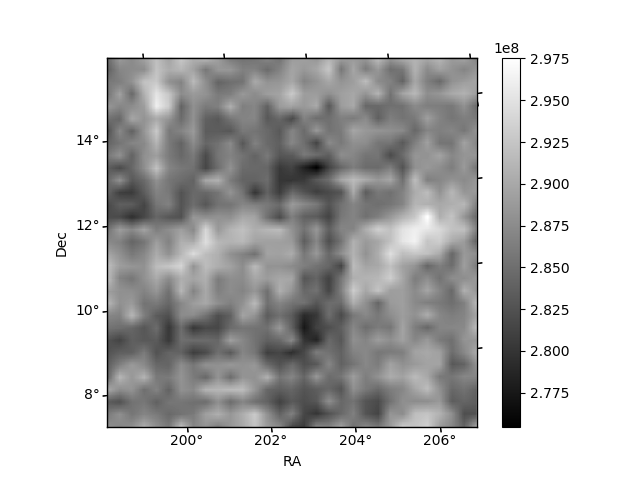
Quadrant C |
| Plot type | Count rate plots | Images |
|---|---|---|
| Comparison with Poisson distribution Blue bars denote a histogram of data divided into 1 sec bins. Red curve is a Poisson curve with rate = median count rate of data. |
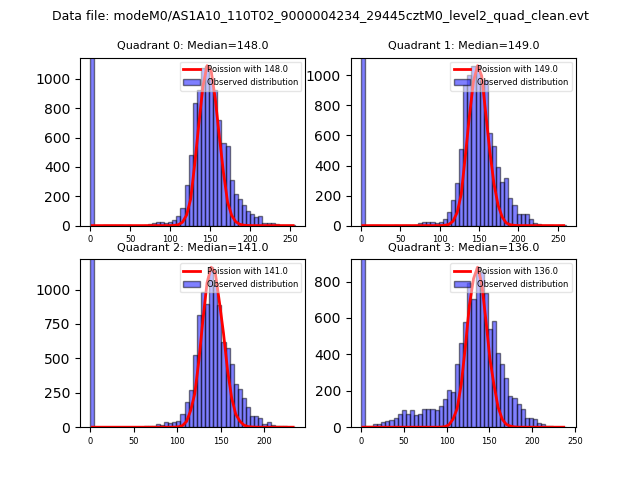 |
 |
| Quadrant-wise count rates Data is divided into 100 sec bins |
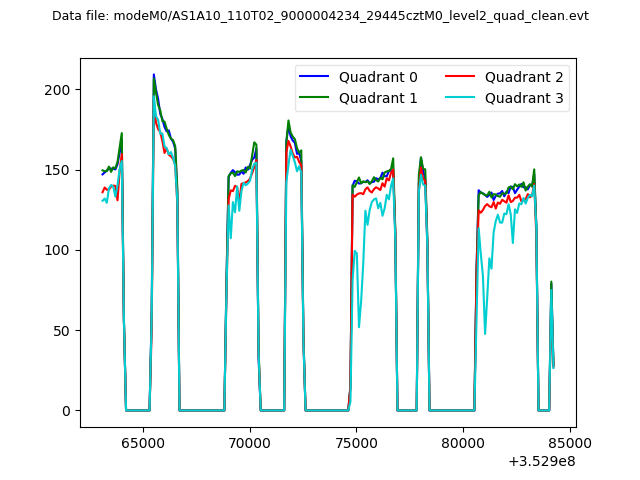 |
|
| Module-wise count rates for Quadrant A Data is divided into 100 sec bins |
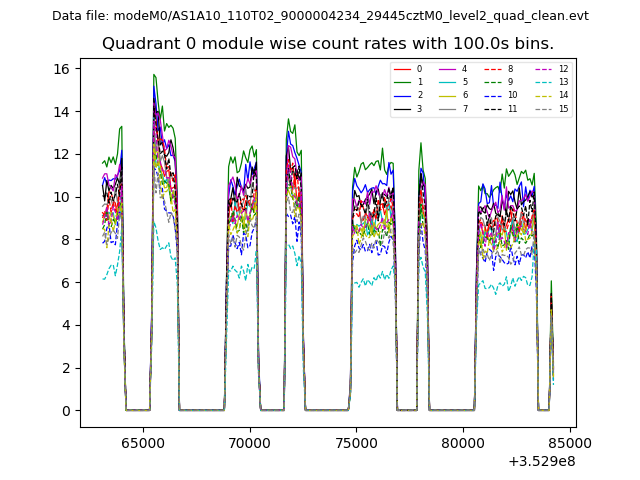 |
 |
| Module-wise count rates for Quadrant B Data is divided into 100 sec bins |
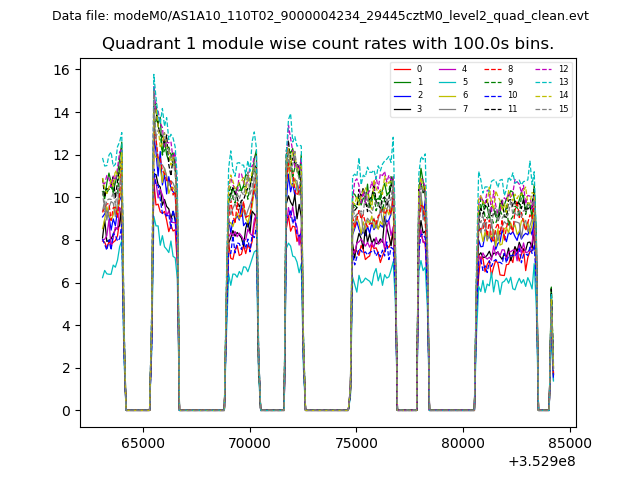 |
 |
| Module-wise count rates for Quadrant C Data is divided into 100 sec bins |
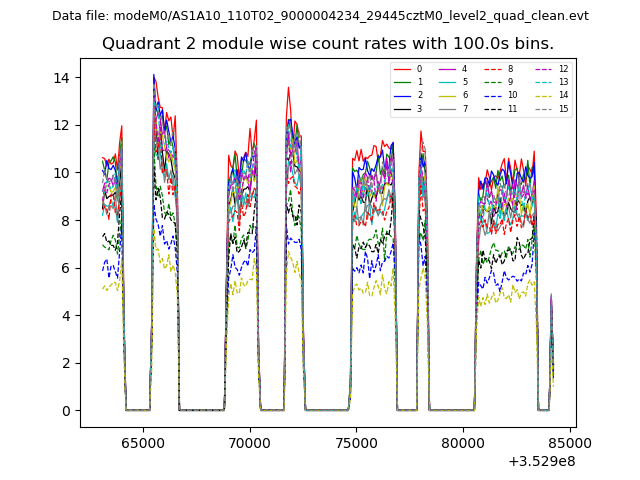 |
 |
| Module-wise count rates for Quadrant D Data is divided into 100 sec bins |
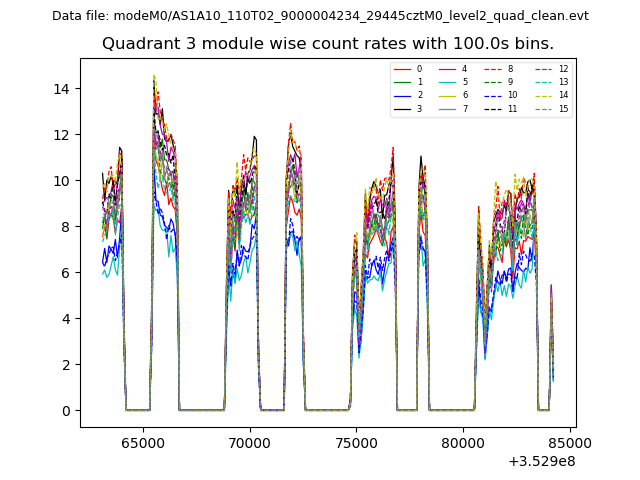 |
 |
| Parameter | Plot |
|---|---|
| CZT HV Monitor | 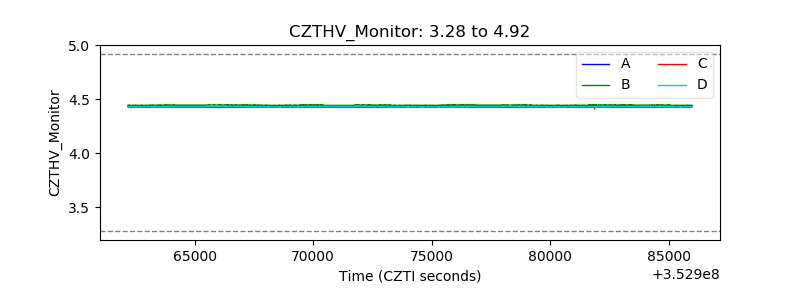 |
| D_VDD | 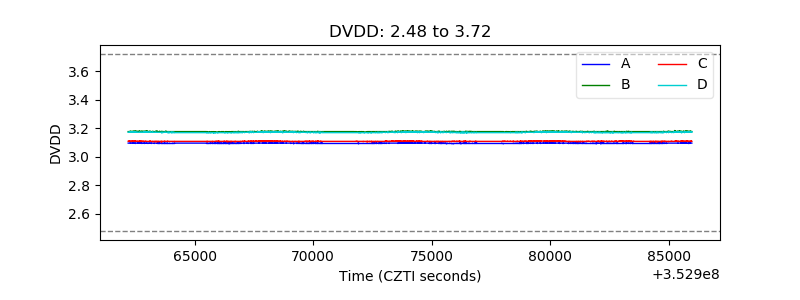 |
| Temperature 1 | 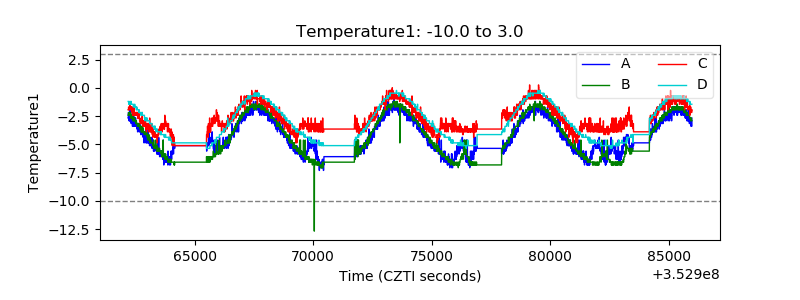 |
| Veto HV Monitor | 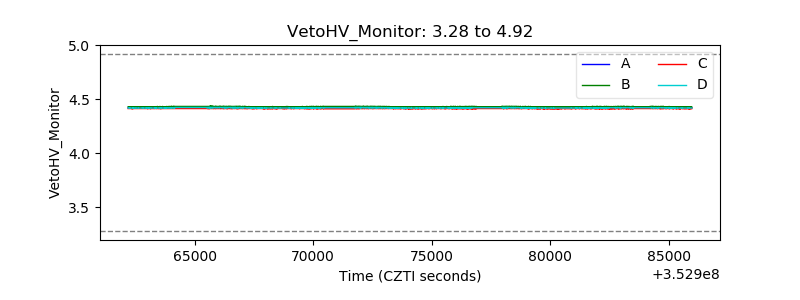 |
| Veto LLD |  |
| Alpha Counter | 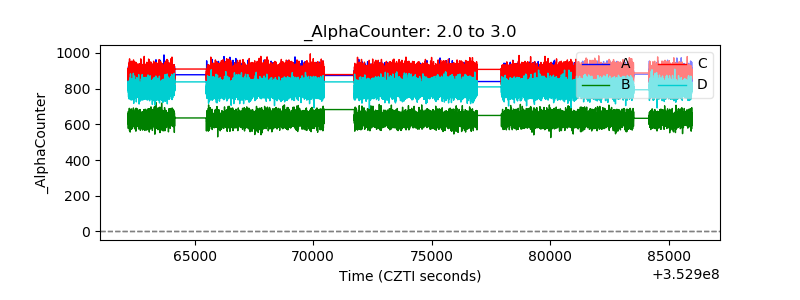 |
| _CPM_Rate | 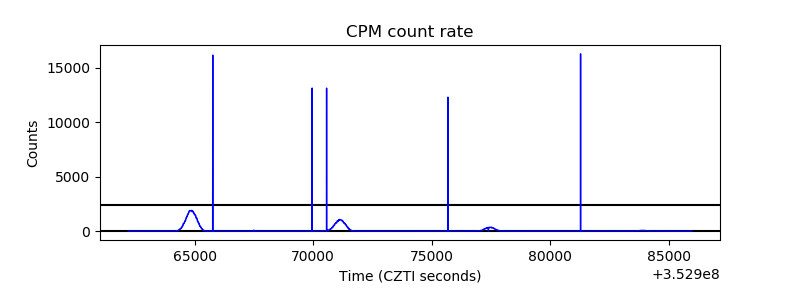 |
| CZT Counter | 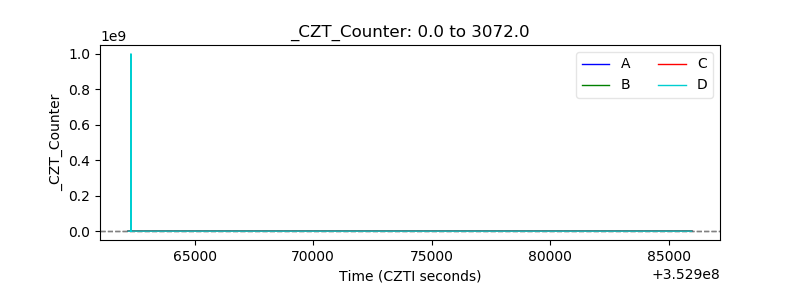 |
| +2.5 Volts monitor |  |
| +5 Volts monitor | 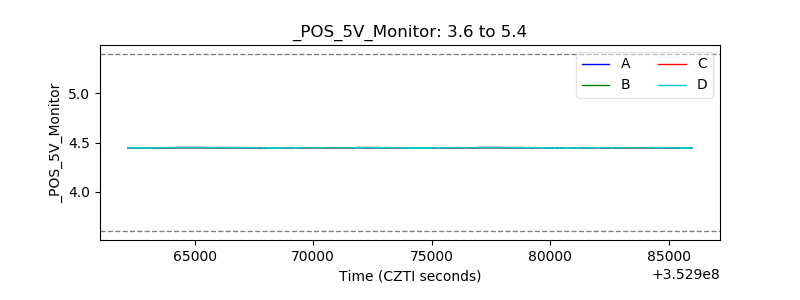 |
| _ROLL_ROT | 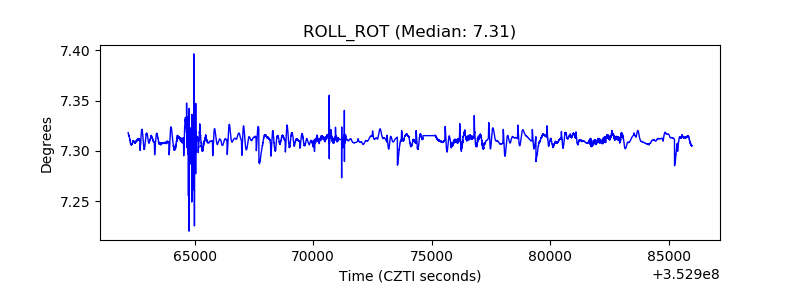 |
| _Roll_DEC | 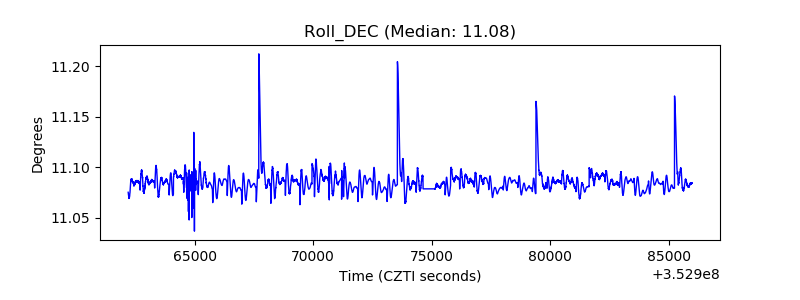 |
| _Roll_RA | 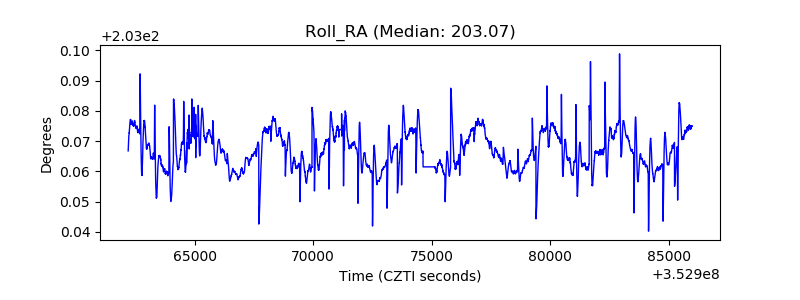 |
| Veto Counter | 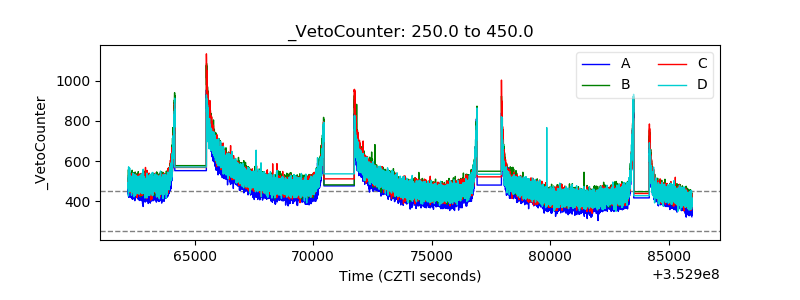 |