| Param | Original file | Final file |
|---|---|---|
| Filename | modeM0/AS1A10_110T02_9000004234_29446cztM0_level2.evt | modeM0/AS1A10_110T02_9000004234_29446cztM0_level2_quad_clean.evt |
| Size (bytes) | 846,996,480 | 79,024,320 |
| Size | 807.8 MB | 75.4 MB |
| Events in quadrant A | 3,767,383 | 483,769 |
| Events in quadrant B | 4,056,526 | 488,420 |
| Events in quadrant C | 4,535,427 | 468,751 |
| Events in quadrant D | 12,778,886 | 423,209 |
| Mode SS | |||
|---|---|---|---|
| Quadrant | BADHDUFLAG | Total packets | Discarded packets |
| A | 0 | 152 | 0 |
| B | 0 | 152 | 0 |
| C | 0 | 152 | 0 |
| D | 0 | 152 | 0 |
| Mode M0 | |||
|---|---|---|---|
| Quadrant | BADHDUFLAG | Total packets | Discarded packets |
| A | 0 | 15880 | 2 |
| B | 0 | 16692 | 2 |
| C | 0 | 18187 | 2 |
| D | 0 | 43141 | 2 |
| Mode M9 | |||
|---|---|---|---|
| Quadrant | BADHDUFLAG | Total packets | Discarded packets |
| A | 0 | 8 | 0 |
| B | 0 | 8 | 0 |
| C | 0 | 9 | 0 |
| D | 0 | 9 | 0 |
| Quadrant | Total seconds | Saturated seconds | Saturation percentage |
|---|---|---|---|
| A | 7600 | 105 | 1.381579% |
| B | 7600 | 168 | 2.210526% |
| C | 7600 | 234 | 3.078947% |
| D | 7600 | 3629 | 47.750000% |
Noise dominated data is calculated using 1-second bins in cleaned event files. If a bin has >2000 counts, and if more than 50% of those come from <1% of pixels, then it is considered to be noise-dominated and hence unusable.
| Quadrant | # 1 sec bins | Bins with >0 counts | Bins with >2000 counts | High rate bins dominated by noise | Noise dominated (total time) | Noise dominated (detector-on time) | Marked lightcurve |
|---|---|---|---|---|---|---|---|
| A | 7850 | 7601 | 1 | 1 | 0.01% | 0.01% | 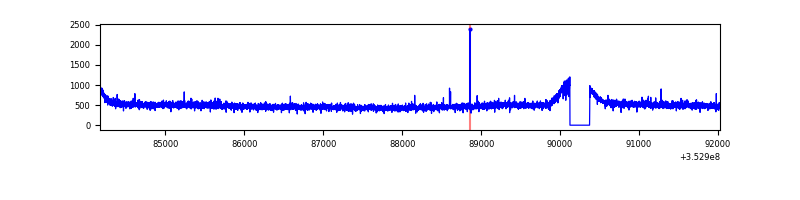 |
| B | 7850 | 7601 | 16 | 16 | 0.20% | 0.21% | 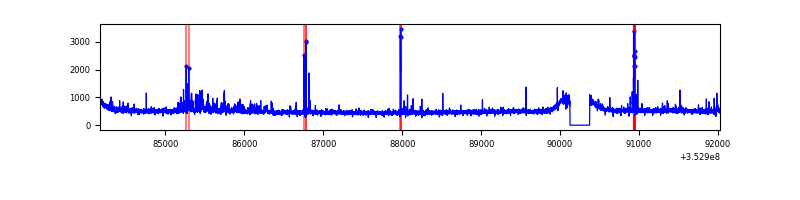 |
| C | 7850 | 7601 | 2 | 2 | 0.03% | 0.03% | 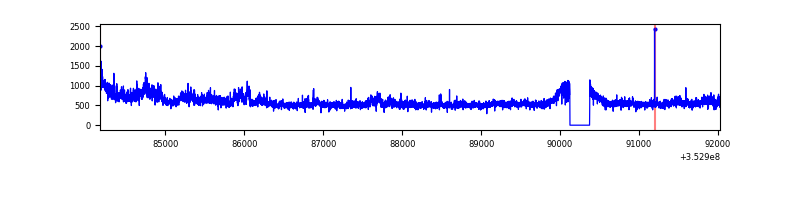 |
| D | 7850 | 7601 | 2776 | 2776 | 35.36% | 36.52% | 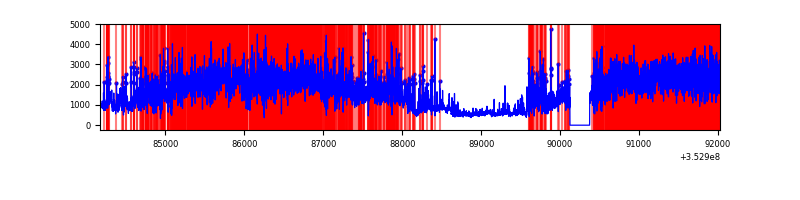 |
Top three noisy pixels from each quadrant. If the there are fewer than three noisy pixels in the level2.evt file, extra rows are filled as -1
| Pixel properties | Quadrant properties | ||||||
|---|---|---|---|---|---|---|---|
| Quadrant | DetID | PixID | Counts | Sigma | Mean | Median | Sigma |
| A | 13 | 254 | 13486 | 63.22 | 975 | 956 | 198.2 |
| A | 3 | 137 | 9798 | 44.62 | 975 | 956 | 198.2 |
| A | 0 | 226 | 8251 | 36.81 | 975 | 956 | 198.2 |
| B | 15 | 33 | 100399 | 534.58 | 958 | 932 | 186.1 |
| B | 0 | 156 | 70612 | 374.49 | 958 | 932 | 186.1 |
| B | 0 | 229 | 44496 | 234.13 | 958 | 932 | 186.1 |
| C | 3 | 233 | 759259 | 3478.14 | 924 | 930 | 218.0 |
| C | 14 | 238 | 150494 | 685.99 | 924 | 930 | 218.0 |
| C | 2 | 114 | 18102 | 78.76 | 924 | 930 | 218.0 |
| D | 12 | 33 | 4699824 | 24277.22 | 797 | 775 | 193.6 |
| D | 7 | 80 | 2632403 | 13596.07 | 797 | 775 | 193.6 |
| D | 13 | 104 | 1191755 | 6153.09 | 797 | 775 | 193.6 |
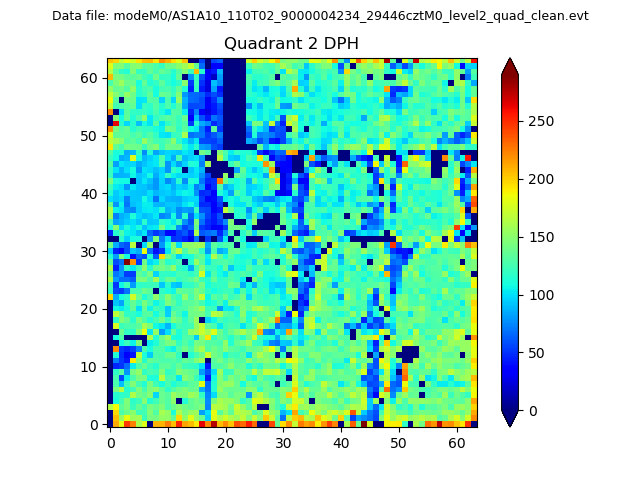
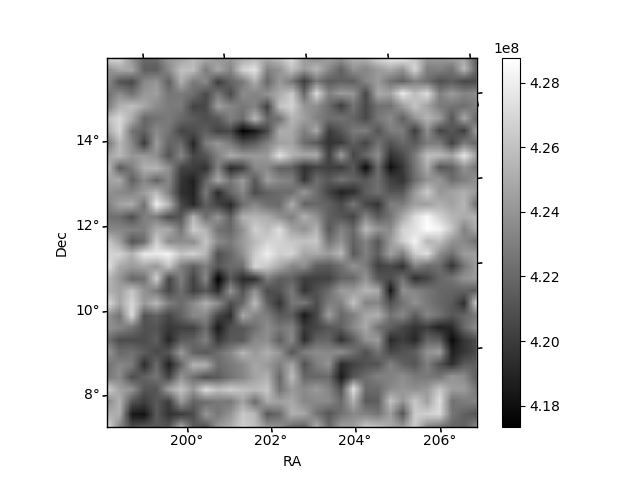
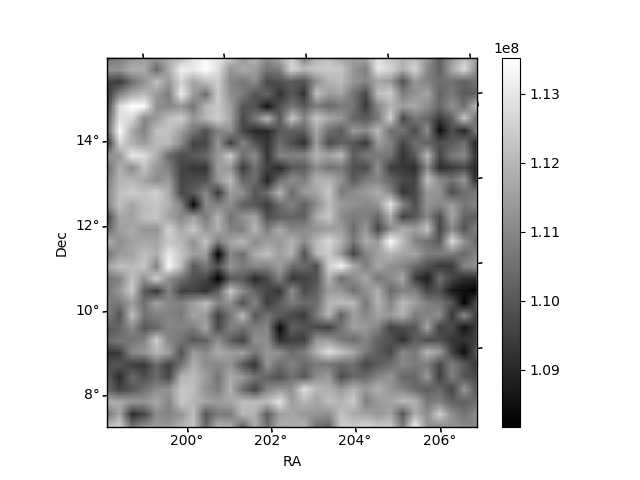
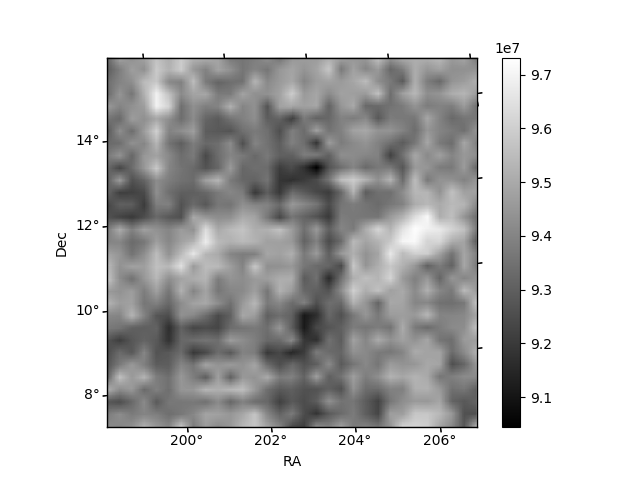
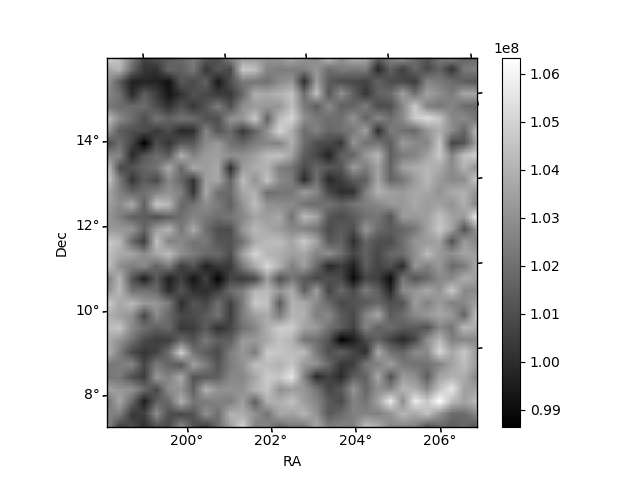
Histogram calculated using DETX and DETY for each event in the final _common_clean file
| Quadrant A | 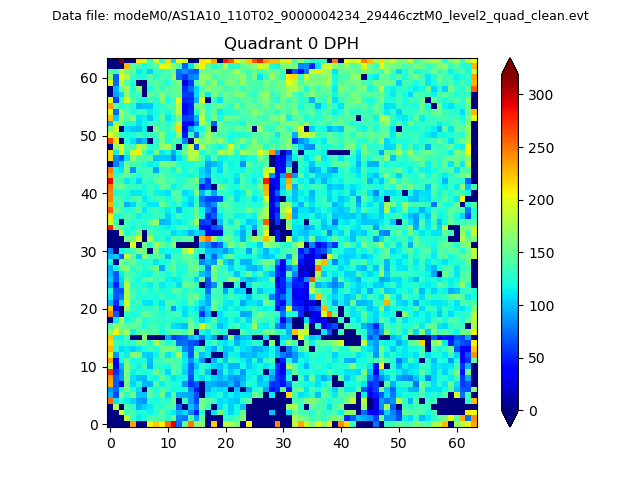 |
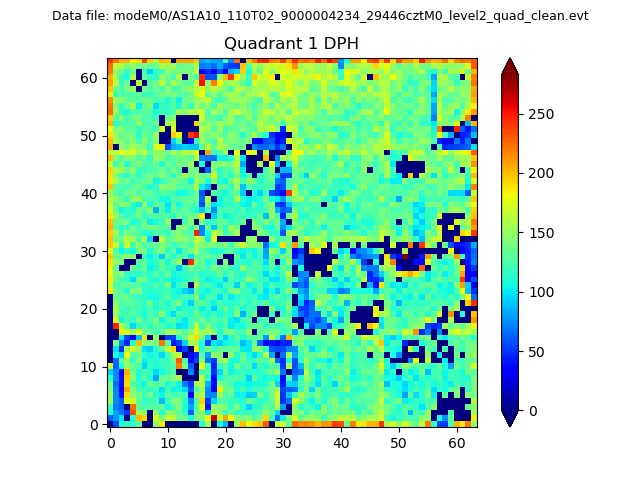 |
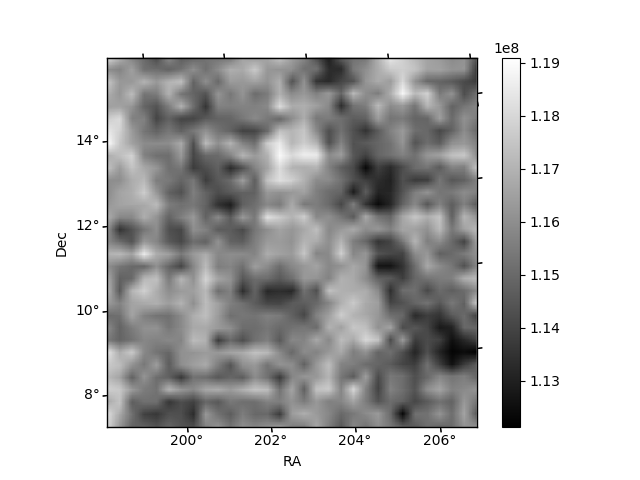
Quadrant B |
|---|---|---|---|
| Quadrant D | 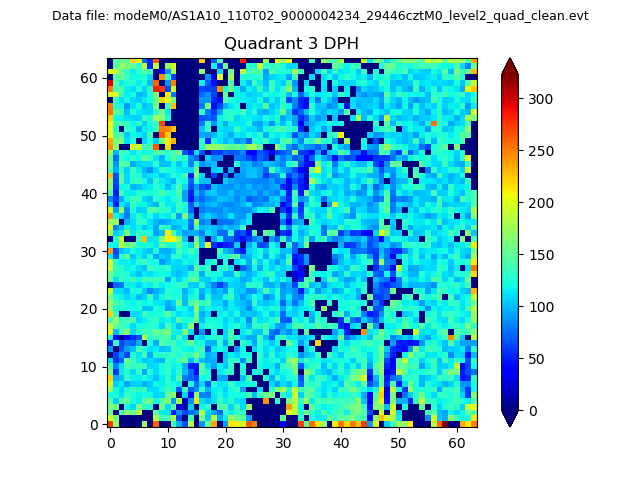 |
 |
Quadrant C |
| Plot type | Count rate plots | Images |
|---|---|---|
| Comparison with Poisson distribution Blue bars denote a histogram of data divided into 1 sec bins. Red curve is a Poisson curve with rate = median count rate of data. |
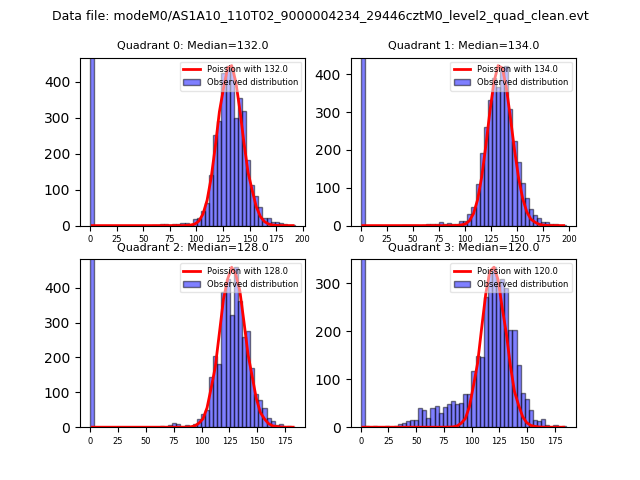 |
 |
| Quadrant-wise count rates Data is divided into 100 sec bins |
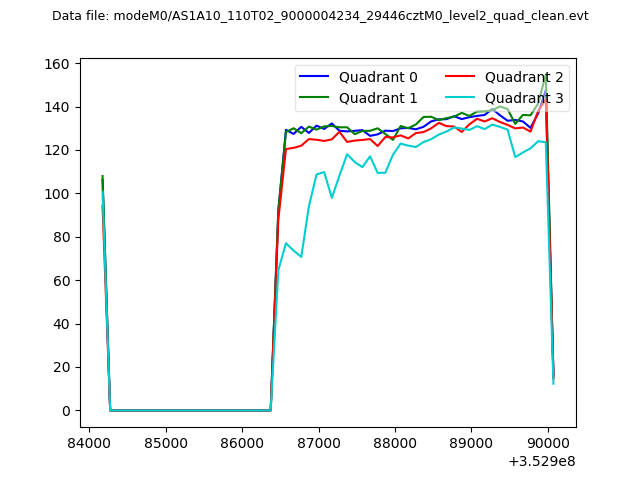 |
|
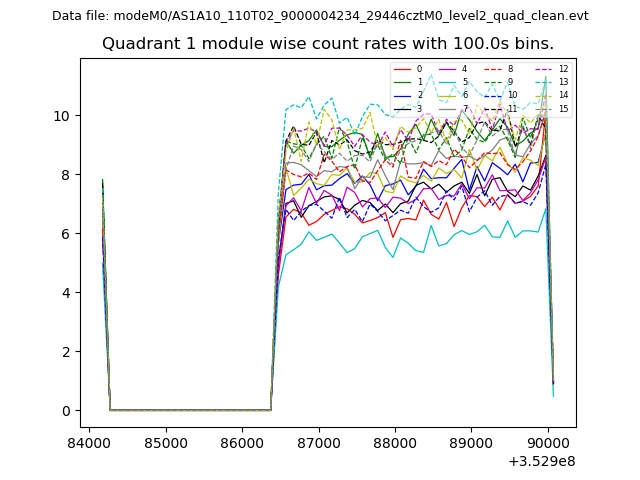
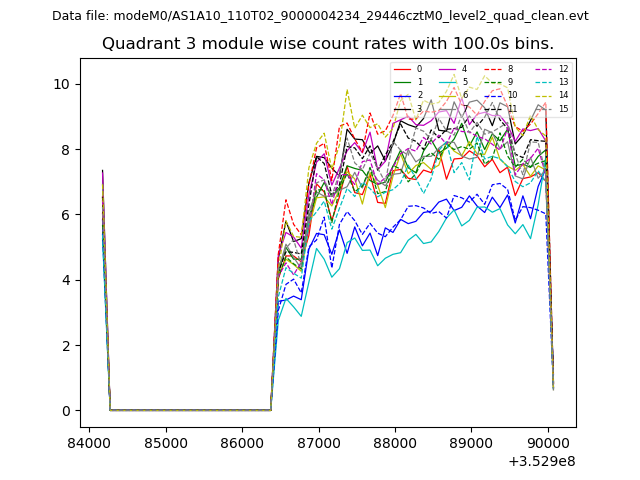
| Module-wise count rates for Quadrant A Data is divided into 100 sec bins |
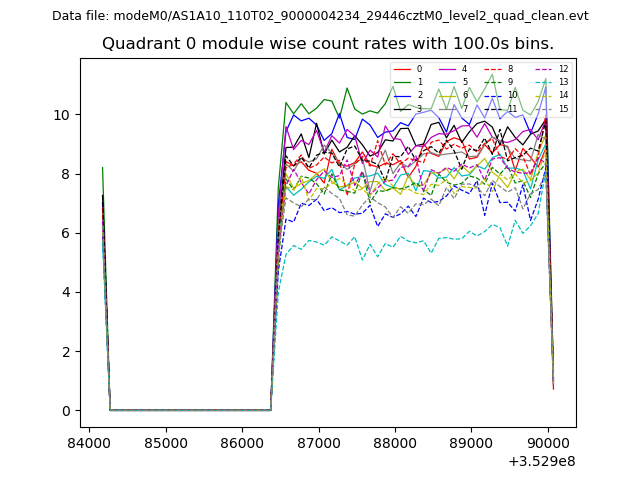 |
 |
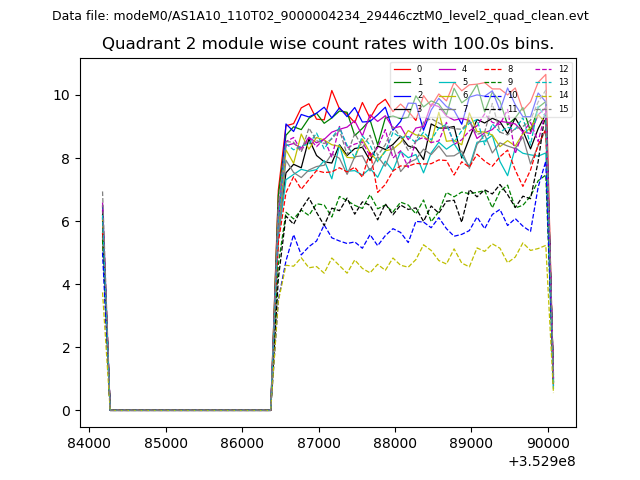
| Module-wise count rates for Quadrant B Data is divided into 100 sec bins |
 |
 |
| Module-wise count rates for Quadrant C Data is divided into 100 sec bins |
 |
 |
| Module-wise count rates for Quadrant D Data is divided into 100 sec bins |
 |
 |
| Parameter | Plot |
|---|---|
| CZT HV Monitor | 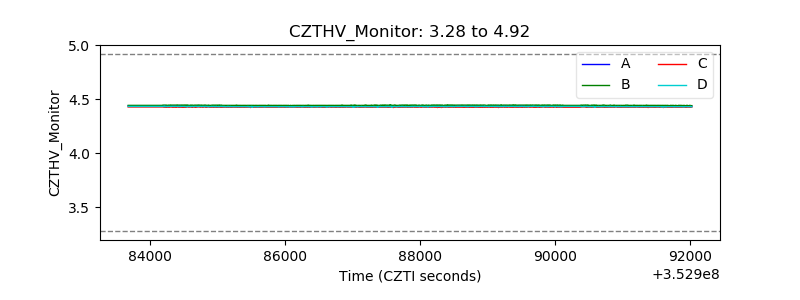 |
| D_VDD | 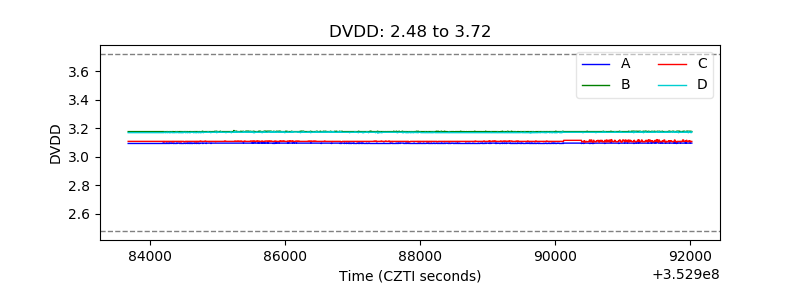 |
| Temperature 1 | 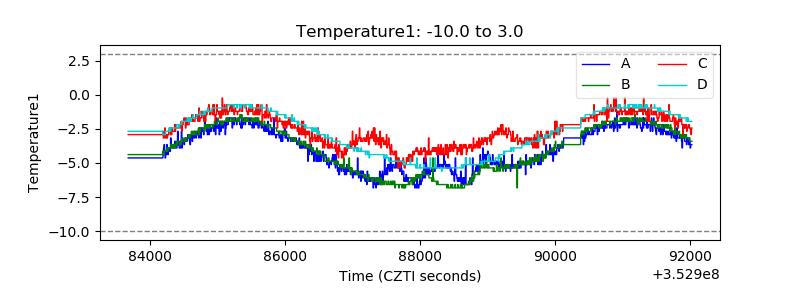 |
| Veto HV Monitor | 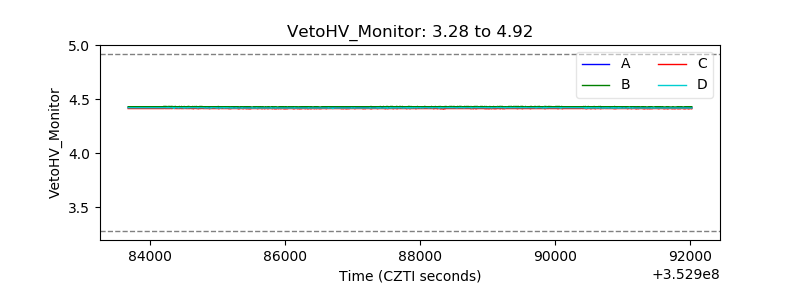 |
| Veto LLD | 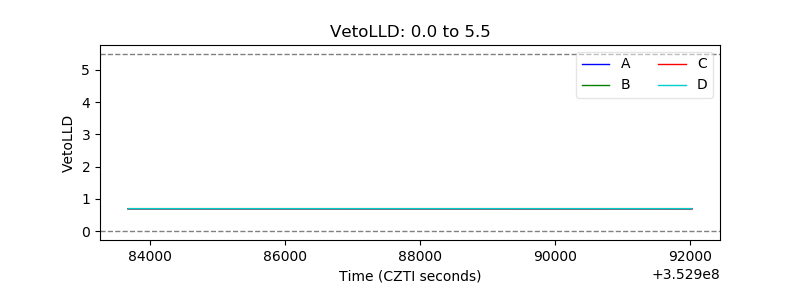 |
| Alpha Counter | 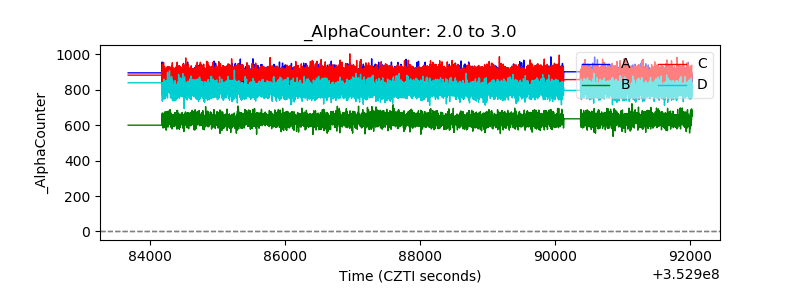 |
| _CPM_Rate | 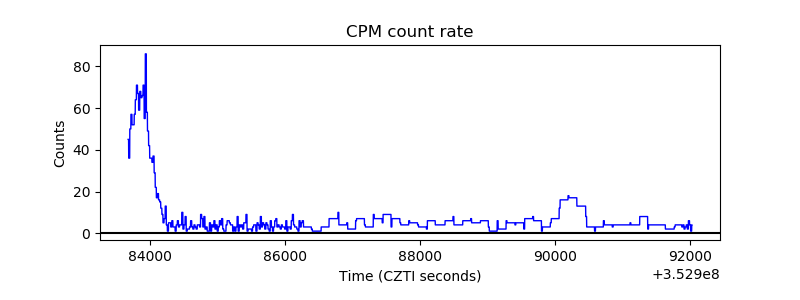 |
| CZT Counter | 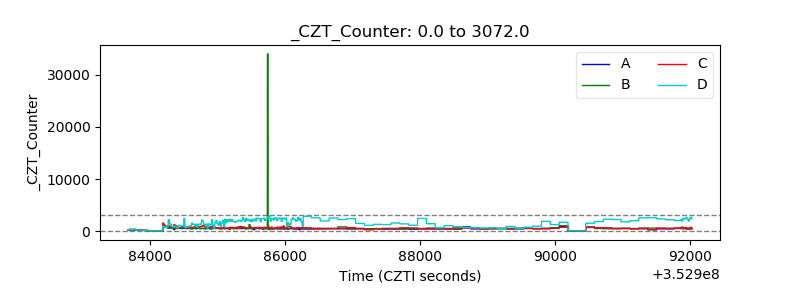 |
| +2.5 Volts monitor |  |
| +5 Volts monitor |  |
| _ROLL_ROT | 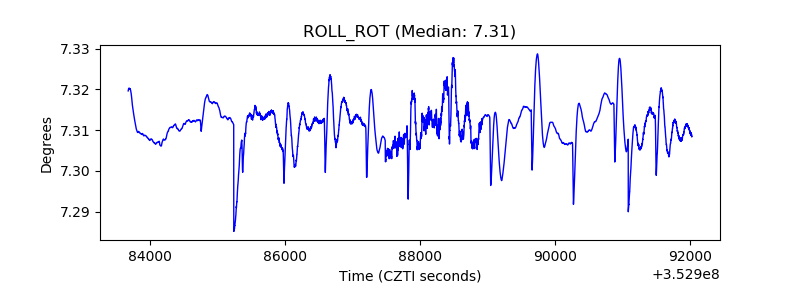 |
| _Roll_DEC | 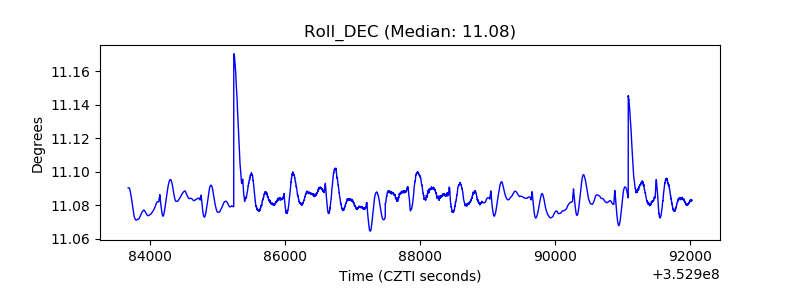 |
| _Roll_RA | 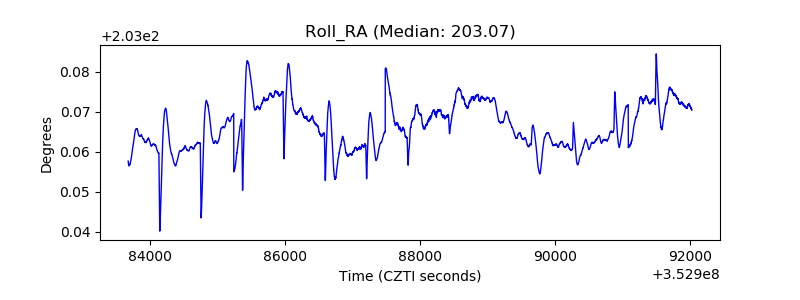 |
| Veto Counter | 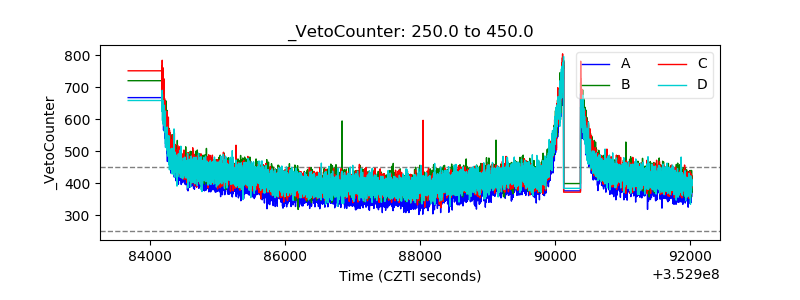 |