| Param | Original file | Final file |
|---|---|---|
| Filename | modeM0/AS1A10_110T02_9000004234_29447cztM0_level2.evt | modeM0/AS1A10_110T02_9000004234_29447cztM0_level2_quad_clean.evt |
| Size (bytes) | 818,870,400 | 78,433,920 |
| Size | 780.9 MB | 74.8 MB |
| Events in quadrant A | 3,648,073 | 477,142 |
| Events in quadrant B | 3,801,100 | 482,913 |
| Events in quadrant C | 4,048,825 | 463,812 |
| Events in quadrant D | 12,793,327 | 428,351 |
| Mode SS | |||
|---|---|---|---|
| Quadrant | BADHDUFLAG | Total packets | Discarded packets |
| A | 0 | 152 | 0 |
| B | 0 | 152 | 0 |
| C | 0 | 152 | 0 |
| D | 0 | 152 | 0 |
| Mode M0 | |||
|---|---|---|---|
| Quadrant | BADHDUFLAG | Total packets | Discarded packets |
| A | 0 | 15521 | 2 |
| B | 0 | 15889 | 2 |
| C | 0 | 16445 | 2 |
| D | 0 | 43147 | 8 |
| Quadrant | Total seconds | Saturated seconds | Saturation percentage |
|---|---|---|---|
| A | 7501 | 121 | 1.613118% |
| B | 7502 | 186 | 2.479339% |
| C | 7502 | 269 | 3.585710% |
| D | 7501 | 4009 | 53.446207% |
Noise dominated data is calculated using 1-second bins in cleaned event files. If a bin has >2000 counts, and if more than 50% of those come from <1% of pixels, then it is considered to be noise-dominated and hence unusable.
| Quadrant | # 1 sec bins | Bins with >0 counts | Bins with >2000 counts | High rate bins dominated by noise | Noise dominated (total time) | Noise dominated (detector-on time) | Marked lightcurve |
|---|---|---|---|---|---|---|---|
| A | 7616 | 7503 | 0 | 0 | 0.00% | 0.00% | 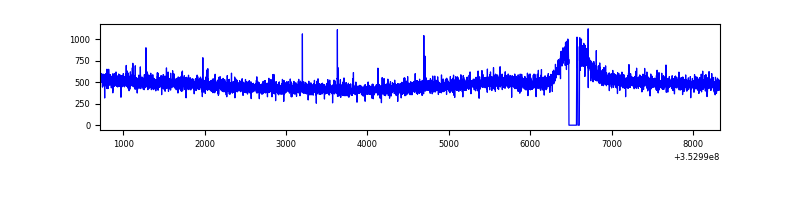 |
| B | 7617 | 7504 | 10 | 10 | 0.13% | 0.13% | 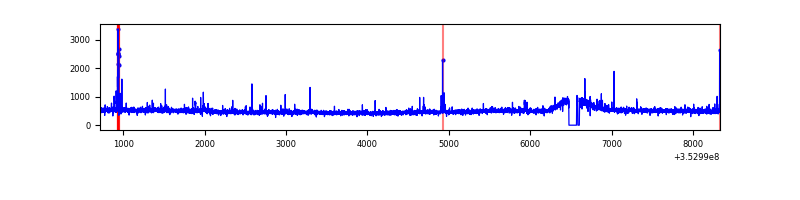 |
| C | 7617 | 7504 | 1 | 1 | 0.01% | 0.01% | 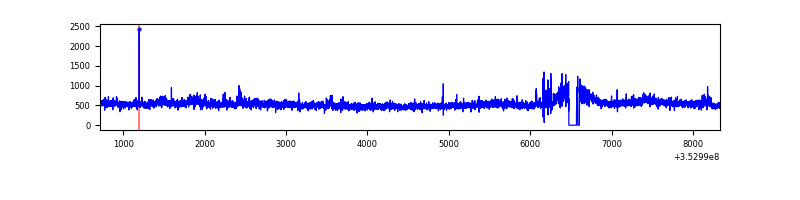 |
| D | 7616 | 7503 | 3007 | 3007 | 39.48% | 40.08% | 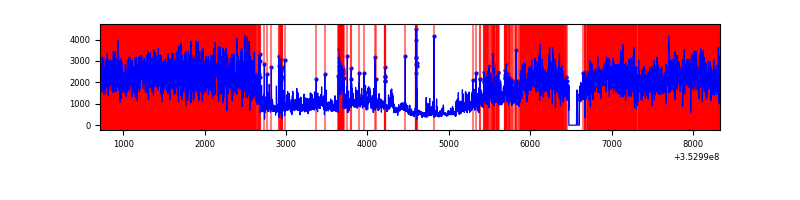 |
Top three noisy pixels from each quadrant. If the there are fewer than three noisy pixels in the level2.evt file, extra rows are filled as -1
| Pixel properties | Quadrant properties | ||||||
|---|---|---|---|---|---|---|---|
| Quadrant | DetID | PixID | Counts | Sigma | Mean | Median | Sigma |
| A | 13 | 254 | 12949 | 62.47 | 943 | 921 | 192.5 |
| A | 3 | 137 | 9436 | 44.23 | 943 | 921 | 192.5 |
| A | 0 | 226 | 8085 | 37.21 | 943 | 921 | 192.5 |
| B | 0 | 156 | 49602 | 269.98 | 931 | 906 | 180.4 |
| B | 0 | 229 | 39924 | 216.32 | 931 | 906 | 180.4 |
| B | 0 | 189 | 25287 | 135.17 | 931 | 906 | 180.4 |
| C | 3 | 233 | 318742 | 1511.57 | 895 | 901 | 210.3 |
| C | 14 | 238 | 160765 | 760.27 | 895 | 901 | 210.3 |
| C | 14 | 254 | 23858 | 109.18 | 895 | 901 | 210.3 |
| D | 12 | 33 | 4815952 | 27404.02 | 726 | 706 | 175.7 |
| D | 7 | 80 | 2157665 | 12275.46 | 726 | 706 | 175.7 |
| D | 13 | 104 | 2049189 | 11658.11 | 726 | 706 | 175.7 |
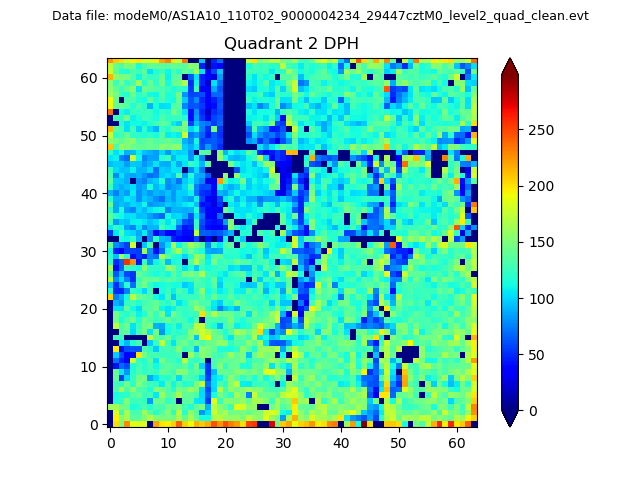
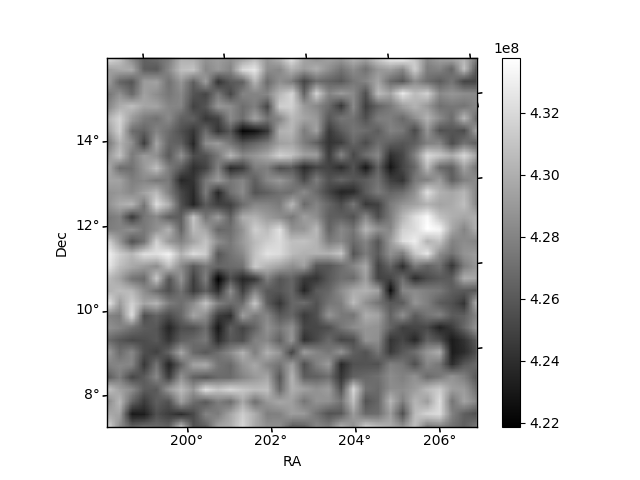
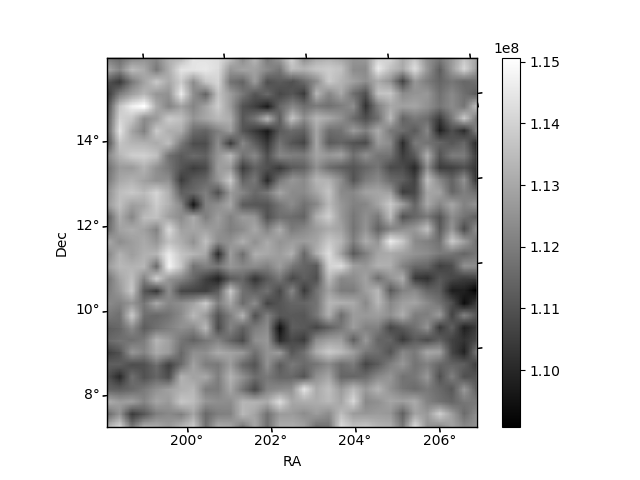
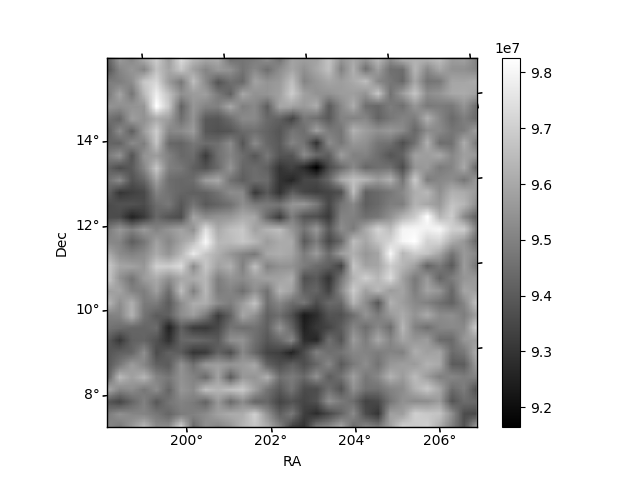
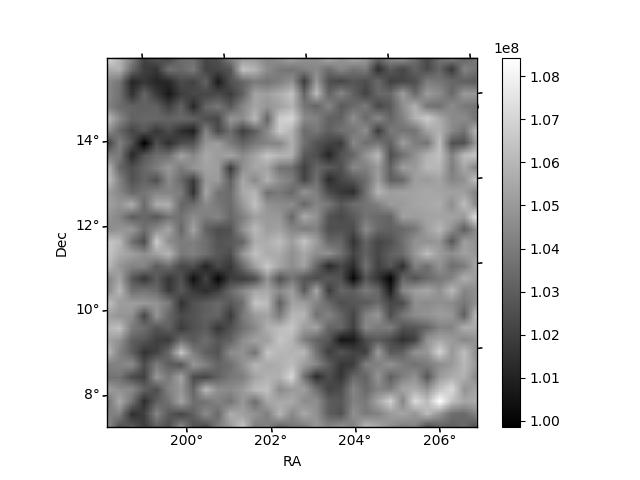
Histogram calculated using DETX and DETY for each event in the final _common_clean file
| Quadrant A | 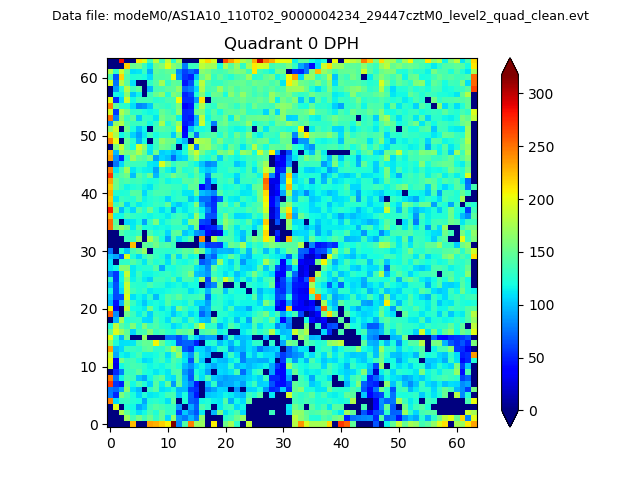 |
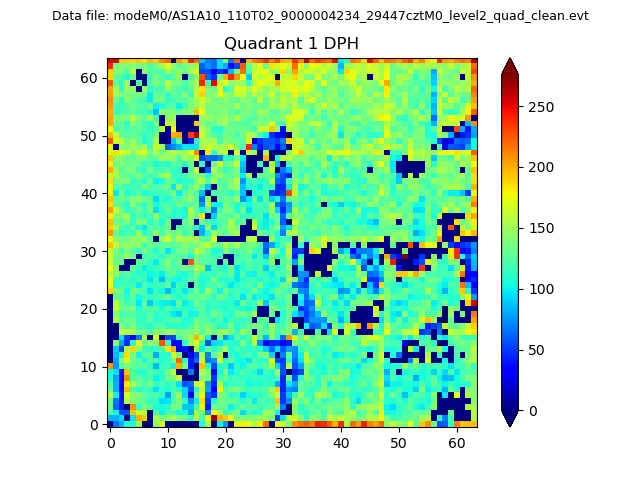 |
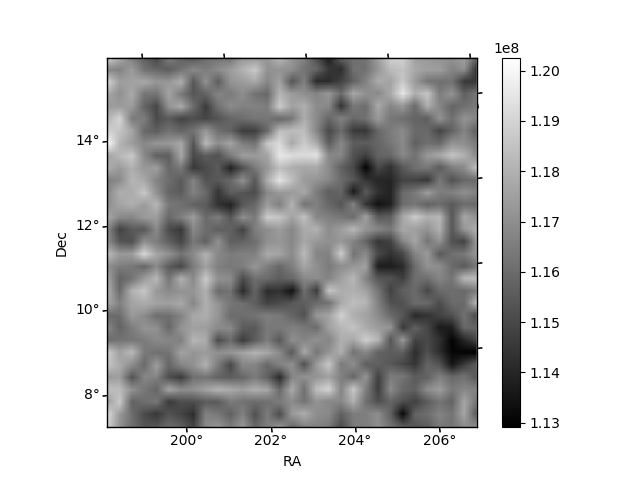
Quadrant B |
|---|---|---|---|
| Quadrant D | 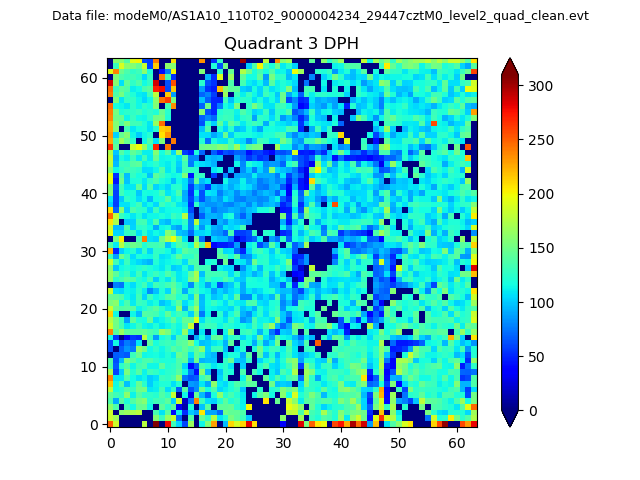 |
 |
Quadrant C |
| Plot type | Count rate plots | Images |
|---|---|---|
| Comparison with Poisson distribution Blue bars denote a histogram of data divided into 1 sec bins. Red curve is a Poisson curve with rate = median count rate of data. |
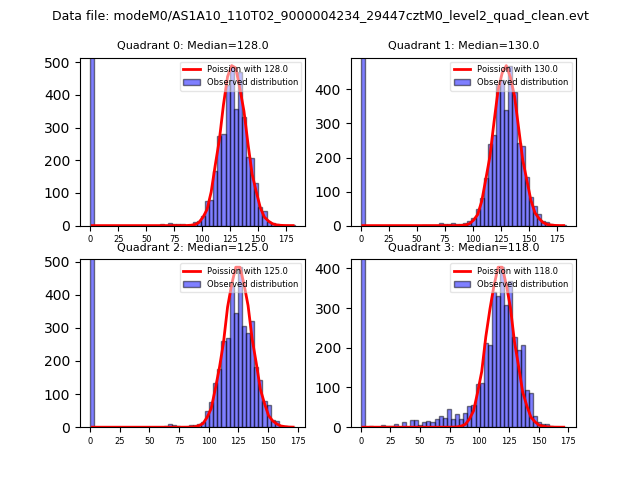 |
 |
| Quadrant-wise count rates Data is divided into 100 sec bins |
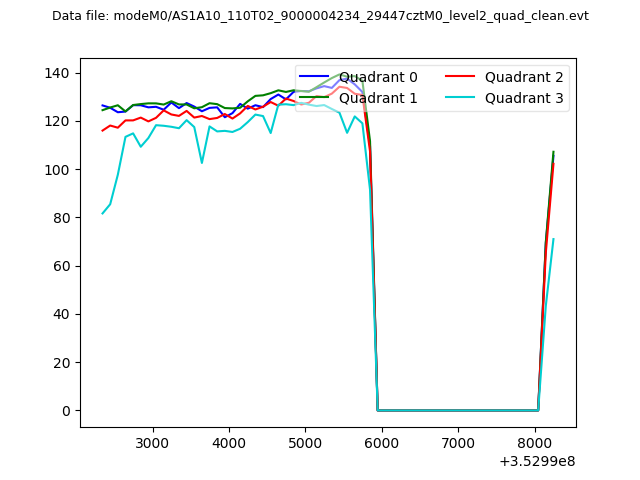 |
|
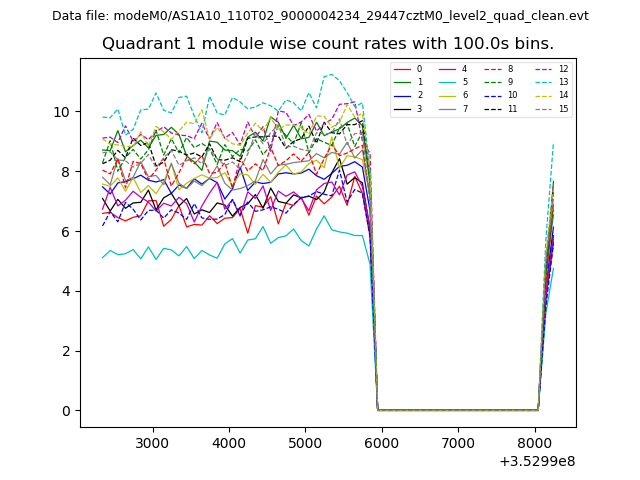
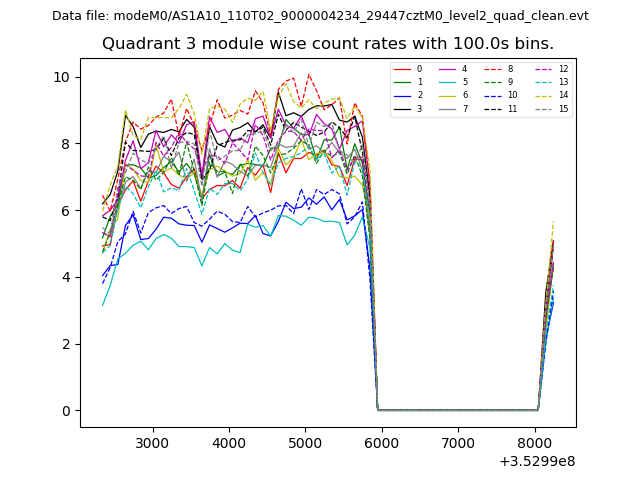
| Module-wise count rates for Quadrant A Data is divided into 100 sec bins |
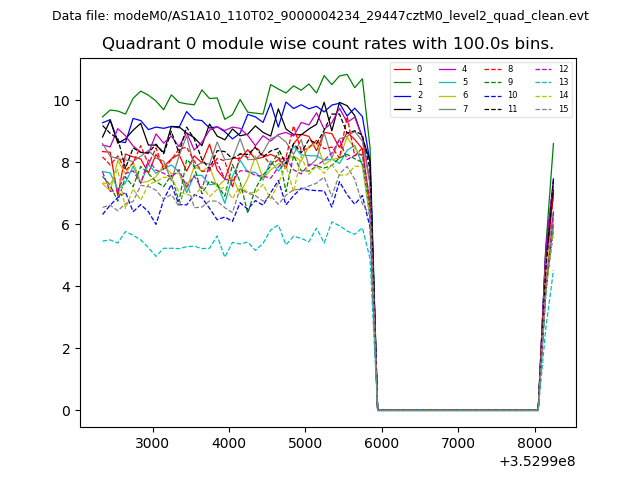 |
 |
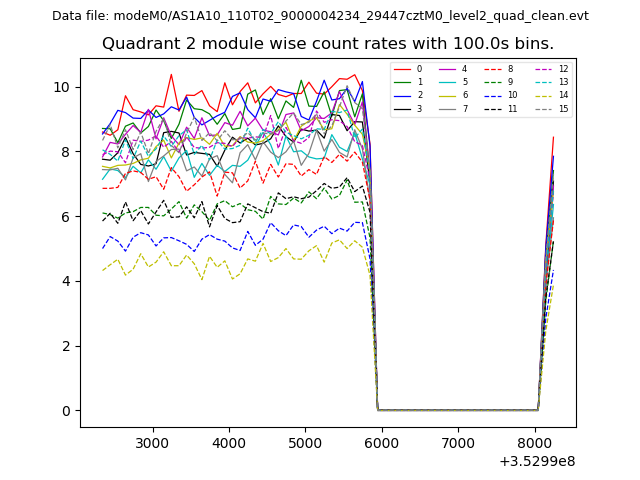
| Module-wise count rates for Quadrant B Data is divided into 100 sec bins |
 |
 |
| Module-wise count rates for Quadrant C Data is divided into 100 sec bins |
 |
 |
| Module-wise count rates for Quadrant D Data is divided into 100 sec bins |
 |
 |
| Parameter | Plot |
|---|---|
| CZT HV Monitor | 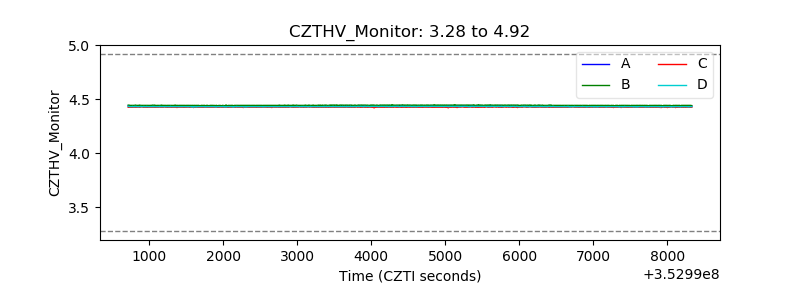 |
| D_VDD | 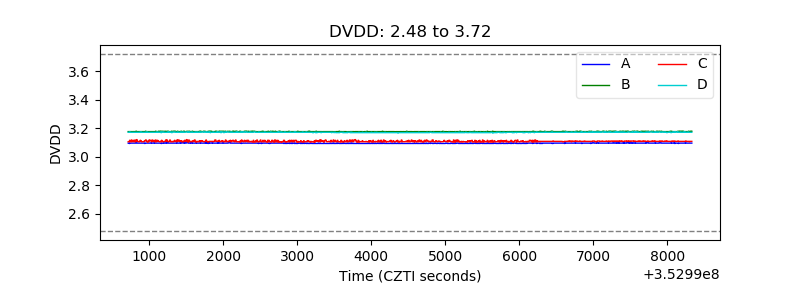 |
| Temperature 1 | 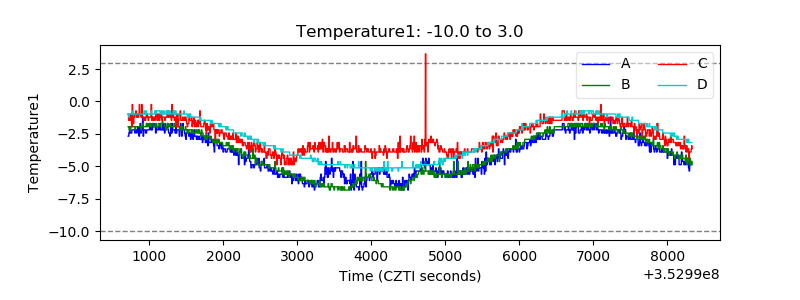 |
| Veto HV Monitor | 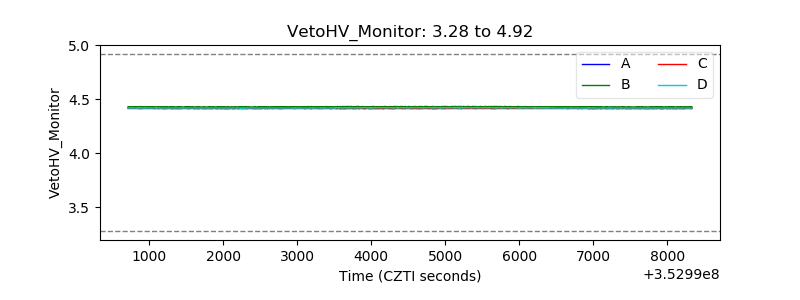 |
| Veto LLD | 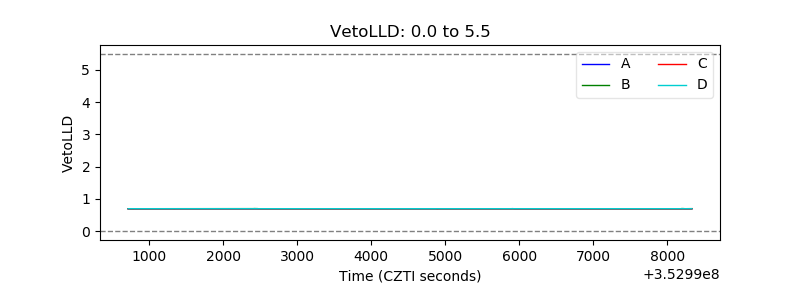 |
| Alpha Counter | 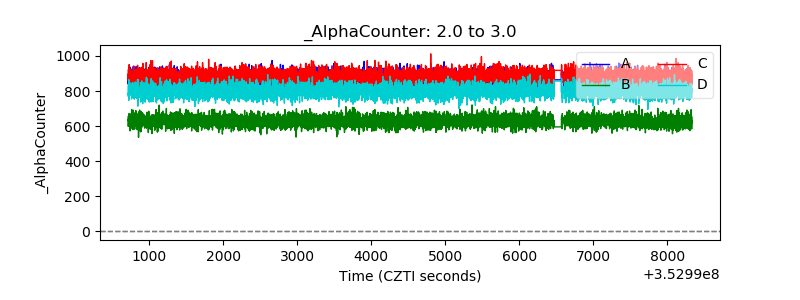 |
| _CPM_Rate | 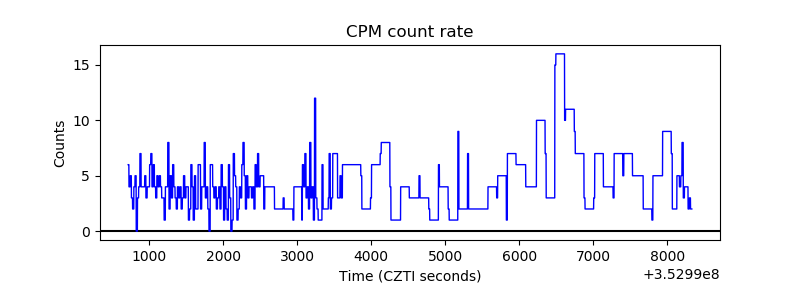 |
| CZT Counter | 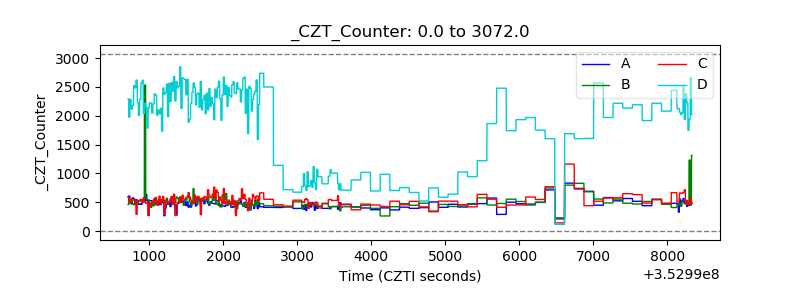 |
| +2.5 Volts monitor |  |
| +5 Volts monitor |  |
| _ROLL_ROT | 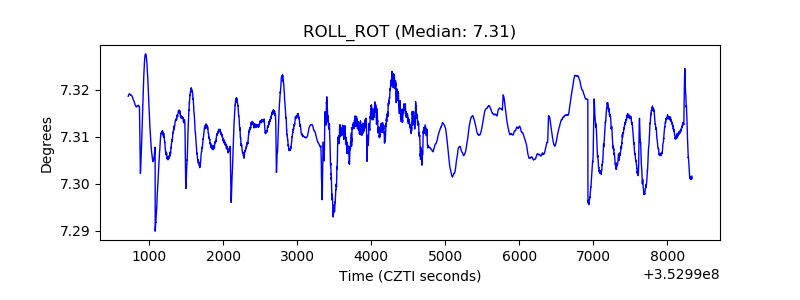 |
| _Roll_DEC | 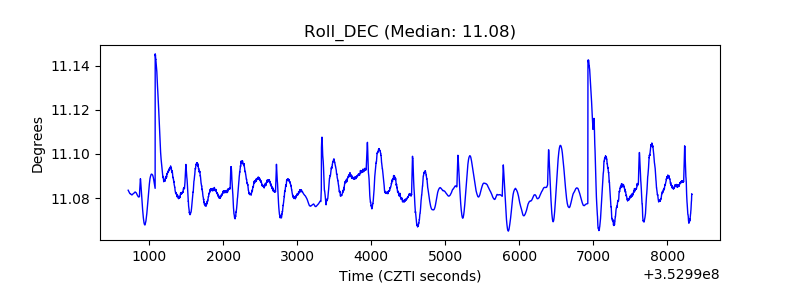 |
| _Roll_RA | 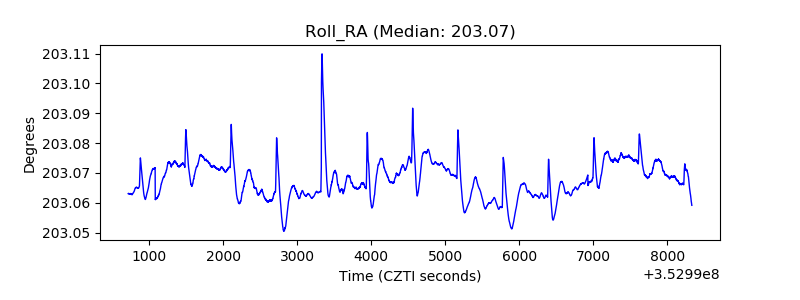 |
| Veto Counter | 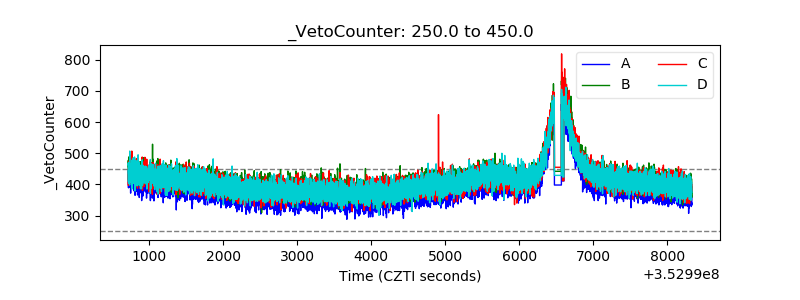 |