| Param | Original file | Final file |
|---|---|---|
| Filename | modeM0/AS1A10_110T02_9000004234_29452cztM0_level2.evt | modeM0/AS1A10_110T02_9000004234_29452cztM0_level2_quad_clean.evt |
| Size (bytes) | 1,212,768,000 | 156,960,000 |
| Size | 1.1 GB | 149.7 MB |
| Events in quadrant A | 6,069,928 | 998,837 |
| Events in quadrant B | 6,276,689 | 1,009,328 |
| Events in quadrant C | 6,365,285 | 979,624 |
| Events in quadrant D | 17,155,434 | 882,329 |
| Mode SS | |||
|---|---|---|---|
| Quadrant | BADHDUFLAG | Total packets | Discarded packets |
| A | 0 | 264 | 0 |
| B | 0 | 264 | 0 |
| C | 0 | 264 | 0 |
| D | 0 | 264 | 0 |
| Mode M0 | |||
|---|---|---|---|
| Quadrant | BADHDUFLAG | Total packets | Discarded packets |
| A | 0 | 26274 | 3 |
| B | 0 | 26802 | 3 |
| C | 0 | 26928 | 3 |
| D | 0 | 59954 | 3 |
| Mode M9 | |||
|---|---|---|---|
| Quadrant | BADHDUFLAG | Total packets | Discarded packets |
| A | 0 | 16 | 0 |
| B | 0 | 16 | 0 |
| C | 0 | 16 | 0 |
| D | 0 | 16 | 0 |
| Quadrant | Total seconds | Saturated seconds | Saturation percentage |
|---|---|---|---|
| A | 12767 | 85 | 0.665779% |
| B | 12768 | 156 | 1.221805% |
| C | 12768 | 303 | 2.373120% |
| D | 12768 | 2756 | 21.585213% |
Noise dominated data is calculated using 1-second bins in cleaned event files. If a bin has >2000 counts, and if more than 50% of those come from <1% of pixels, then it is considered to be noise-dominated and hence unusable.
| Quadrant | # 1 sec bins | Bins with >0 counts | Bins with >2000 counts | High rate bins dominated by noise | Noise dominated (total time) | Noise dominated (detector-on time) | Marked lightcurve |
|---|---|---|---|---|---|---|---|
| A | 14482 | 12770 | 0 | 0 | 0.00% | 0.00% | 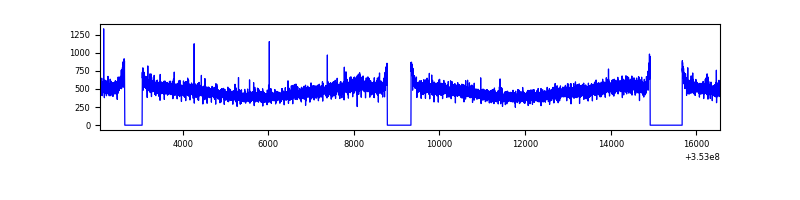 |
| B | 14483 | 12771 | 6 | 6 | 0.04% | 0.05% | 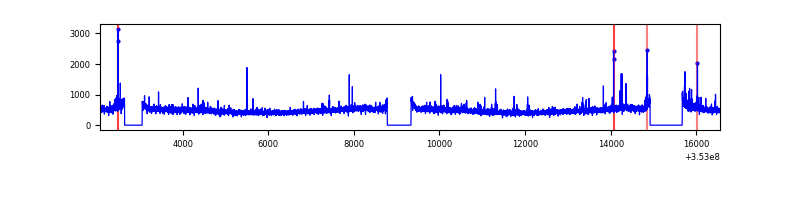 |
| C | 14483 | 12771 | 5 | 5 | 0.03% | 0.04% | 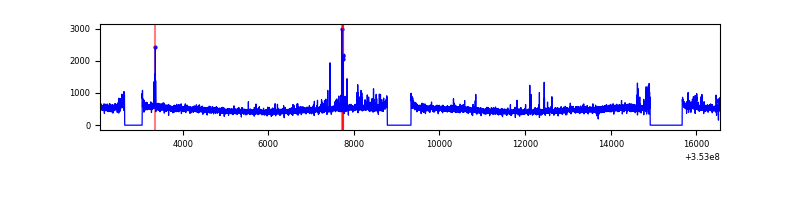 |
| D | 14483 | 12770 | 2056 | 2056 | 14.20% | 16.10% | 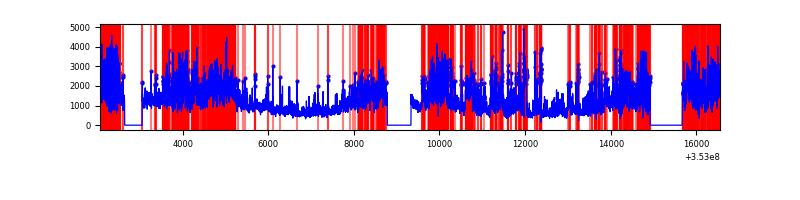 |
Top three noisy pixels from each quadrant. If the there are fewer than three noisy pixels in the level2.evt file, extra rows are filled as -1
| Pixel properties | Quadrant properties | ||||||
|---|---|---|---|---|---|---|---|
| Quadrant | DetID | PixID | Counts | Sigma | Mean | Median | Sigma |
| A | 13 | 254 | 23632 | 69.9 | 1571 | 1543 | 316.0 |
| A | 3 | 137 | 15815 | 45.16 | 1571 | 1543 | 316.0 |
| A | 0 | 226 | 13417 | 37.58 | 1571 | 1543 | 316.0 |
| B | 0 | 229 | 69148 | 227.48 | 1554 | 1515 | 297.3 |
| B | 12 | 111 | 37981 | 122.65 | 1554 | 1515 | 297.3 |
| B | 11 | 111 | 34131 | 109.7 | 1554 | 1515 | 297.3 |
| C | 14 | 238 | 273284 | 773.62 | 1500 | 1509 | 351.3 |
| C | 3 | 233 | 103527 | 290.4 | 1500 | 1509 | 351.3 |
| C | 9 | 54 | 56713 | 157.14 | 1500 | 1509 | 351.3 |
| D | 8 | 195 | 4379396 | 12969.21 | 1417 | 1375 | 337.6 |
| D | 12 | 33 | 2615969 | 7745.33 | 1417 | 1375 | 337.6 |
| D | 13 | 104 | 2166180 | 6412.9 | 1417 | 1375 | 337.6 |
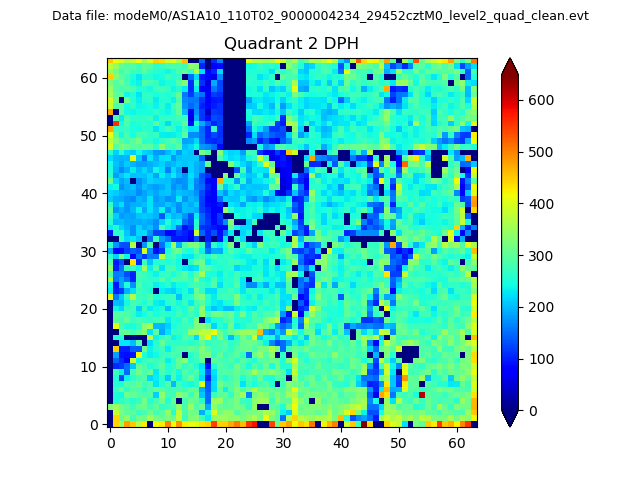
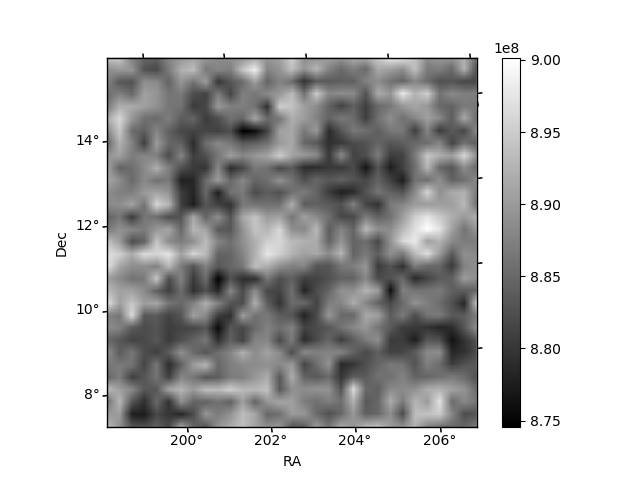
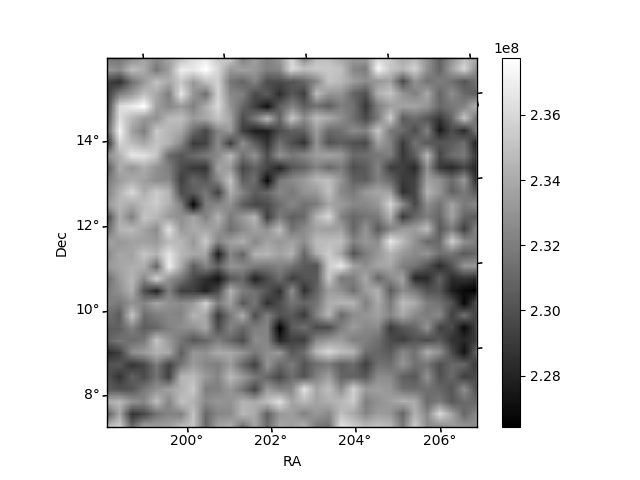
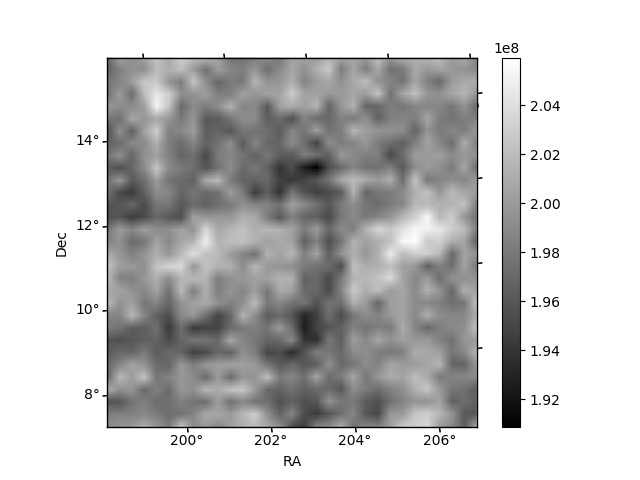
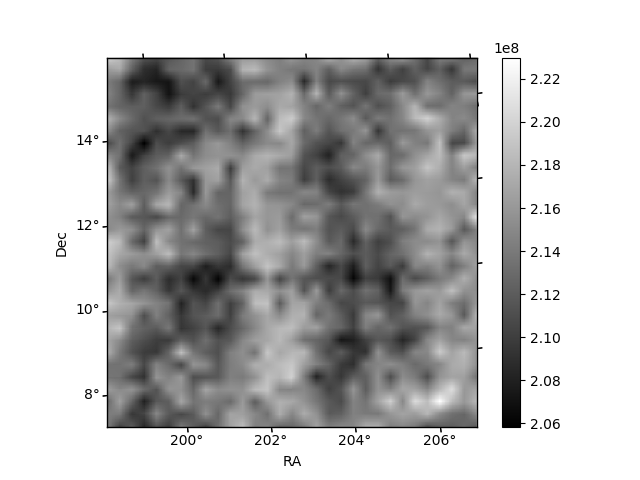
Histogram calculated using DETX and DETY for each event in the final _common_clean file
| Quadrant A | 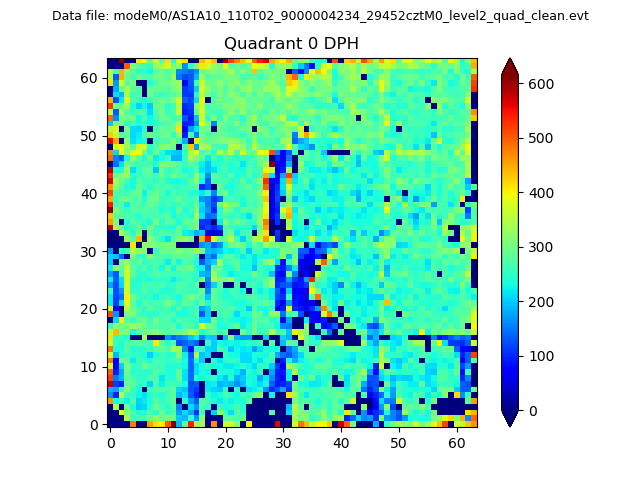 |
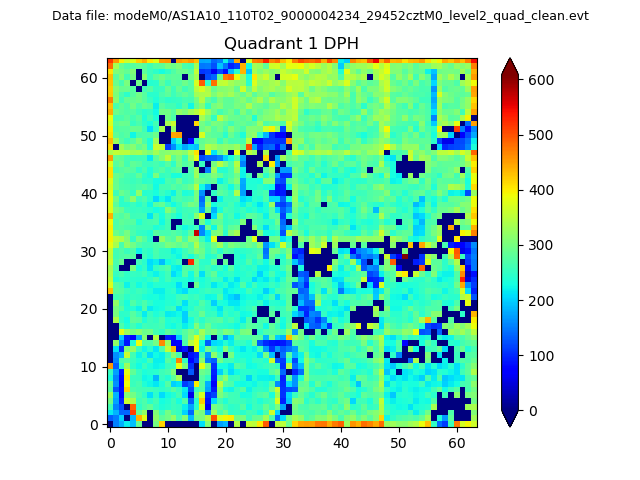 |
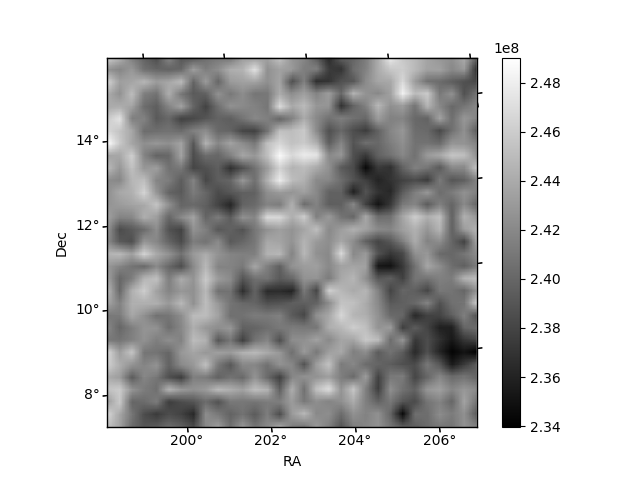
Quadrant B |
|---|---|---|---|
| Quadrant D | 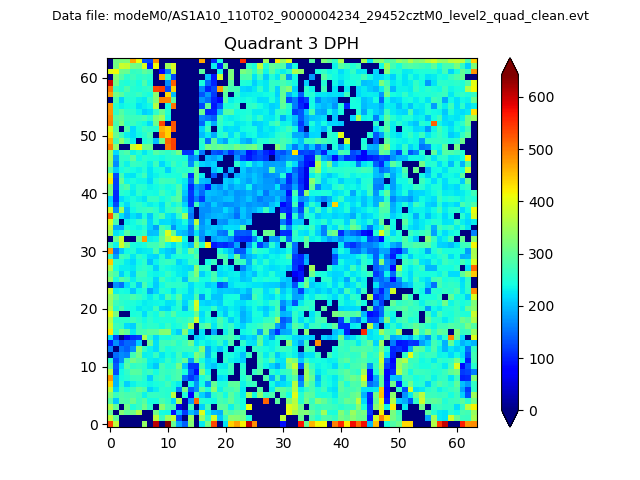 |
 |
Quadrant C |
| Plot type | Count rate plots | Images |
|---|---|---|
| Comparison with Poisson distribution Blue bars denote a histogram of data divided into 1 sec bins. Red curve is a Poisson curve with rate = median count rate of data. |
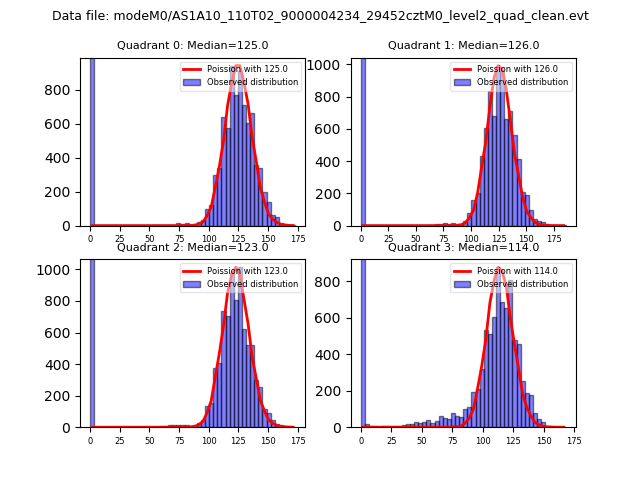 |
 |
| Quadrant-wise count rates Data is divided into 100 sec bins |
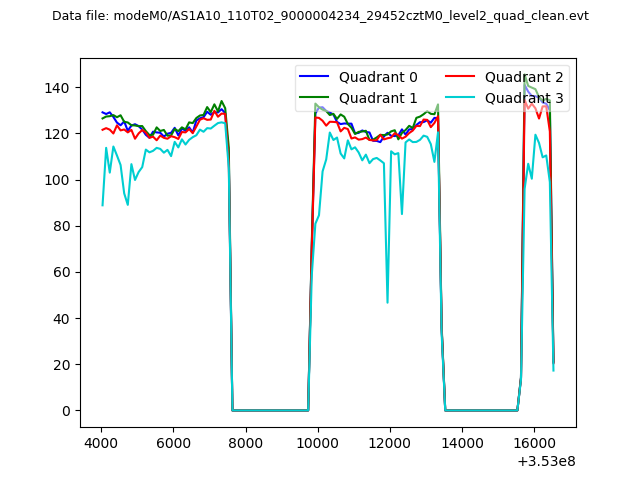 |
|
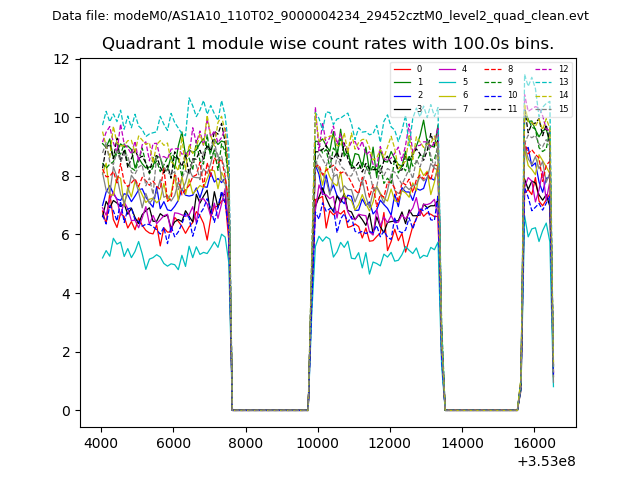
| Module-wise count rates for Quadrant A Data is divided into 100 sec bins |
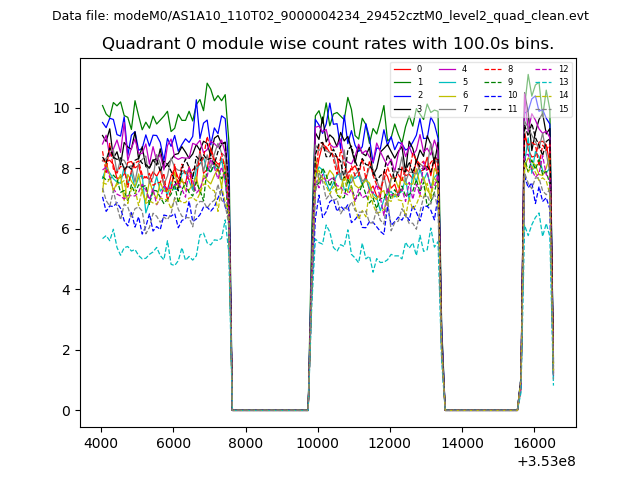 |
 |
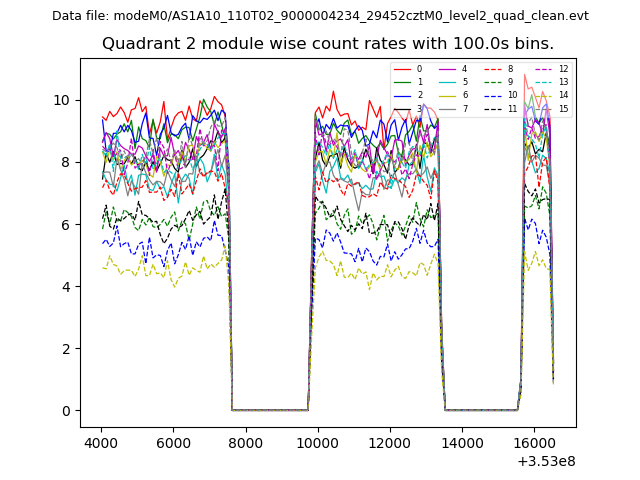
| Module-wise count rates for Quadrant B Data is divided into 100 sec bins |
 |
 |
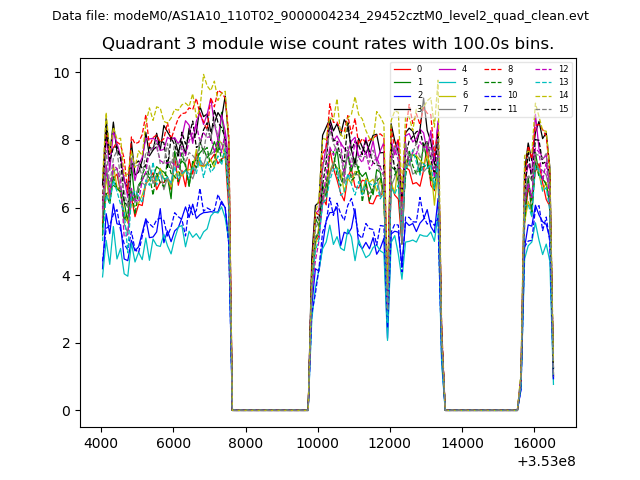
| Module-wise count rates for Quadrant C Data is divided into 100 sec bins |
 |
 |
| Module-wise count rates for Quadrant D Data is divided into 100 sec bins |
 |
 |
| Parameter | Plot |
|---|---|
| CZT HV Monitor | 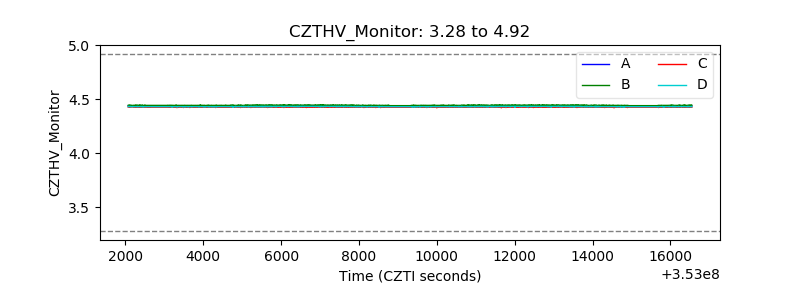 |
| D_VDD | 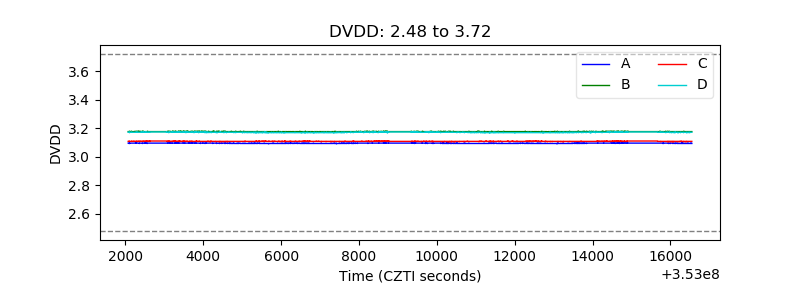 |
| Temperature 1 | 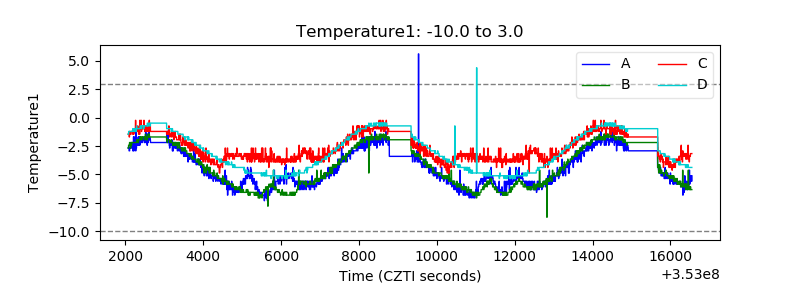 |
| Veto HV Monitor | 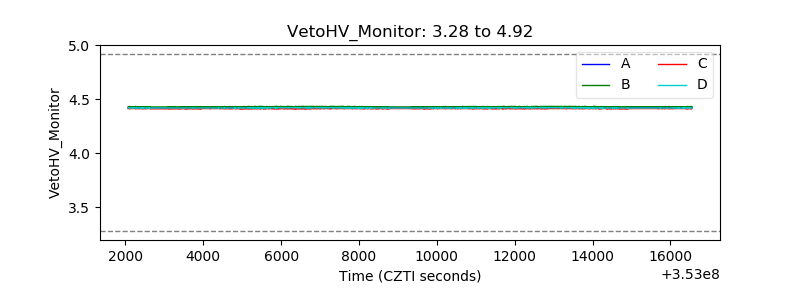 |
| Veto LLD | 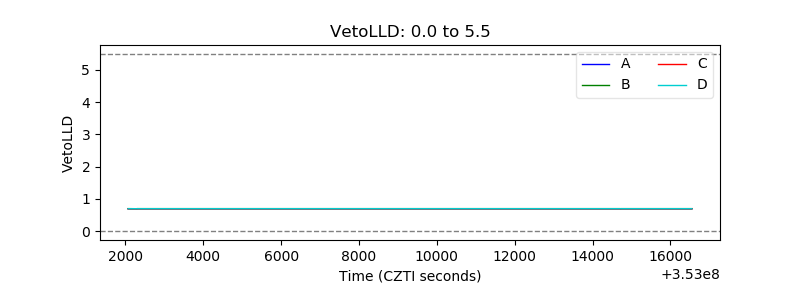 |
| Alpha Counter | 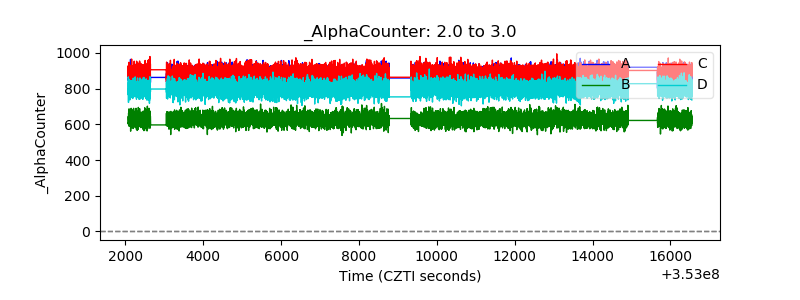 |
| _CPM_Rate | 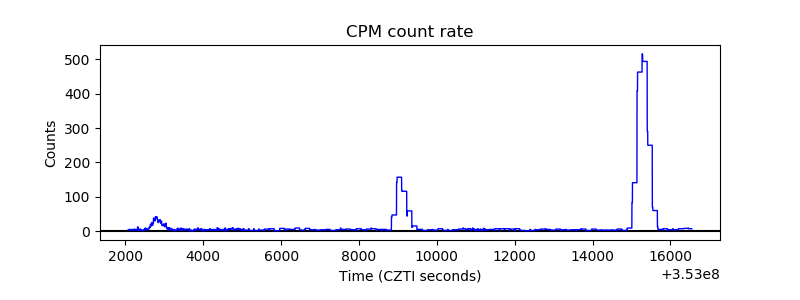 |
| CZT Counter | 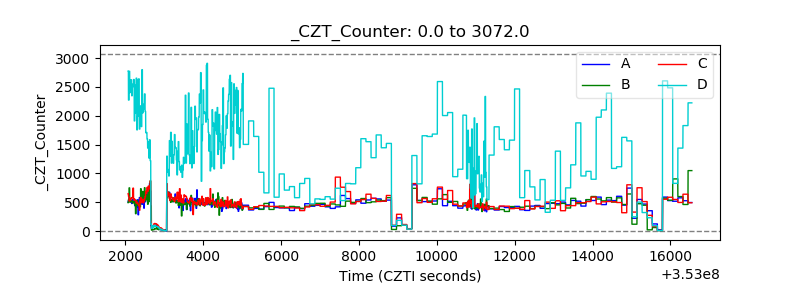 |
| +2.5 Volts monitor | 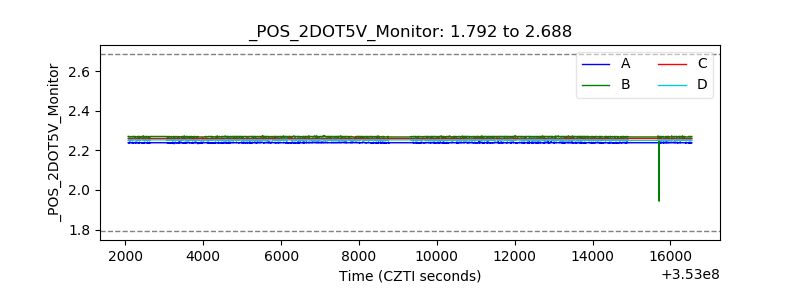 |
| +5 Volts monitor | 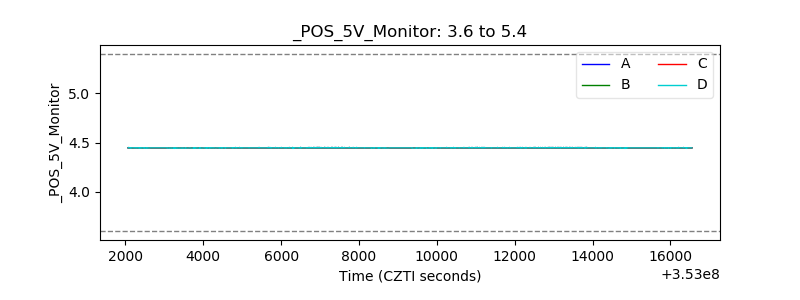 |
| _ROLL_ROT | 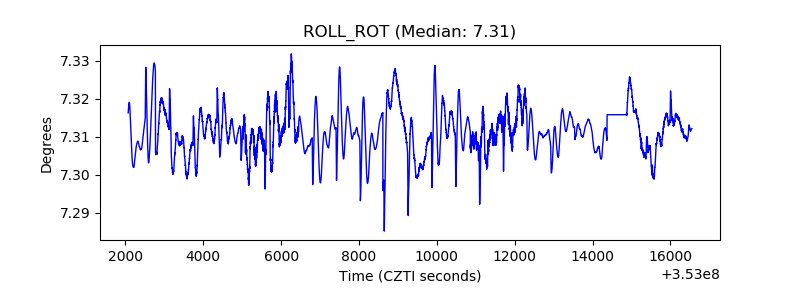 |
| _Roll_DEC | 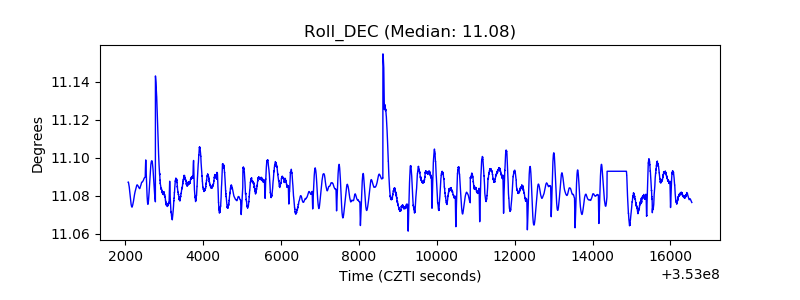 |
| _Roll_RA | 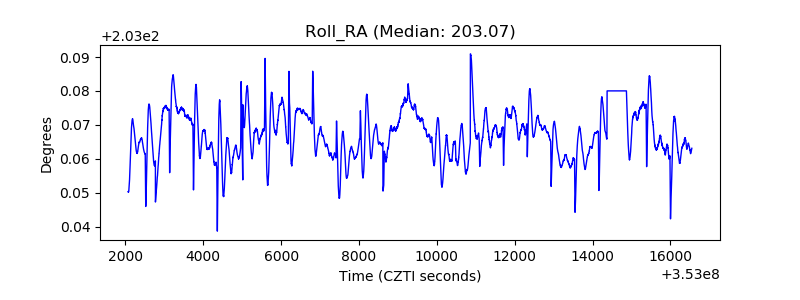 |
| Veto Counter | 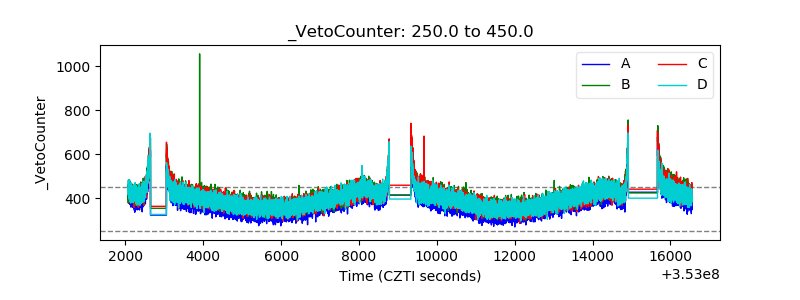 |