| Param | Original file | Final file |
|---|---|---|
| Filename | modeM0/AS1A10_094T01_9000004236cztM0_level2.fits | modeM0/AS1A10_094T01_9000004236cztM0_level2_quad_clean.evt |
| Size (bytes) | 42,454,080 | 31,305,600 |
| Size | 40.5 MB | 29.9 MB |
| Events in quadrant A | 276,822 | 199,903 |
| Events in quadrant B | 266,316 | 201,825 |
| Events in quadrant C | 263,600 | 185,403 |
| Events in quadrant D | 146,148 | 28,533 |
| Mode SS | |||
|---|---|---|---|
| Quadrant | BADHDUFLAG | Total packets | Discarded packets |
| A | 0 | 96 | 0 |
| B | 0 | 96 | 0 |
| C | 0 | 96 | 0 |
| D | 0 | 96 | 0 |
| Mode M0 | |||
|---|---|---|---|
| Quadrant | BADHDUFLAG | Total packets | Discarded packets |
| A | 0 | 9576 | 0 |
| B | 0 | 9925 | 0 |
| C | 0 | 10241 | 0 |
| D | 0 | 34899 | 0 |
| Mode M9 | |||
|---|---|---|---|
| Quadrant | BADHDUFLAG | Total packets | Discarded packets |
| A | 0 | 9 | 0 |
| B | 0 | 9 | 0 |
| C | 0 | 9 | 0 |
| D | 0 | 9 | 0 |
| Quadrant | Total seconds | Saturated seconds | Saturation percentage |
|---|---|---|---|
| A | 4718 | 16 | 0.339127% |
| B | 4718 | 30 | 0.635863% |
| C | 4718 | 251 | 5.320051% |
| D | 4718 | 3540 | 75.031793% |
Noise dominated data is calculated using 1-second bins in cleaned event files. If a bin has >2000 counts, and if more than 50% of those come from <1% of pixels, then it is considered to be noise-dominated and hence unusable.
| Quadrant | # 1 sec bins | Bins with >0 counts | Bins with >2000 counts | High rate bins dominated by noise | Noise dominated (total time) | Noise dominated (detector-on time) | Marked lightcurve |
|---|---|---|---|---|---|---|---|
| A | 5643 | 4718 | 0 | 0 | 0.00% | 0.00% |  |
| B | 5643 | 4718 | 0 | 0 | 0.00% | 0.00% | 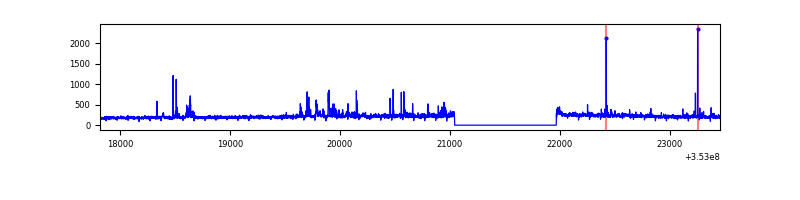 |
| C | 5643 | 4713 | 0 | 0 | 0.00% | 0.00% |  |
| D | 5643 | 4697 | 0 | 0 | 0.00% | 0.00% | 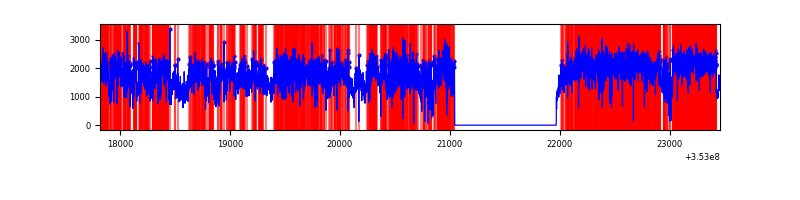 |
Top three noisy pixels from each quadrant. If the there are fewer than three noisy pixels in the level2.evt file, extra rows are filled as -1
| Pixel properties | Quadrant properties | ||||||
|---|---|---|---|---|---|---|---|
| Quadrant | DetID | PixID | Counts | Sigma | Mean | Median | Sigma |
| A | 0 | 29 | 266 | 9.97 | 72 | 68 | 19.9 |
| A | 7 | 110 | 234 | 8.36 | 72 | 68 | 19.9 |
| A | 15 | 236 | 231 | 8.2 | 72 | 68 | 19.9 |
| B | 2 | 9 | 193 | 7.84 | 70 | 67 | 16.1 |
| B | 5 | 232 | 186 | 7.4 | 70 | 67 | 16.1 |
| B | 2 | 8 | 185 | 7.34 | 70 | 67 | 16.1 |
| C | 1 | 81 | 219 | 8.07 | 69 | 65 | 19.1 |
| C | 3 | 203 | 206 | 7.39 | 69 | 65 | 19.1 |
| C | 3 | 202 | 205 | 7.34 | 69 | 65 | 19.1 |
| D | 7 | 3 | 136 | 7.76 | 41 | 38 | 12.6 |
| D | 4 | 246 | 125 | 6.89 | 41 | 38 | 12.6 |
| D | 10 | 189 | 123 | 6.73 | 41 | 38 | 12.6 |
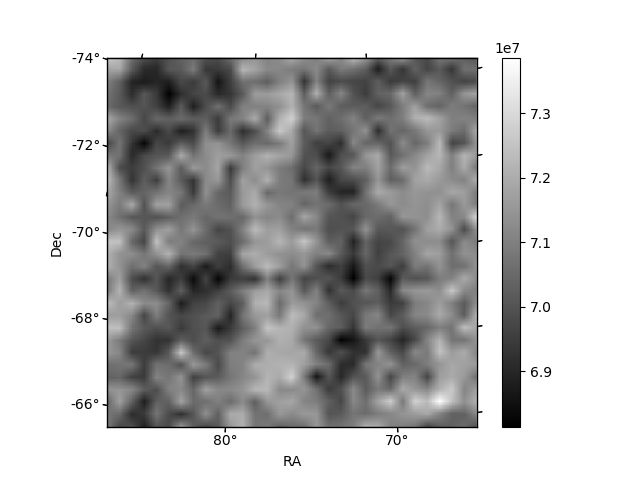
Histogram calculated using DETX and DETY for each event in the final _common_clean file
| Quadrant A | 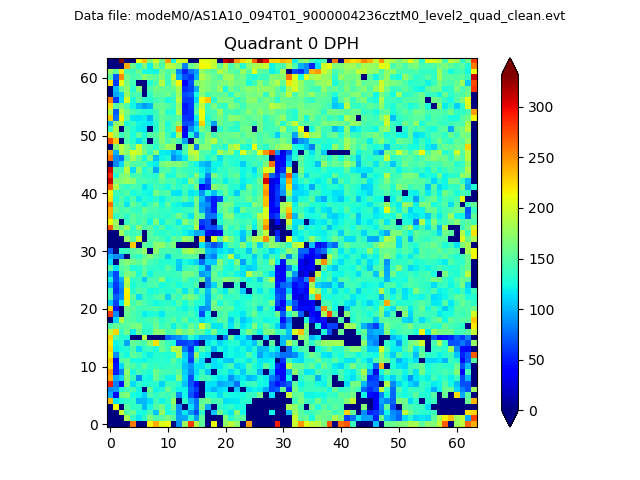 |
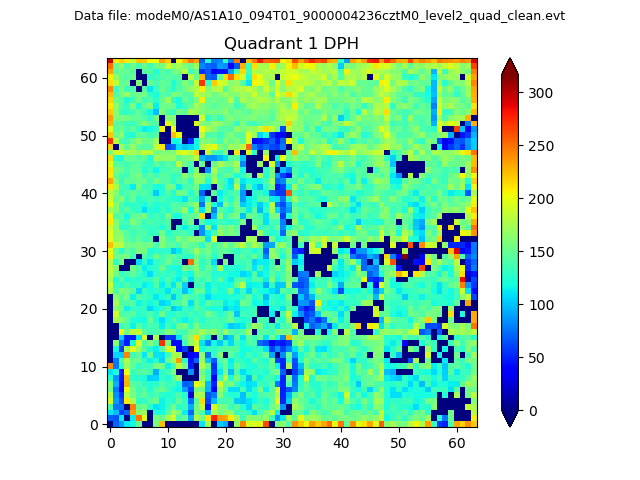 |
Quadrant B |
|---|---|---|---|
| Quadrant D |  |
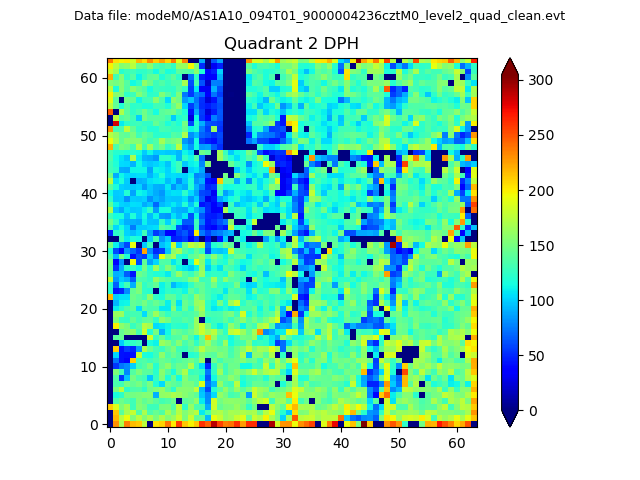 |
Quadrant C |
| Plot type | Count rate plots | Images |
|---|---|---|
| Comparison with Poisson distribution Blue bars denote a histogram of data divided into 1 sec bins. Red curve is a Poisson curve with rate = median count rate of data. |
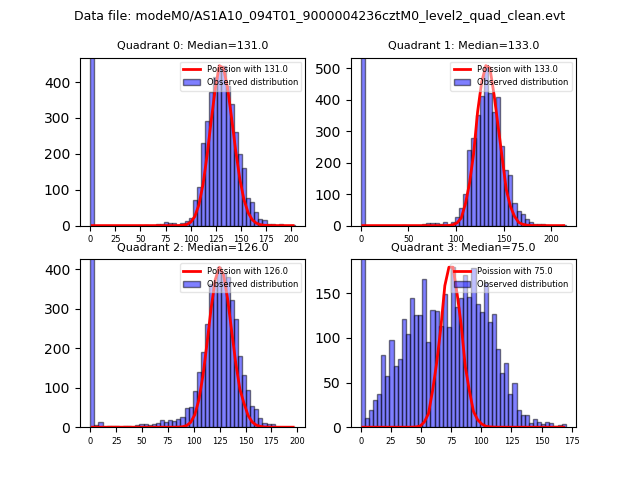 |
 |
| Quadrant-wise count rates Data is divided into 100 sec bins |
 |
|
| Module-wise count rates for Quadrant A Data is divided into 100 sec bins |
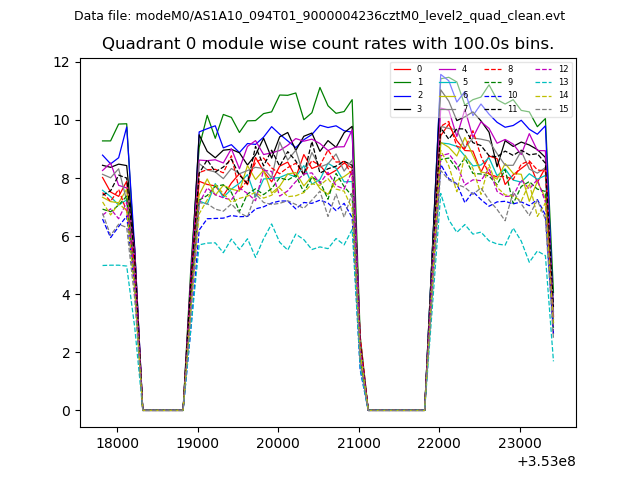 |
 |
| Module-wise count rates for Quadrant B Data is divided into 100 sec bins |
 |
 |
| Module-wise count rates for Quadrant C Data is divided into 100 sec bins |
 |
 |
| Module-wise count rates for Quadrant D Data is divided into 100 sec bins |
 |
 |
| Parameter | Plot |
|---|---|
| CZT HV Monitor |  |
| D_VDD | 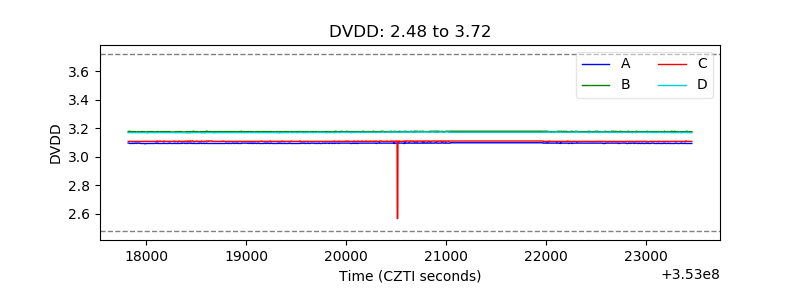 |
| Temperature 1 |  |
| Veto HV Monitor | 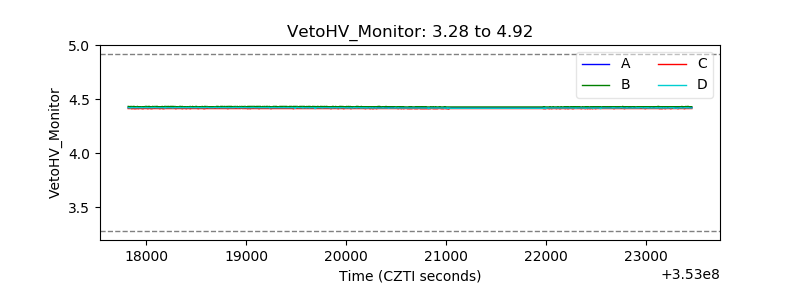 |
| Veto LLD | 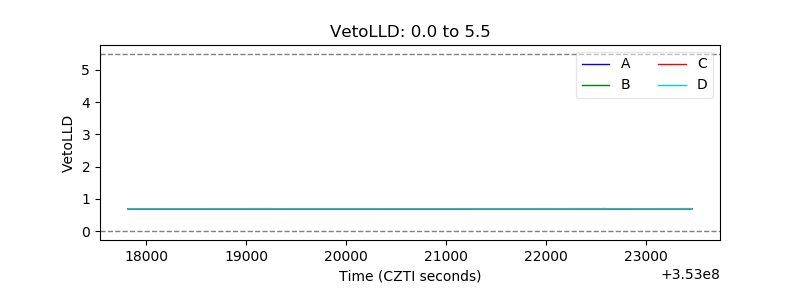 |
| Alpha Counter |  |
| _CPM_Rate | 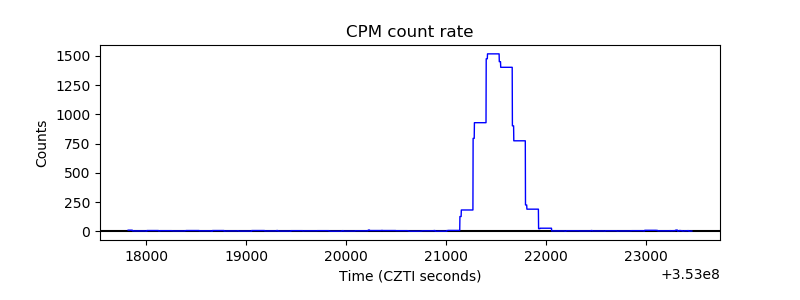 |
| CZT Counter |  |
| +2.5 Volts monitor | 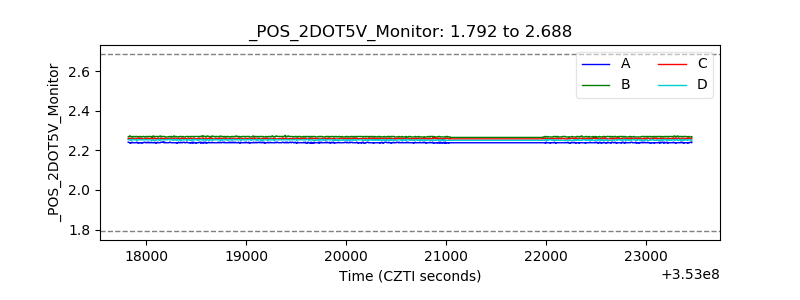 |
| +5 Volts monitor |  |
| _ROLL_ROT |  |
| _Roll_DEC |  |
| _Roll_RA |  |
| Veto Counter |  |