| Param | Original file | Final file |
|---|---|---|
| Filename | modeM0/AS1A10_094T01_9000004236_29452cztM0_level2.evt | modeM0/AS1A10_094T01_9000004236_29452cztM0_level2_quad_clean.evt |
| Size (bytes) | 593,568,000 | 72,388,800 |
| Size | 566.1 MB | 69.0 MB |
| Events in quadrant A | 2,194,507 | 528,004 |
| Events in quadrant B | 2,335,202 | 538,120 |
| Events in quadrant C | 2,463,742 | 499,502 |
| Events in quadrant D | 10,662,630 | 293,450 |
| Mode SS | |||
|---|---|---|---|
| Quadrant | BADHDUFLAG | Total packets | Discarded packets |
| A | 0 | 96 | 0 |
| B | 0 | 96 | 0 |
| C | 0 | 96 | 0 |
| D | 0 | 96 | 0 |
| Mode M0 | |||
|---|---|---|---|
| Quadrant | BADHDUFLAG | Total packets | Discarded packets |
| A | 0 | 9577 | 1 |
| B | 0 | 9926 | 1 |
| C | 0 | 10242 | 1 |
| D | 0 | 34900 | 1 |
| Mode M9 | |||
|---|---|---|---|
| Quadrant | BADHDUFLAG | Total packets | Discarded packets |
| A | 0 | 9 | 0 |
| B | 0 | 9 | 0 |
| C | 0 | 9 | 0 |
| D | 0 | 9 | 0 |
| Quadrant | Total seconds | Saturated seconds | Saturation percentage |
|---|---|---|---|
| A | 4718 | 16 | 0.339127% |
| B | 4718 | 30 | 0.635863% |
| C | 4718 | 251 | 5.320051% |
| D | 4718 | 3540 | 75.031793% |
Noise dominated data is calculated using 1-second bins in cleaned event files. If a bin has >2000 counts, and if more than 50% of those come from <1% of pixels, then it is considered to be noise-dominated and hence unusable.
| Quadrant | # 1 sec bins | Bins with >0 counts | Bins with >2000 counts | High rate bins dominated by noise | Noise dominated (total time) | Noise dominated (detector-on time) | Marked lightcurve |
|---|---|---|---|---|---|---|---|
| A | 5643 | 4719 | 0 | 0 | 0.00% | 0.00% | 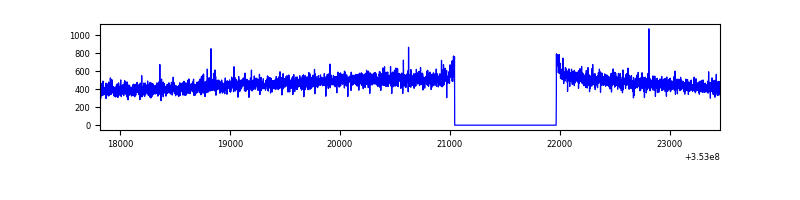 |
| B | 5643 | 4719 | 2 | 2 | 0.04% | 0.04% | 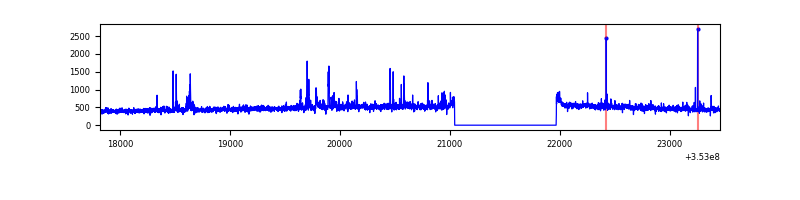 |
| C | 5643 | 4719 | 0 | 0 | 0.00% | 0.00% | 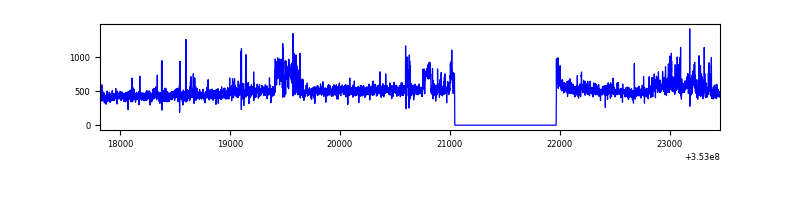 |
| D | 5643 | 4719 | 3392 | 3392 | 60.11% | 71.88% | 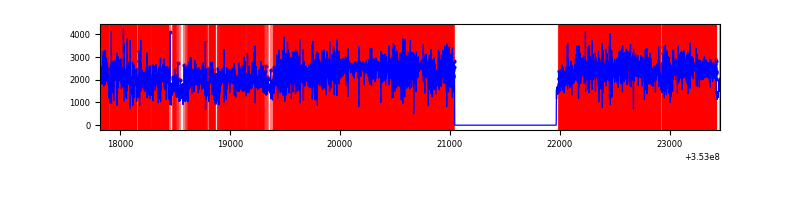 |
Top three noisy pixels from each quadrant. If the there are fewer than three noisy pixels in the level2.evt file, extra rows are filled as -1
| Pixel properties | Quadrant properties | ||||||
|---|---|---|---|---|---|---|---|
| Quadrant | DetID | PixID | Counts | Sigma | Mean | Median | Sigma |
| A | 13 | 254 | 8821 | 72.16 | 567 | 555 | 114.5 |
| A | 3 | 137 | 5553 | 43.63 | 567 | 555 | 114.5 |
| A | 0 | 226 | 4729 | 36.44 | 567 | 555 | 114.5 |
| B | 0 | 229 | 44859 | 411.33 | 565 | 551 | 107.7 |
| B | 0 | 230 | 27000 | 245.54 | 565 | 551 | 107.7 |
| B | 0 | 190 | 15887 | 142.37 | 565 | 551 | 107.7 |
| C | 14 | 238 | 169528 | 1330.7 | 534 | 536 | 127.0 |
| C | 14 | 254 | 111347 | 872.57 | 534 | 536 | 127.0 |
| C | 3 | 233 | 87533 | 685.05 | 534 | 536 | 127.0 |
| D | 8 | 195 | 4964829 | 53804.84 | 381 | 369 | 92.3 |
| D | 12 | 33 | 2208856 | 23935.59 | 381 | 369 | 92.3 |
| D | 1 | 52 | 946779 | 10257.2 | 381 | 369 | 92.3 |
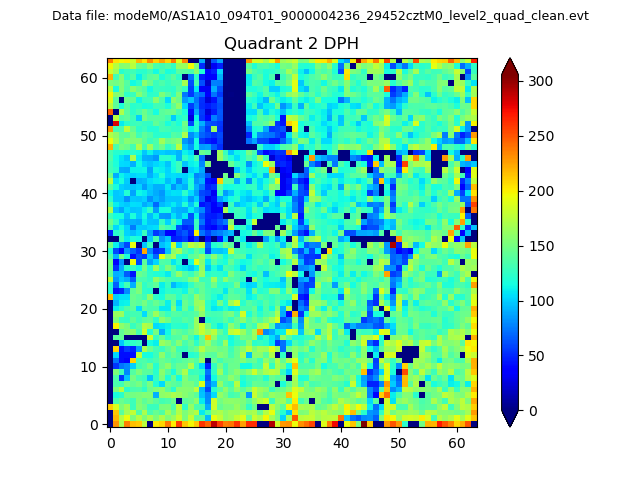
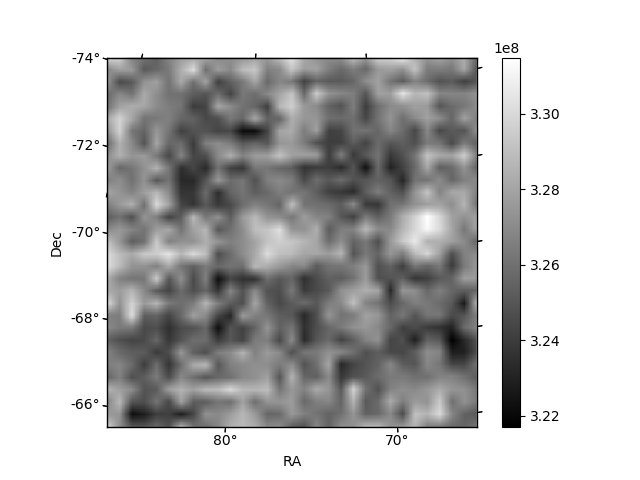
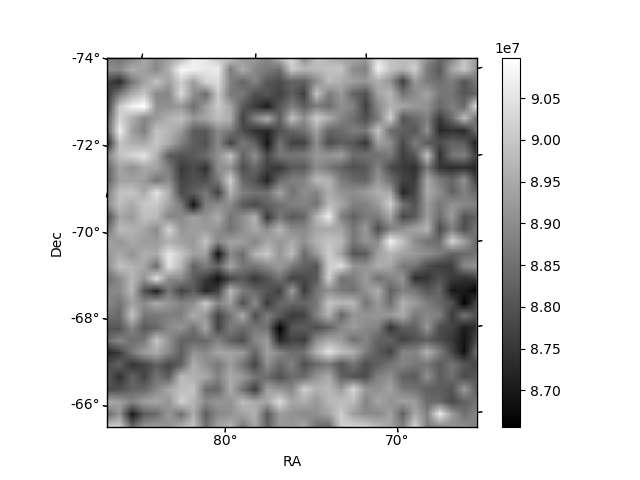
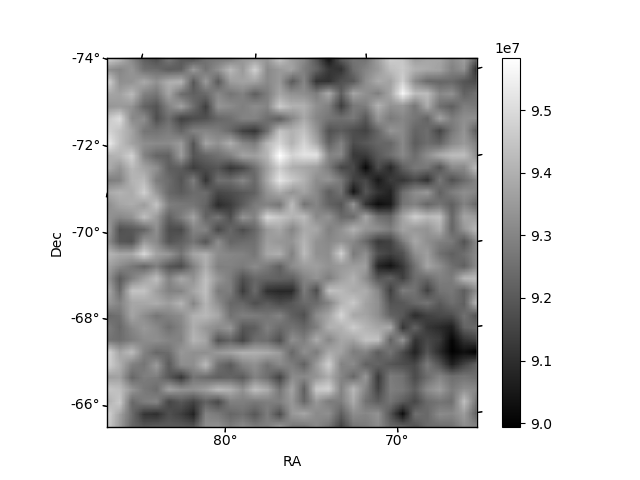
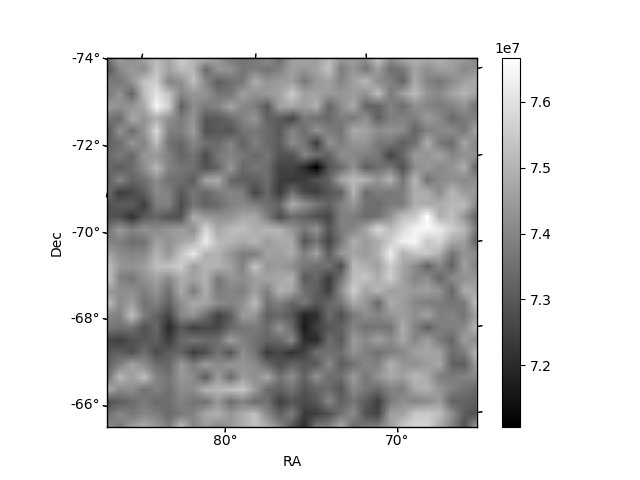
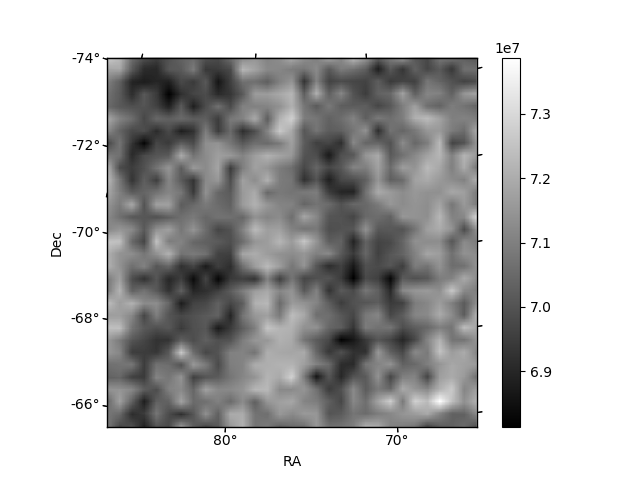
Histogram calculated using DETX and DETY for each event in the final _common_clean file
| Quadrant A | 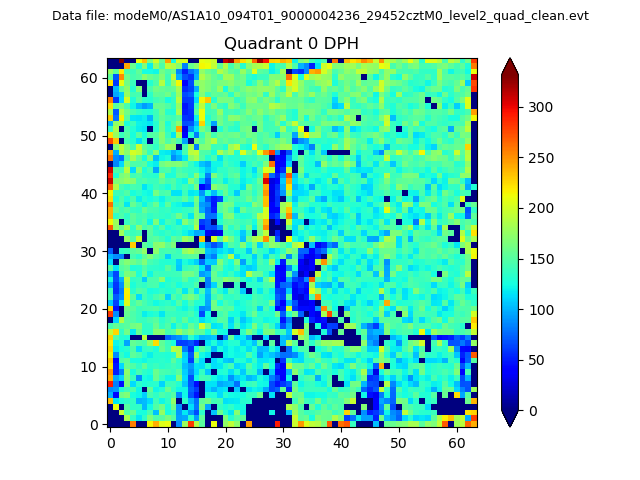 |
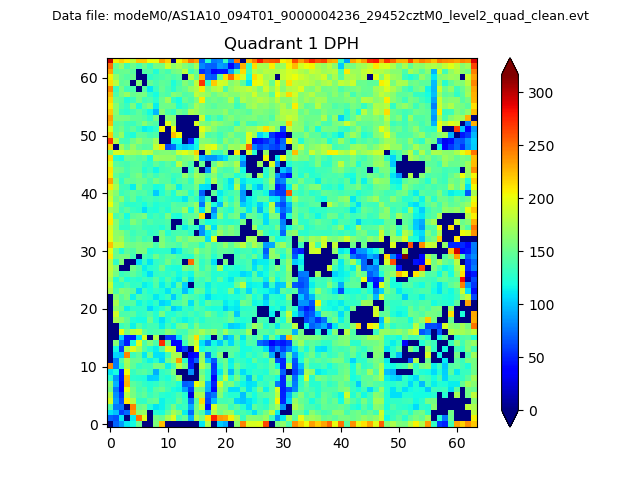 |
Quadrant B |
|---|---|---|---|
| Quadrant D | 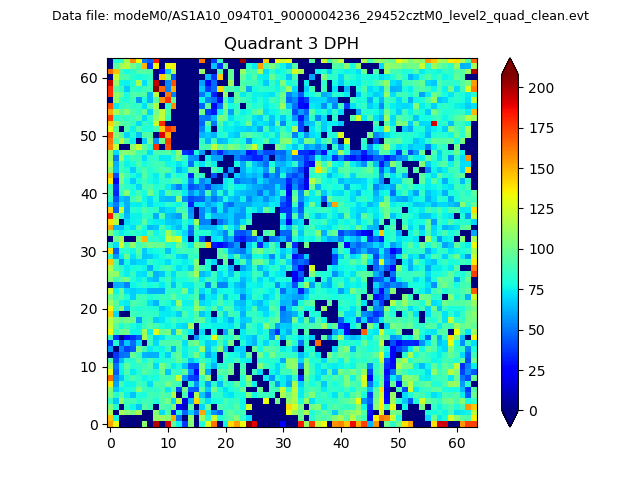 |
 |
Quadrant C |
| Plot type | Count rate plots | Images |
|---|---|---|
| Comparison with Poisson distribution Blue bars denote a histogram of data divided into 1 sec bins. Red curve is a Poisson curve with rate = median count rate of data. |
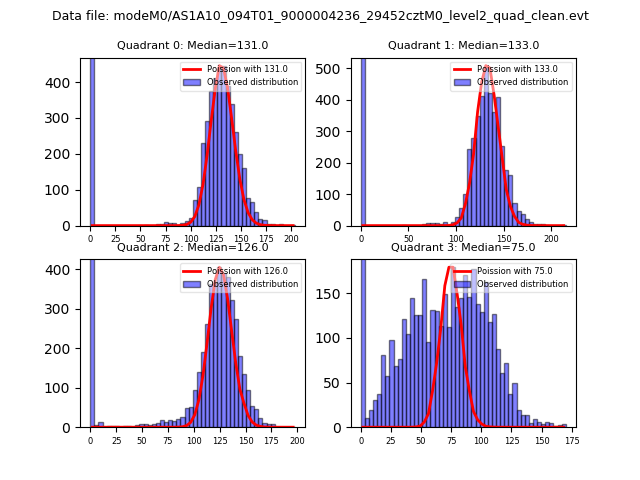 |
 |
| Quadrant-wise count rates Data is divided into 100 sec bins |
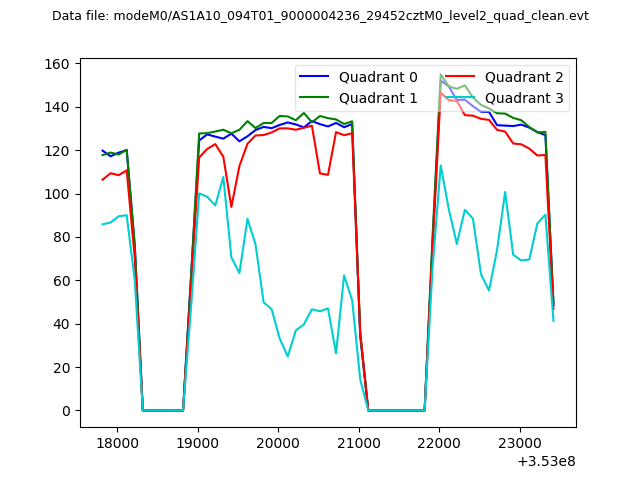 |
|
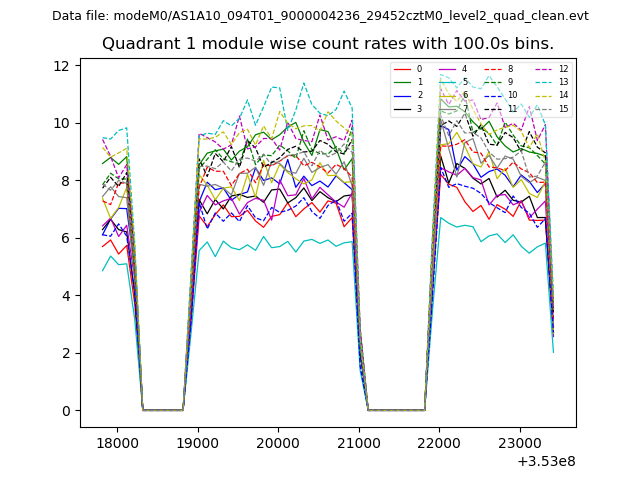
| Module-wise count rates for Quadrant A Data is divided into 100 sec bins |
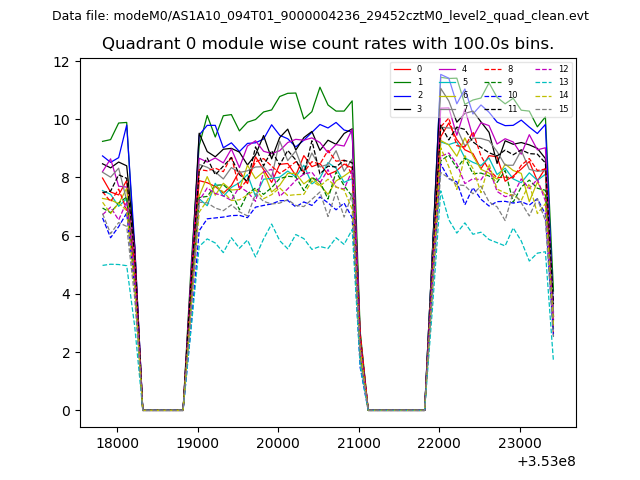 |
 |
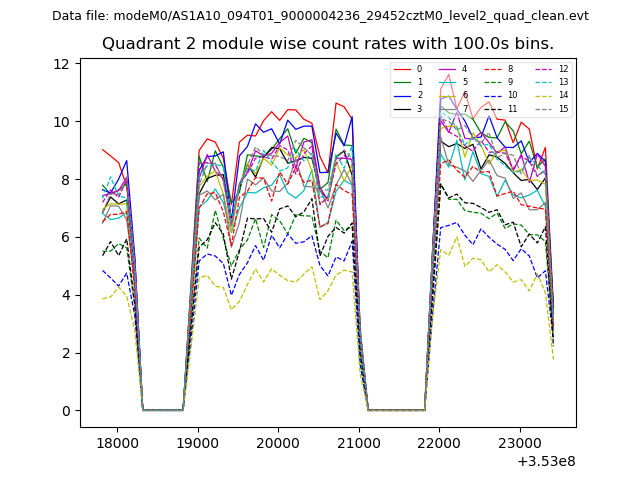
| Module-wise count rates for Quadrant B Data is divided into 100 sec bins |
 |
 |
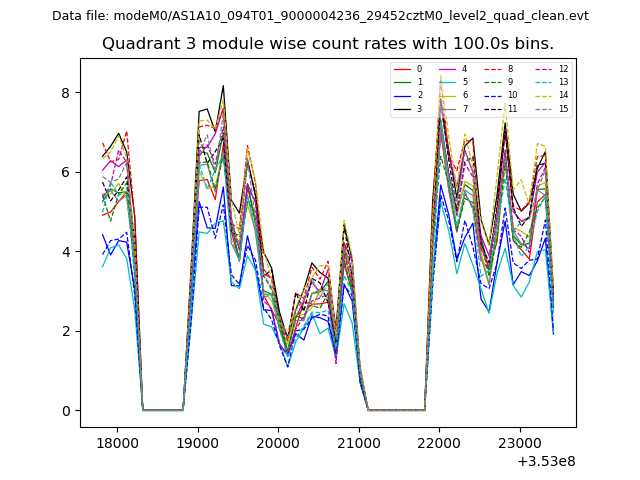
| Module-wise count rates for Quadrant C Data is divided into 100 sec bins |
 |
 |
| Module-wise count rates for Quadrant D Data is divided into 100 sec bins |
 |
 |
| Parameter | Plot |
|---|---|
| CZT HV Monitor | 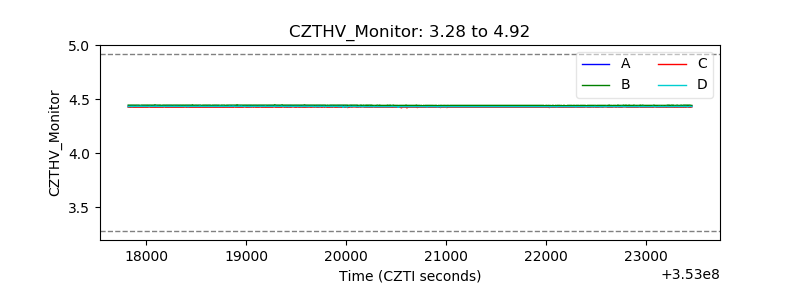 |
| D_VDD | 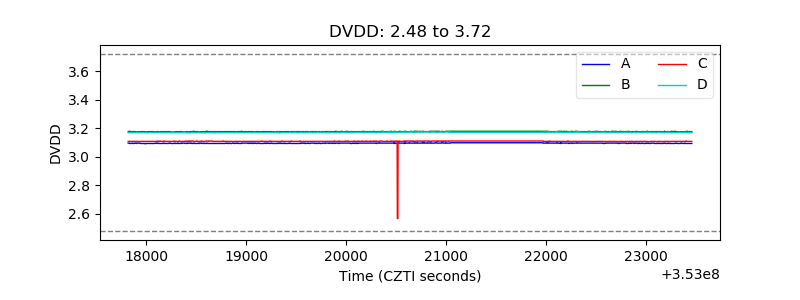 |
| Temperature 1 | 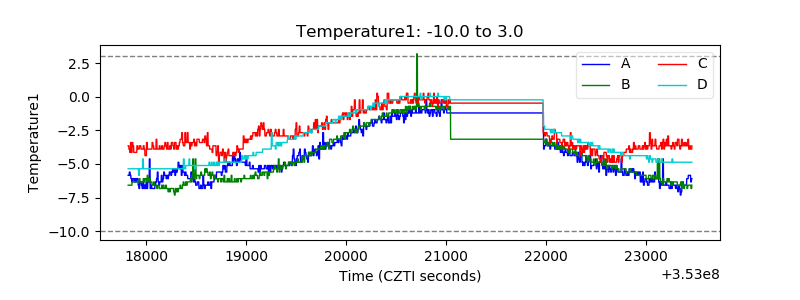 |
| Veto HV Monitor | 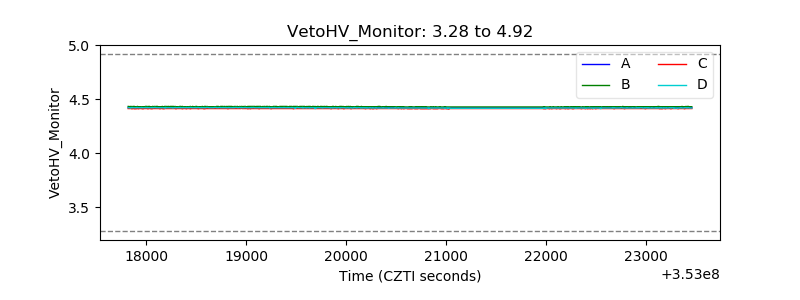 |
| Veto LLD | 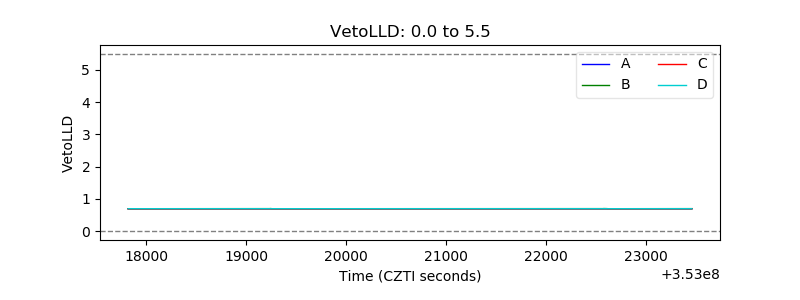 |
| Alpha Counter | 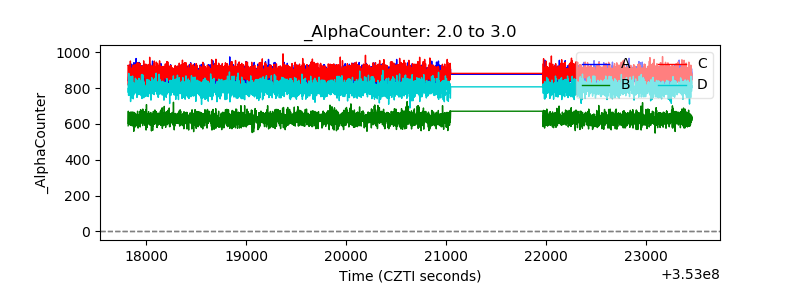 |
| _CPM_Rate | 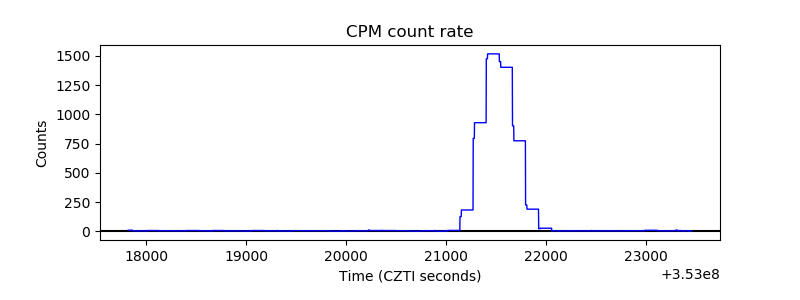 |
| CZT Counter | 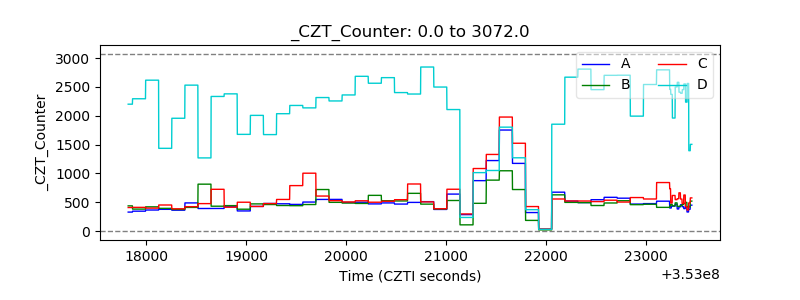 |
| +2.5 Volts monitor |  |
| +5 Volts monitor |  |
| _ROLL_ROT | 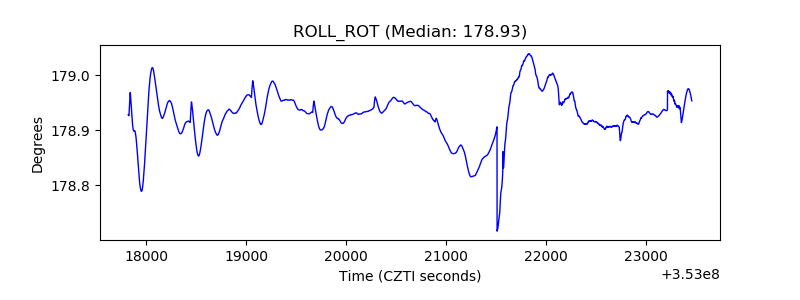 |
| _Roll_DEC | 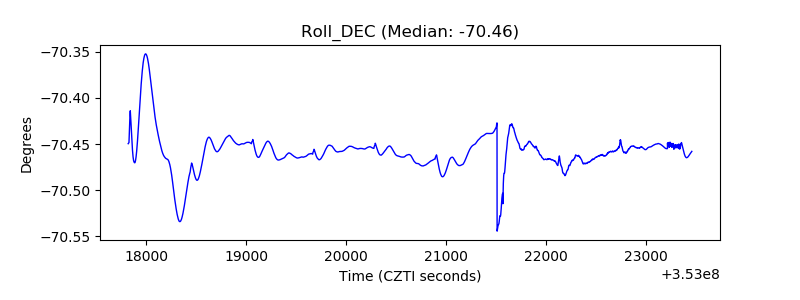 |
| _Roll_RA | 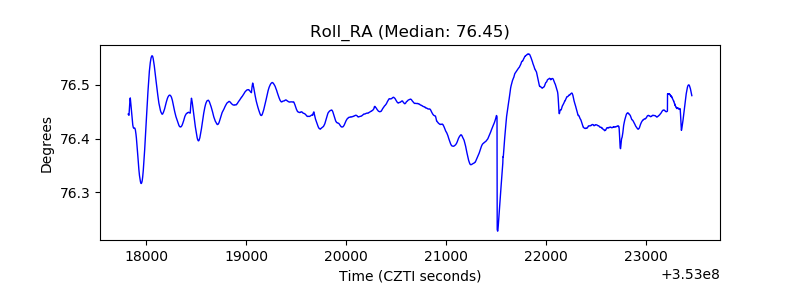 |
| Veto Counter | 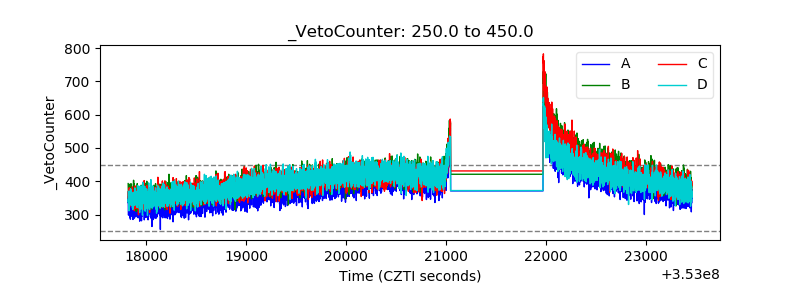 |