| Param | Original file | Final file |
|---|---|---|
| Filename | modeM0/AS1A10_094T02_9000004238cztM0_level2.fits | modeM0/AS1A10_094T02_9000004238cztM0_level2_quad_clean.evt |
| Size (bytes) | 89,763,840 | 75,513,600 |
| Size | 85.6 MB | 72.0 MB |
| Events in quadrant A | 580,930 | 502,542 |
| Events in quadrant B | 561,240 | 506,481 |
| Events in quadrant C | 570,170 | 476,707 |
| Events in quadrant D | 364,846 | 161,271 |
| Mode M0 | |||
|---|---|---|---|
| Quadrant | BADHDUFLAG | Total packets | Discarded packets |
| A | 0 | 19402 | 0 |
| B | 0 | 19471 | 0 |
| C | 0 | 20186 | 0 |
| D | 0 | 64493 | 0 |
| Mode SS | |||
|---|---|---|---|
| Quadrant | BADHDUFLAG | Total packets | Discarded packets |
| A | 0 | 188 | 0 |
| B | 0 | 188 | 0 |
| C | 0 | 188 | 0 |
| D | 0 | 188 | 0 |
| Mode M9 | |||
|---|---|---|---|
| Quadrant | BADHDUFLAG | Total packets | Discarded packets |
| A | 0 | 22 | 0 |
| B | 0 | 22 | 0 |
| C | 0 | 22 | 0 |
| D | 0 | 22 | 0 |
| Quadrant | Total seconds | Saturated seconds | Saturation percentage |
|---|---|---|---|
| A | 9209 | 46 | 0.499511% |
| B | 9209 | 50 | 0.542947% |
| C | 9209 | 220 | 2.388967% |
| D | 9209 | 5986 | 65.001629% |
Noise dominated data is calculated using 1-second bins in cleaned event files. If a bin has >2000 counts, and if more than 50% of those come from <1% of pixels, then it is considered to be noise-dominated and hence unusable.
| Quadrant | # 1 sec bins | Bins with >0 counts | Bins with >2000 counts | High rate bins dominated by noise | Noise dominated (total time) | Noise dominated (detector-on time) | Marked lightcurve |
|---|---|---|---|---|---|---|---|
| A | 11484 | 9209 | 0 | 0 | 0.00% | 0.00% |  |
| B | 11484 | 9209 | 0 | 0 | 0.00% | 0.00% |  |
| C | 11484 | 9209 | 0 | 0 | 0.00% | 0.00% |  |
| D | 11484 | 9199 | 0 | 0 | 0.00% | 0.00% |  |
Top three noisy pixels from each quadrant. If the there are fewer than three noisy pixels in the level2.evt file, extra rows are filled as -1
| Pixel properties | Quadrant properties | ||||||
|---|---|---|---|---|---|---|---|
| Quadrant | DetID | PixID | Counts | Sigma | Mean | Median | Sigma |
| A | 7 | 110 | 473 | 8.54 | 152 | 144 | 38.5 |
| A | 0 | 29 | 464 | 8.3 | 152 | 144 | 38.5 |
| A | 0 | 30 | 426 | 7.32 | 152 | 144 | 38.5 |
| B | 2 | 9 | 461 | 10.34 | 148 | 143 | 30.7 |
| B | 5 | 128 | 391 | 8.07 | 148 | 143 | 30.7 |
| B | 3 | 17 | 387 | 7.94 | 148 | 143 | 30.7 |
| C | 1 | 81 | 441 | 7.46 | 150 | 142 | 40.1 |
| C | 1 | 80 | 440 | 7.44 | 150 | 142 | 40.1 |
| C | 12 | 241 | 425 | 7.06 | 150 | 142 | 40.1 |
| D | 4 | 246 | 291 | 6.73 | 104 | 95 | 29.1 |
| D | 3 | 14 | 278 | 6.29 | 104 | 95 | 29.1 |
| D | 15 | 46 | 271 | 6.04 | 104 | 95 | 29.1 |
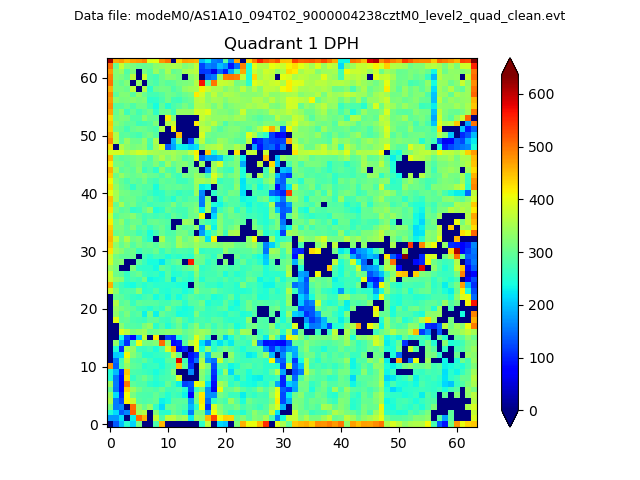
Histogram calculated using DETX and DETY for each event in the final _common_clean file
| Quadrant A |  |
 |
Quadrant B |
|---|---|---|---|
| Quadrant D |  |
 |
Quadrant C |
| Plot type | Count rate plots | Images |
|---|---|---|
| Comparison with Poisson distribution Blue bars denote a histogram of data divided into 1 sec bins. Red curve is a Poisson curve with rate = median count rate of data. |
 |
 |
| Quadrant-wise count rates Data is divided into 100 sec bins |
 |
|
| Module-wise count rates for Quadrant A Data is divided into 100 sec bins |
 |
 |
| Module-wise count rates for Quadrant B Data is divided into 100 sec bins |
 |
 |
| Module-wise count rates for Quadrant C Data is divided into 100 sec bins |
 |
 |
| Module-wise count rates for Quadrant D Data is divided into 100 sec bins |
 |
 |
| Parameter | Plot |
|---|---|
| CZT HV Monitor |  |
| D_VDD | 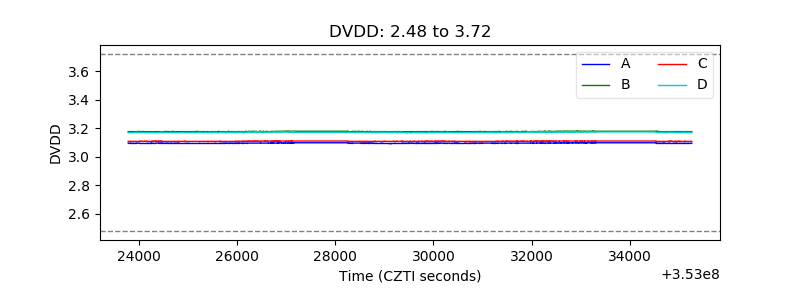 |
| Temperature 1 |  |
| Veto HV Monitor |  |
| Veto LLD |  |
| Alpha Counter |  |
| _CPM_Rate |  |
| CZT Counter |  |
| +2.5 Volts monitor |  |
| +5 Volts monitor |  |
| _ROLL_ROT |  |
| _Roll_DEC |  |
| _Roll_RA |  |
| Veto Counter |  |