| Param | Original file | Final file |
|---|---|---|
| Filename | modeM0/AS1A10_094T02_9000004238_29452cztM0_level2.evt | modeM0/AS1A10_094T02_9000004238_29452cztM0_level2_quad_clean.evt |
| Size (bytes) | 590,820,480 | 77,506,560 |
| Size | 563.5 MB | 73.9 MB |
| Events in quadrant A | 2,237,216 | 550,269 |
| Events in quadrant B | 2,303,404 | 565,398 |
| Events in quadrant C | 2,452,742 | 536,756 |
| Events in quadrant D | 10,578,480 | 360,892 |
| Mode M0 | |||
|---|---|---|---|
| Quadrant | BADHDUFLAG | Total packets | Discarded packets |
| A | 0 | 9685 | 1 |
| B | 0 | 9839 | 1 |
| C | 0 | 10208 | 1 |
| D | 0 | 34608 | 5 |
| Mode SS | |||
|---|---|---|---|
| Quadrant | BADHDUFLAG | Total packets | Discarded packets |
| A | 0 | 98 | 0 |
| B | 0 | 98 | 0 |
| C | 0 | 98 | 0 |
| D | 0 | 98 | 0 |
| Mode M9 | |||
|---|---|---|---|
| Quadrant | BADHDUFLAG | Total packets | Discarded packets |
| A | 0 | 10 | 0 |
| B | 0 | 10 | 0 |
| C | 0 | 10 | 0 |
| D | 0 | 10 | 0 |
| Quadrant | Total seconds | Saturated seconds | Saturation percentage |
|---|---|---|---|
| A | 4728 | 17 | 0.359560% |
| B | 4728 | 27 | 0.571066% |
| C | 4728 | 76 | 1.607445% |
| D | 4727 | 3533 | 74.740850% |
Noise dominated data is calculated using 1-second bins in cleaned event files. If a bin has >2000 counts, and if more than 50% of those come from <1% of pixels, then it is considered to be noise-dominated and hence unusable.
| Quadrant | # 1 sec bins | Bins with >0 counts | Bins with >2000 counts | High rate bins dominated by noise | Noise dominated (total time) | Noise dominated (detector-on time) | Marked lightcurve |
|---|---|---|---|---|---|---|---|
| A | 5798 | 4729 | 0 | 0 | 0.00% | 0.00% | 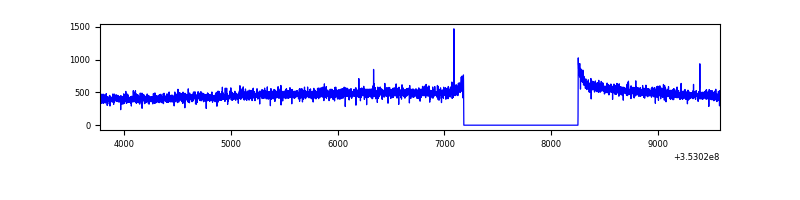 |
| B | 5798 | 4729 | 0 | 0 | 0.00% | 0.00% | 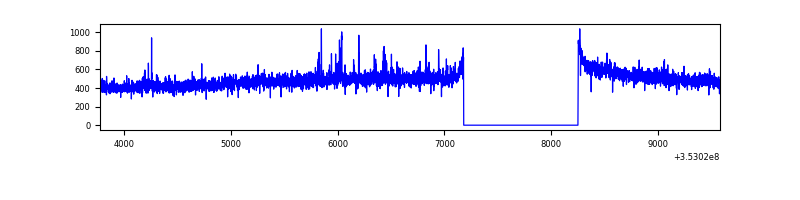 |
| C | 5798 | 4729 | 0 | 0 | 0.00% | 0.00% | 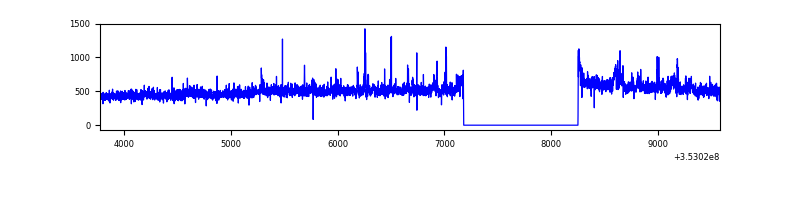 |
| D | 5797 | 4727 | 3283 | 3283 | 56.63% | 69.45% | 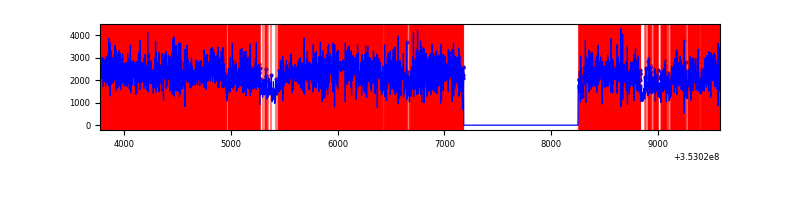 |
Top three noisy pixels from each quadrant. If the there are fewer than three noisy pixels in the level2.evt file, extra rows are filled as -1
| Pixel properties | Quadrant properties | ||||||
|---|---|---|---|---|---|---|---|
| Quadrant | DetID | PixID | Counts | Sigma | Mean | Median | Sigma |
| A | 13 | 254 | 8754 | 70.57 | 577 | 566 | 116.0 |
| A | 3 | 137 | 5470 | 42.27 | 577 | 566 | 116.0 |
| A | 0 | 226 | 4922 | 37.55 | 577 | 566 | 116.0 |
| B | 0 | 190 | 13975 | 122.04 | 578 | 564 | 109.9 |
| B | 12 | 111 | 13068 | 113.79 | 578 | 564 | 109.9 |
| B | 11 | 111 | 11835 | 102.57 | 578 | 564 | 109.9 |
| C | 3 | 233 | 127829 | 982.95 | 557 | 559 | 129.5 |
| C | 14 | 238 | 109965 | 844.98 | 557 | 559 | 129.5 |
| C | 14 | 254 | 23832 | 179.75 | 557 | 559 | 129.5 |
| D | 8 | 195 | 4898890 | 47887.12 | 426 | 413 | 102.3 |
| D | 12 | 33 | 2999455 | 29318.4 | 426 | 413 | 102.3 |
| D | 1 | 52 | 853624 | 8340.92 | 426 | 413 | 102.3 |
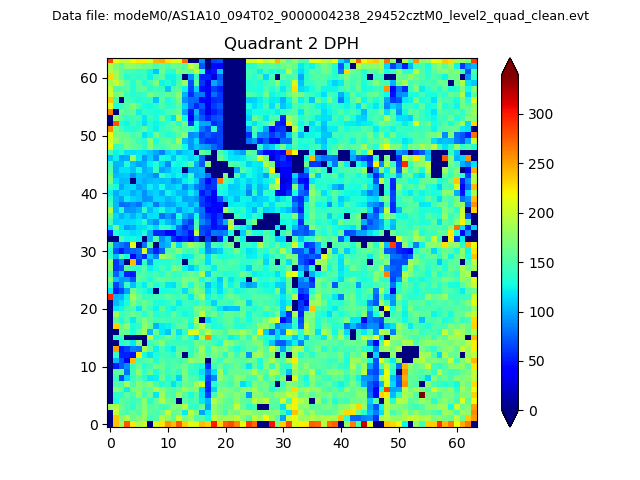
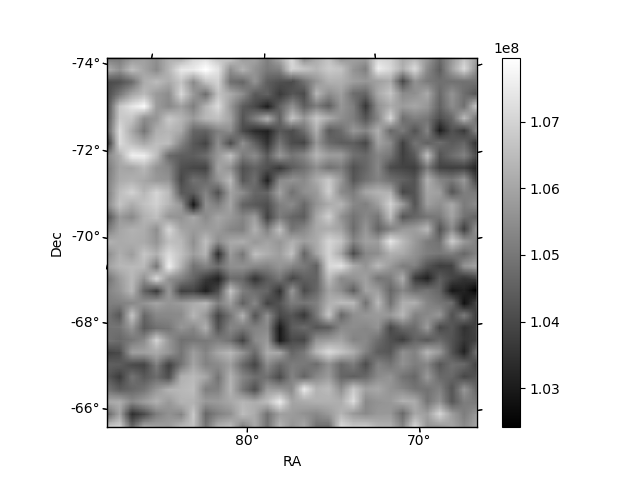
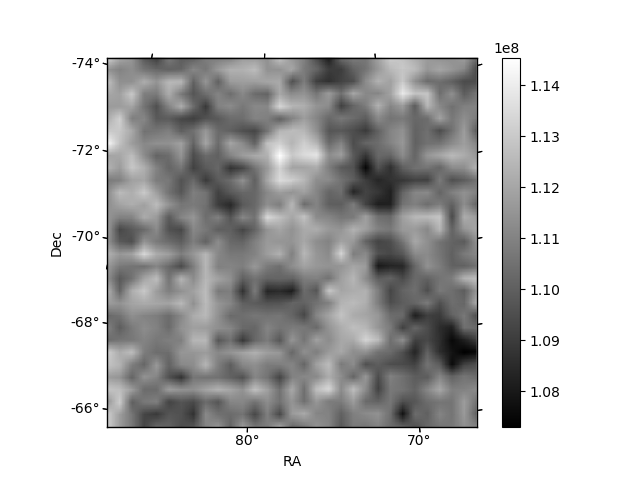
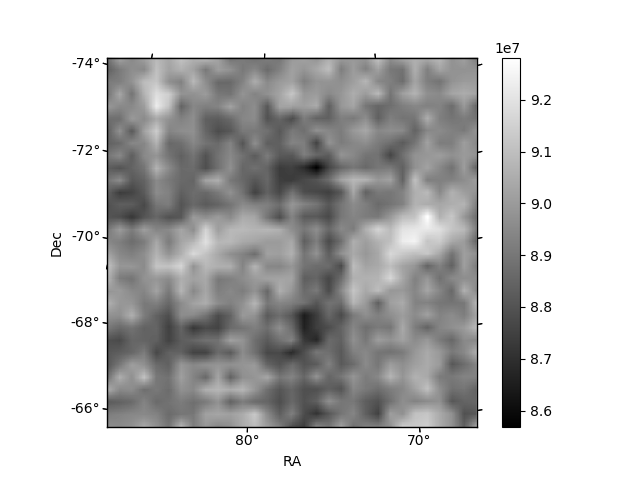
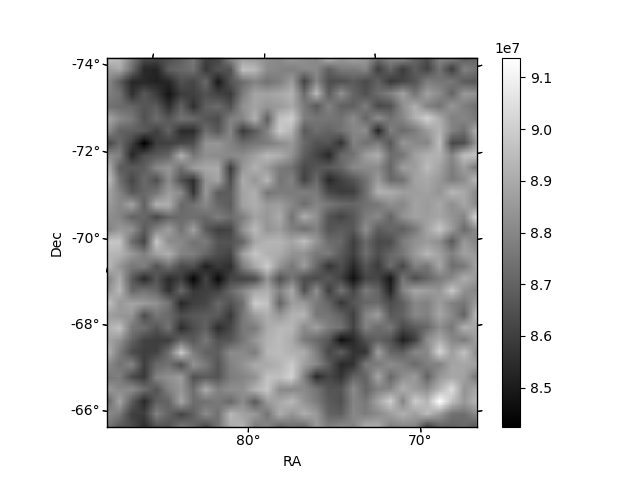
Histogram calculated using DETX and DETY for each event in the final _common_clean file
| Quadrant A | 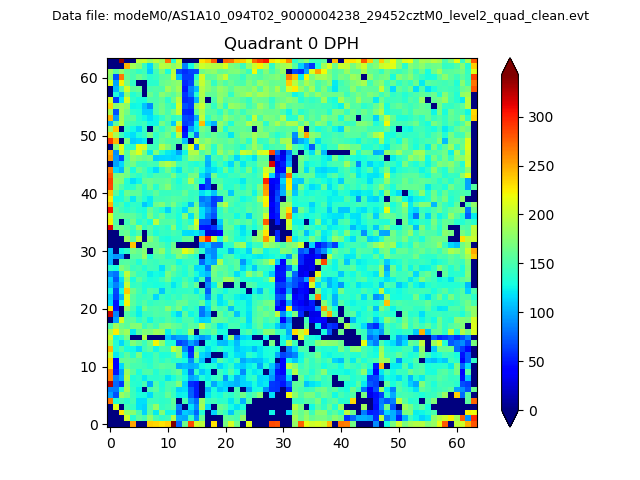 |
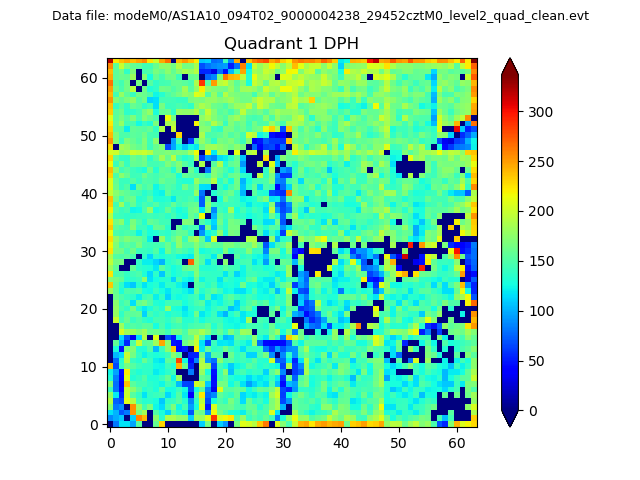 |
Quadrant B |
|---|---|---|---|
| Quadrant D | 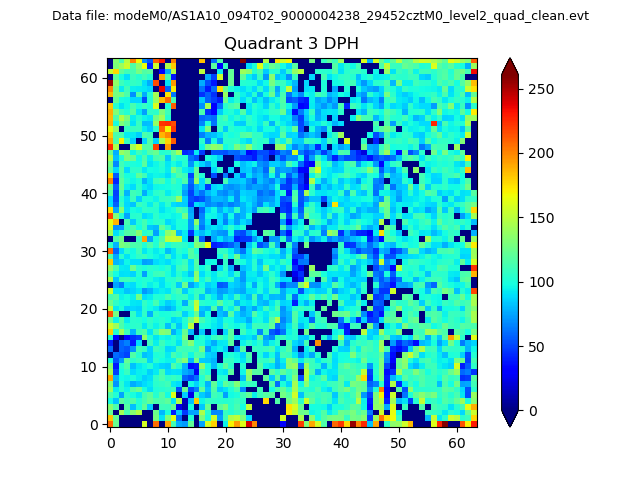 |
 |
Quadrant C |
| Plot type | Count rate plots | Images |
|---|---|---|
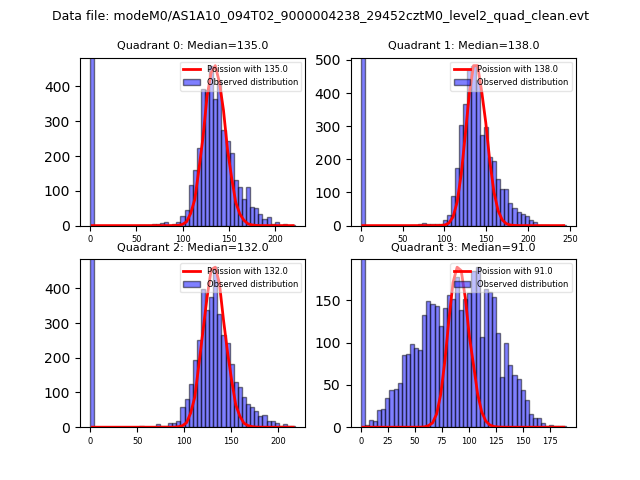
| Comparison with Poisson distribution Blue bars denote a histogram of data divided into 1 sec bins. Red curve is a Poisson curve with rate = median count rate of data. |
 |
 |
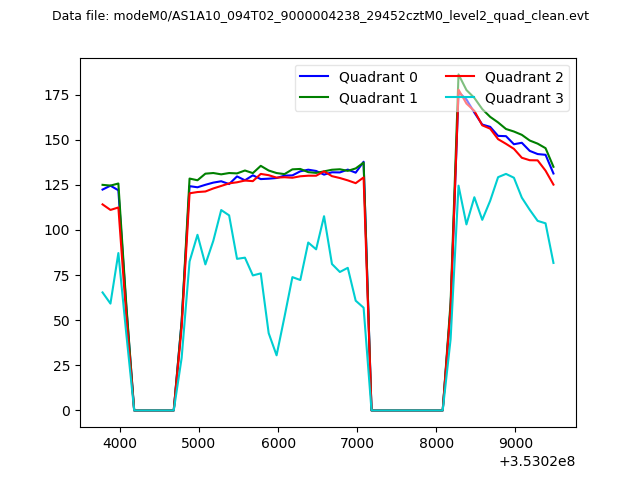
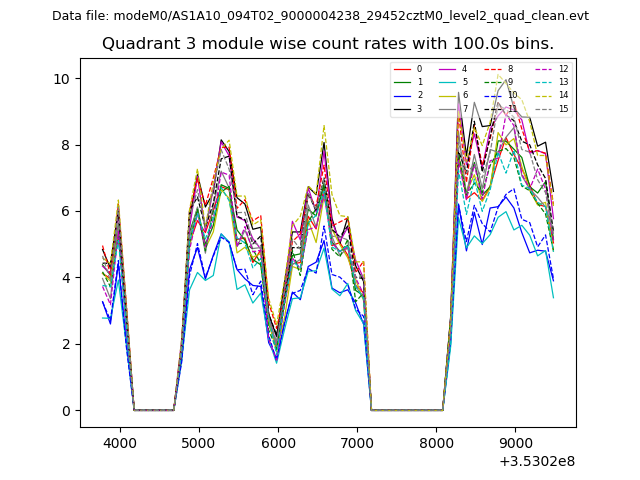
| Quadrant-wise count rates Data is divided into 100 sec bins |
 |
|
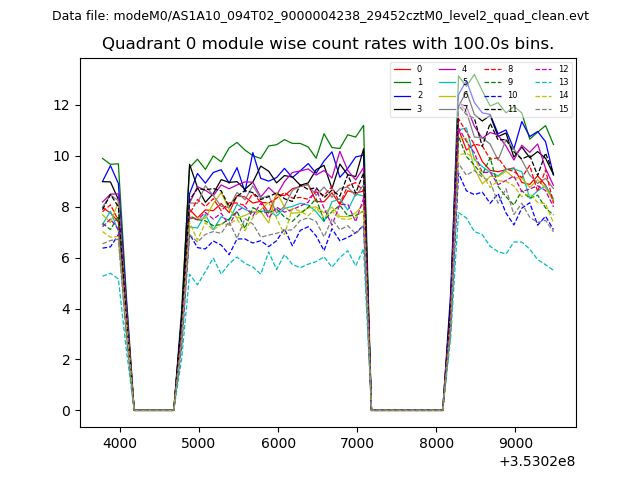
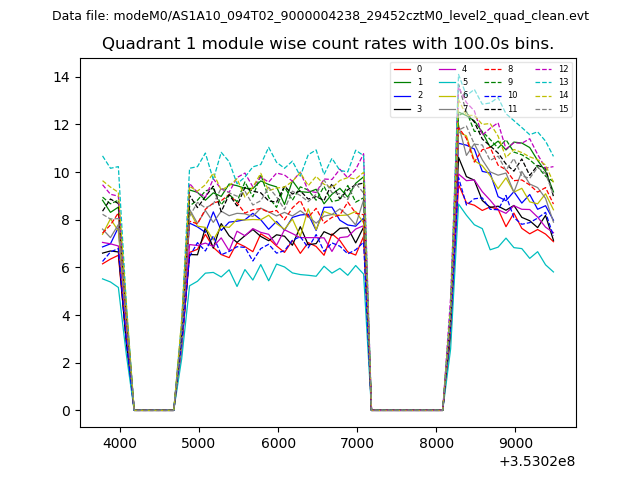
| Module-wise count rates for Quadrant A Data is divided into 100 sec bins |
 |
 |
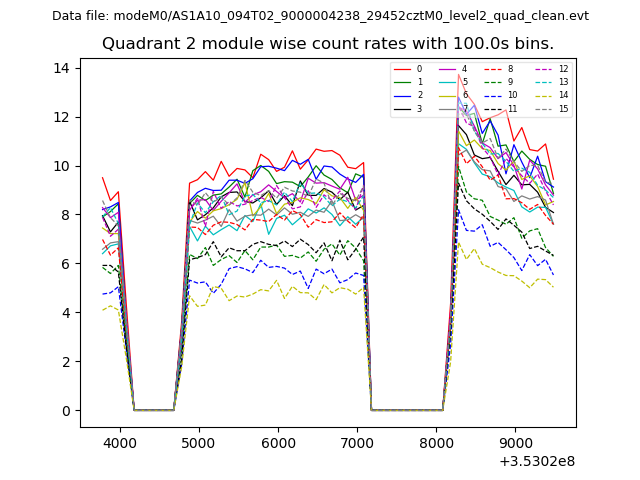
| Module-wise count rates for Quadrant B Data is divided into 100 sec bins |
 |
 |
| Module-wise count rates for Quadrant C Data is divided into 100 sec bins |
 |
 |
| Module-wise count rates for Quadrant D Data is divided into 100 sec bins |
 |
 |
| Parameter | Plot |
|---|---|
| CZT HV Monitor | 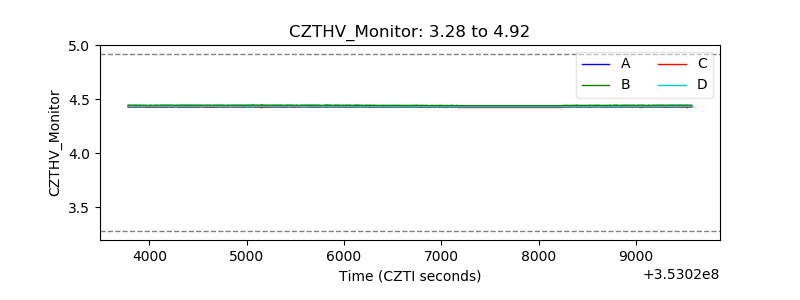 |
| D_VDD | 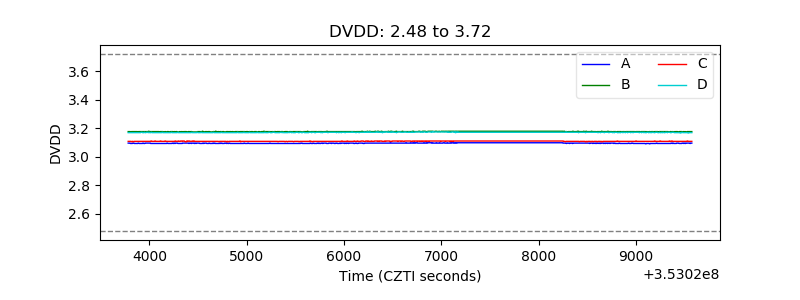 |
| Temperature 1 | 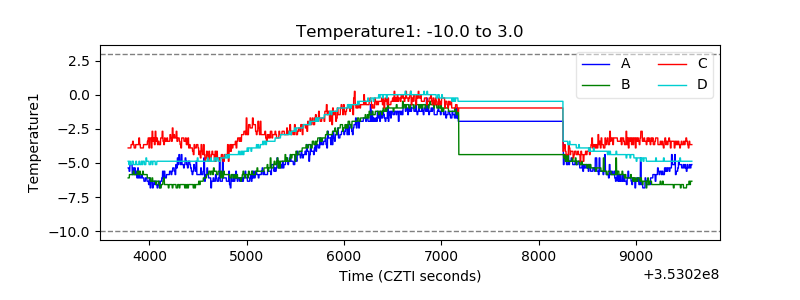 |
| Veto HV Monitor |  |
| Veto LLD | 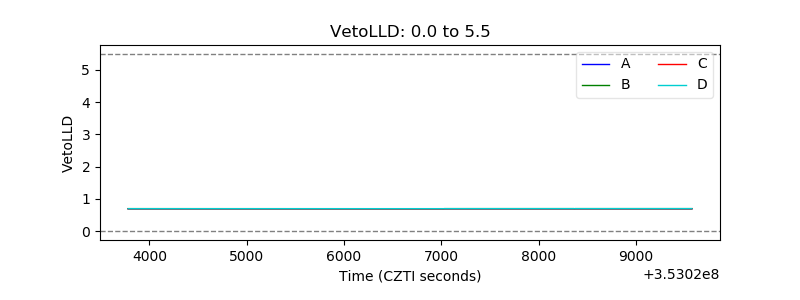 |
| Alpha Counter |  |
| _CPM_Rate | 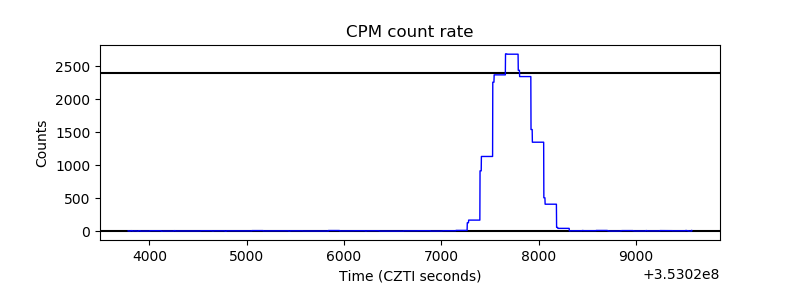 |
| CZT Counter | 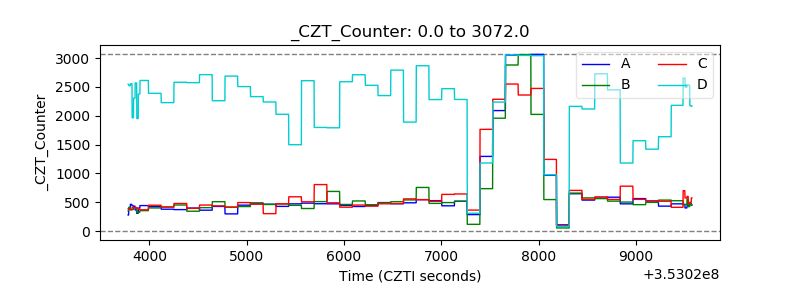 |
| +2.5 Volts monitor |  |
| +5 Volts monitor | 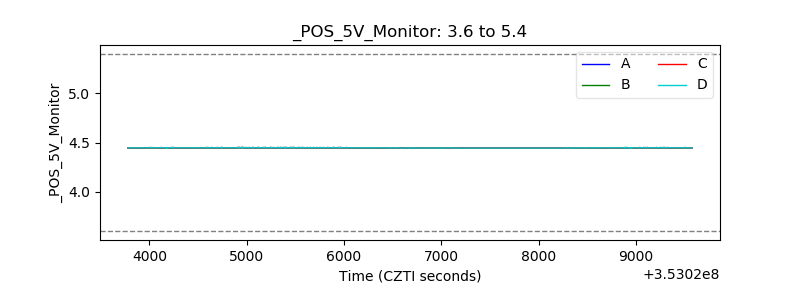 |
| _ROLL_ROT | 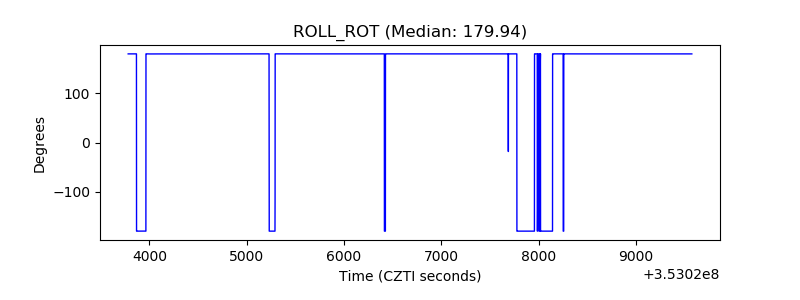 |
| _Roll_DEC | 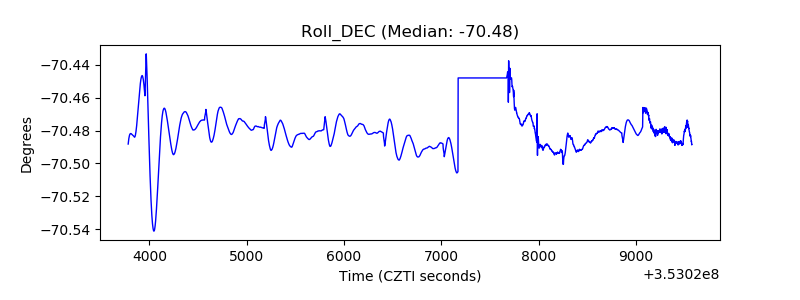 |
| _Roll_RA | 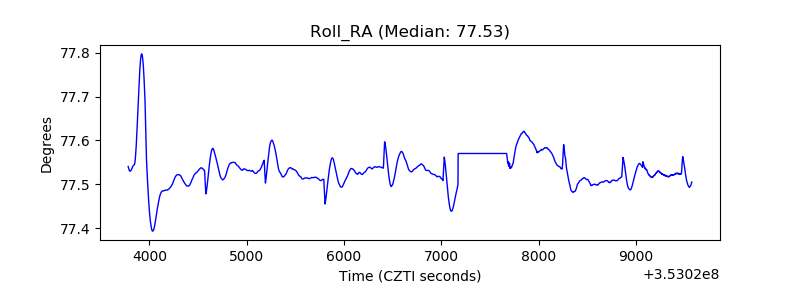 |
| Veto Counter | 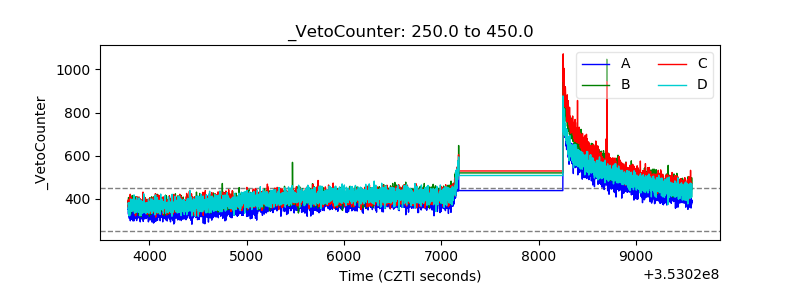 |