| Param | Original file | Final file |
|---|---|---|
| Filename | modeM0/AS1A10_094T02_9000004238_29454cztM0_level2.evt | modeM0/AS1A10_094T02_9000004238_29454cztM0_level2_quad_clean.evt |
| Size (bytes) | 697,314,240 | 104,359,680 |
| Size | 665.0 MB | 99.5 MB |
| Events in quadrant A | 2,913,386 | 738,415 |
| Events in quadrant B | 2,952,599 | 761,053 |
| Events in quadrant C | 3,152,935 | 720,867 |
| Events in quadrant D | 11,709,820 | 536,320 |
| Mode M0 | |||
|---|---|---|---|
| Quadrant | BADHDUFLAG | Total packets | Discarded packets |
| A | 0 | 12368 | 2 |
| B | 0 | 12413 | 2 |
| C | 0 | 13018 | 4 |
| D | 0 | 38720 | 2 |
| Mode SS | |||
|---|---|---|---|
| Quadrant | BADHDUFLAG | Total packets | Discarded packets |
| A | 0 | 118 | 0 |
| B | 0 | 118 | 0 |
| C | 0 | 118 | 0 |
| D | 0 | 118 | 0 |
| Mode M9 | |||
|---|---|---|---|
| Quadrant | BADHDUFLAG | Total packets | Discarded packets |
| A | 0 | 17 | 0 |
| B | 0 | 18 | 0 |
| C | 0 | 18 | 0 |
| D | 0 | 18 | 0 |
| Quadrant | Total seconds | Saturated seconds | Saturation percentage |
|---|---|---|---|
| A | 5756 | 32 | 0.555942% |
| B | 5756 | 31 | 0.538568% |
| C | 5755 | 167 | 2.901825% |
| D | 5755 | 3200 | 55.603823% |
Noise dominated data is calculated using 1-second bins in cleaned event files. If a bin has >2000 counts, and if more than 50% of those come from <1% of pixels, then it is considered to be noise-dominated and hence unusable.
| Quadrant | # 1 sec bins | Bins with >0 counts | Bins with >2000 counts | High rate bins dominated by noise | Noise dominated (total time) | Noise dominated (detector-on time) | Marked lightcurve |
|---|---|---|---|---|---|---|---|
| A | 6961 | 5757 | 3 | 3 | 0.04% | 0.05% | 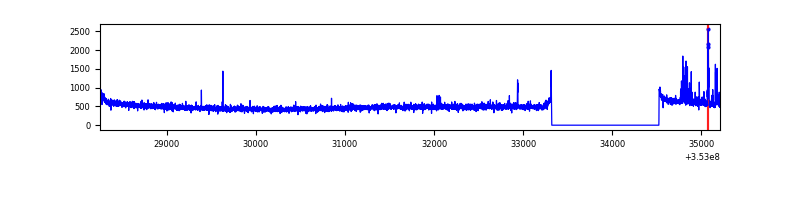 |
| B | 6961 | 5757 | 0 | 0 | 0.00% | 0.00% | 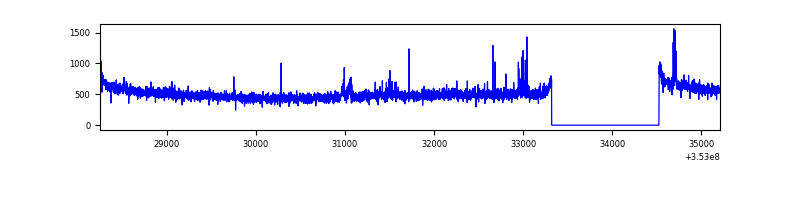 |
| C | 6960 | 5756 | 0 | 0 | 0.00% | 0.00% | 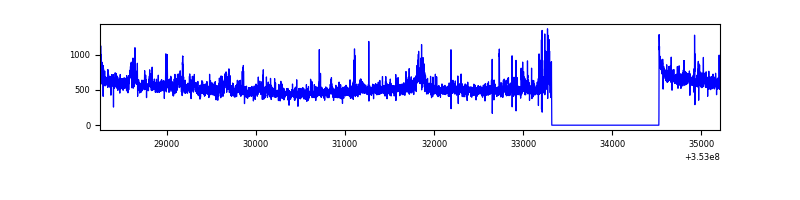 |
| D | 6960 | 5756 | 3061 | 3061 | 43.98% | 53.18% | 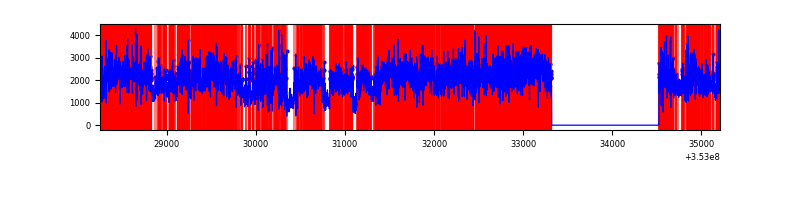 |
Top three noisy pixels from each quadrant. If the there are fewer than three noisy pixels in the level2.evt file, extra rows are filled as -1
| Pixel properties | Quadrant properties | ||||||
|---|---|---|---|---|---|---|---|
| Quadrant | DetID | PixID | Counts | Sigma | Mean | Median | Sigma |
| A | 0 | 13 | 75448 | 512.17 | 735 | 722 | 145.9 |
| A | 13 | 254 | 11544 | 74.17 | 735 | 722 | 145.9 |
| A | 3 | 137 | 6772 | 41.47 | 735 | 722 | 145.9 |
| B | 5 | 255 | 18313 | 128.36 | 737 | 720 | 137.1 |
| B | 0 | 155 | 18254 | 127.93 | 737 | 720 | 137.1 |
| B | 0 | 230 | 18004 | 126.1 | 737 | 720 | 137.1 |
| C | 14 | 238 | 162246 | 988.23 | 708 | 710 | 163.5 |
| C | 3 | 233 | 151656 | 923.45 | 708 | 710 | 163.5 |
| C | 14 | 254 | 63741 | 385.61 | 708 | 710 | 163.5 |
| D | 8 | 195 | 6605618 | 46209.09 | 599 | 585 | 142.9 |
| D | 1 | 52 | 1439466 | 10066.47 | 599 | 585 | 142.9 |
| D | 12 | 33 | 1039717 | 7269.81 | 599 | 585 | 142.9 |
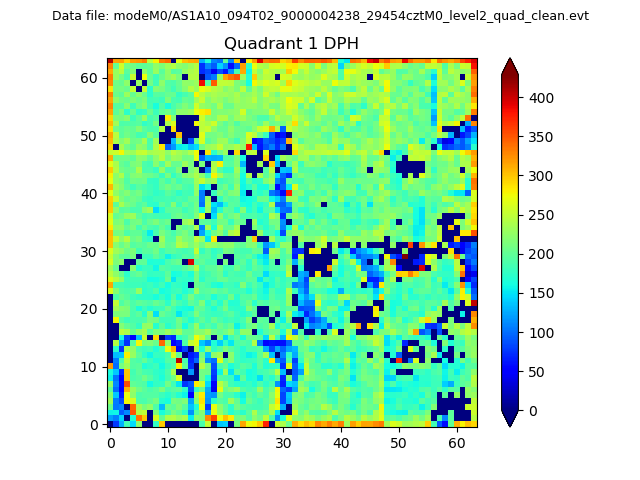
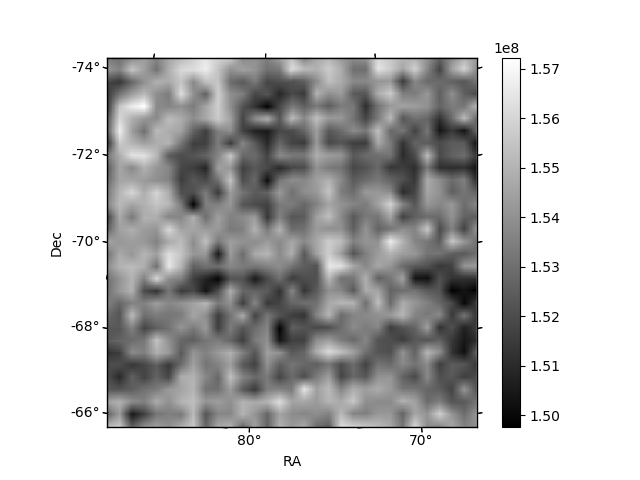
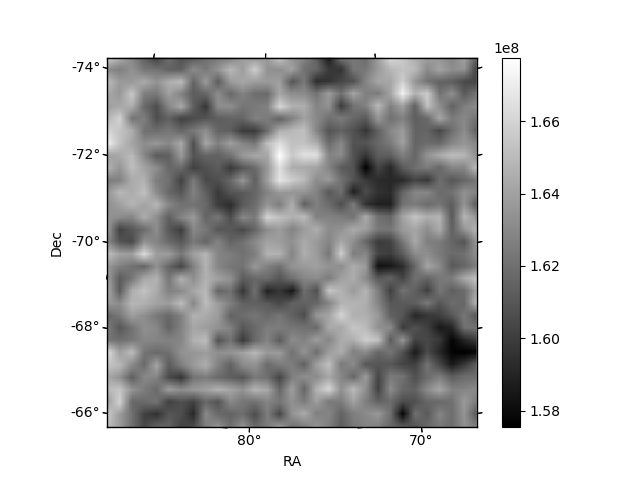
Histogram calculated using DETX and DETY for each event in the final _common_clean file
| Quadrant A |  |
 |
Quadrant B |
|---|---|---|---|
| Quadrant D | 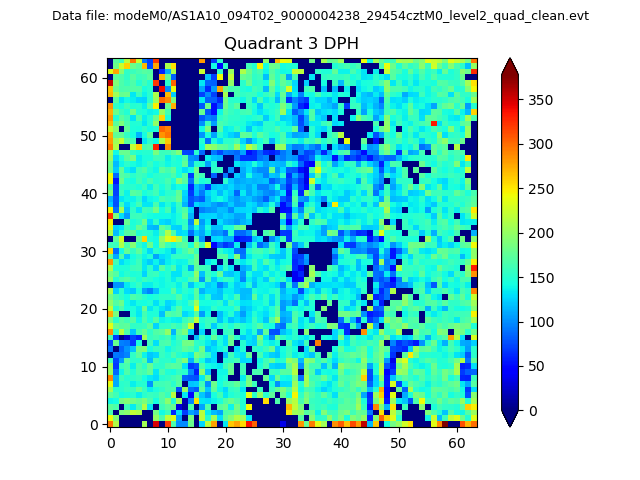 |
 |
Quadrant C |
| Plot type | Count rate plots | Images |
|---|---|---|
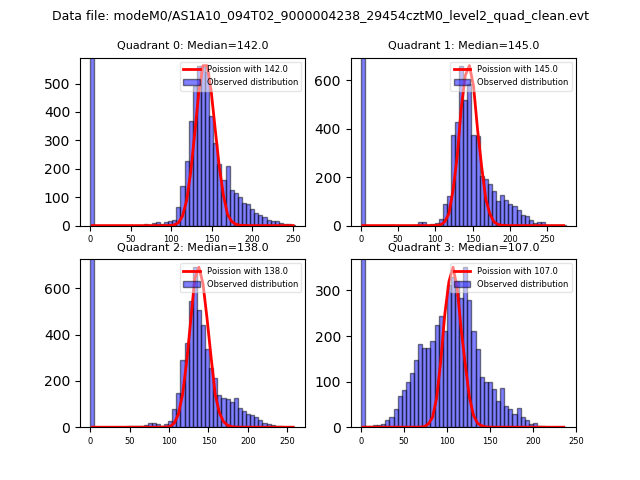
| Comparison with Poisson distribution Blue bars denote a histogram of data divided into 1 sec bins. Red curve is a Poisson curve with rate = median count rate of data. |
 |
 |
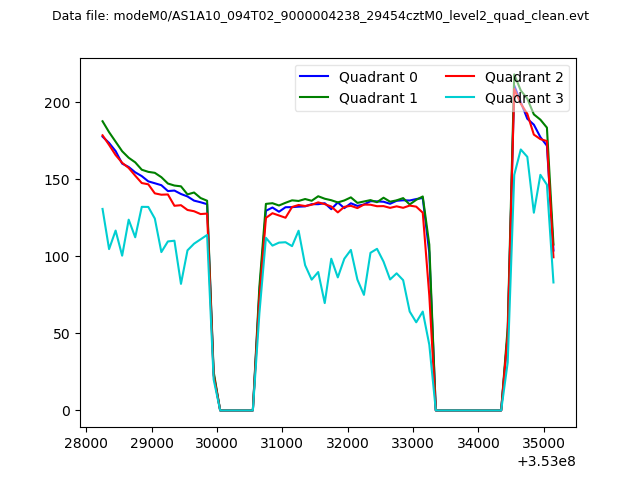
| Quadrant-wise count rates Data is divided into 100 sec bins |
 |
|
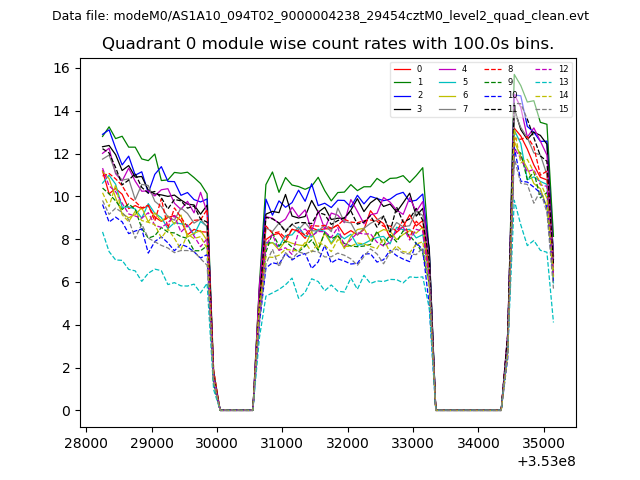
| Module-wise count rates for Quadrant A Data is divided into 100 sec bins |
 |
 |
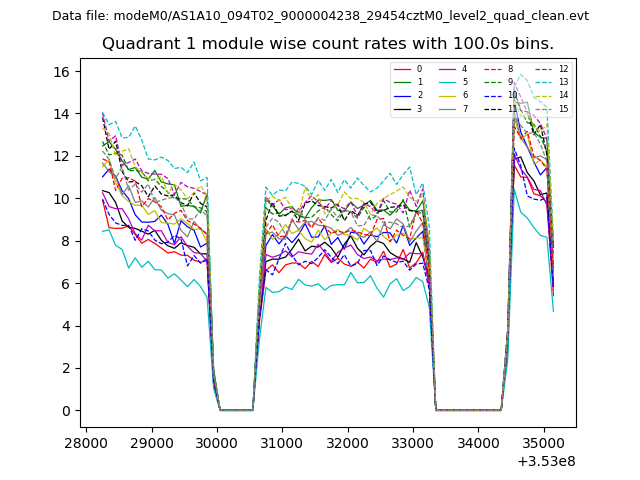
| Module-wise count rates for Quadrant B Data is divided into 100 sec bins |
 |
 |
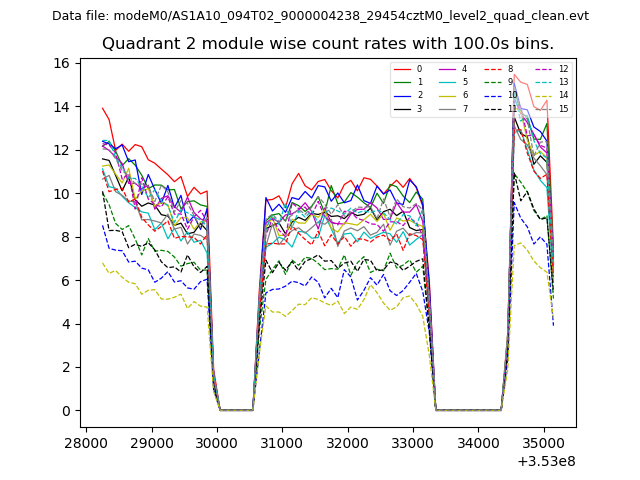
| Module-wise count rates for Quadrant C Data is divided into 100 sec bins |
 |
 |
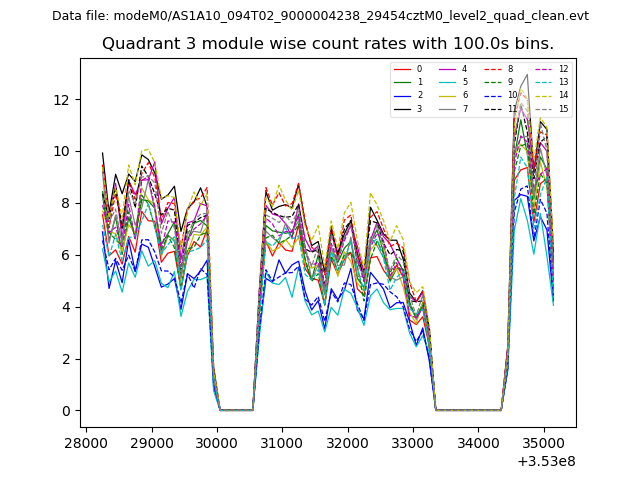
| Module-wise count rates for Quadrant D Data is divided into 100 sec bins |
 |
 |
| Parameter | Plot |
|---|---|
| CZT HV Monitor | 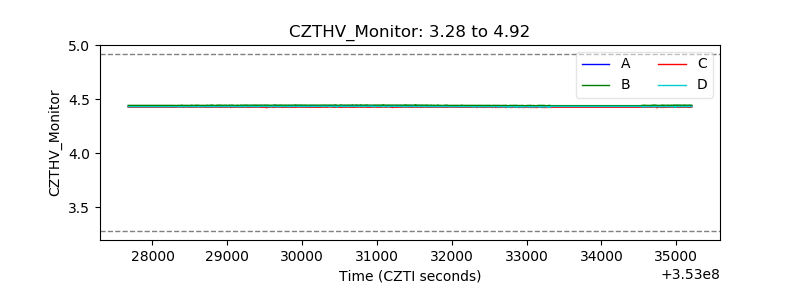 |
| D_VDD | 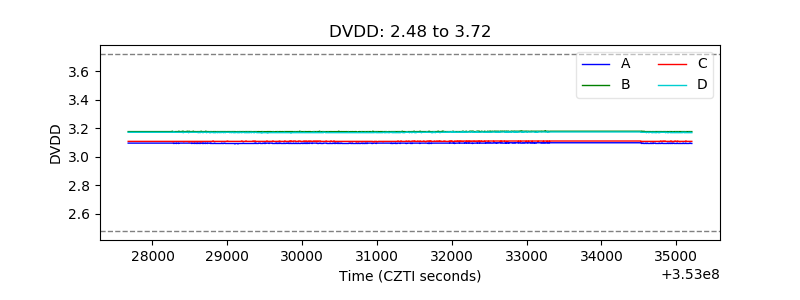 |
| Temperature 1 |  |
| Veto HV Monitor |  |
| Veto LLD |  |
| Alpha Counter | 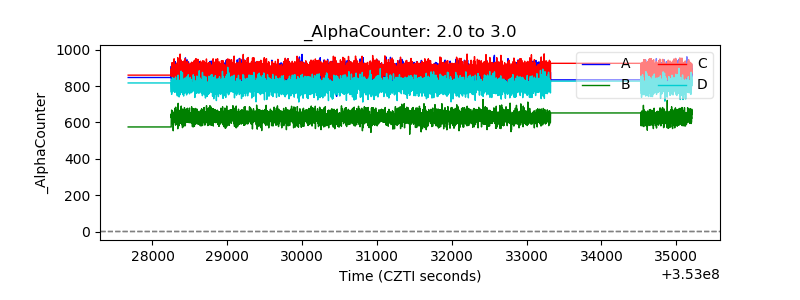 |
| _CPM_Rate | 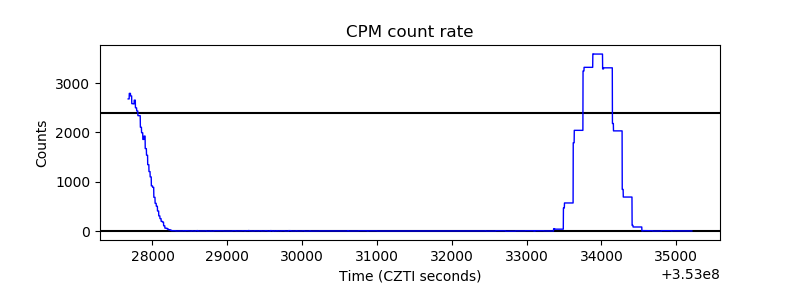 |
| CZT Counter | 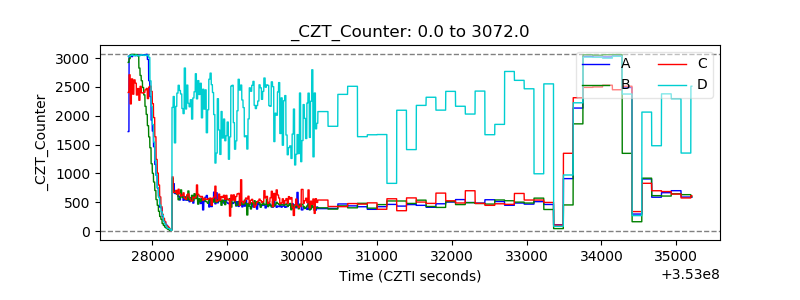 |
| +2.5 Volts monitor |  |
| +5 Volts monitor |  |
| _ROLL_ROT | 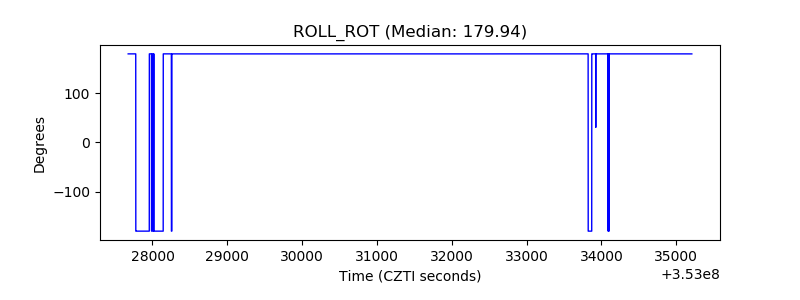 |
| _Roll_DEC | 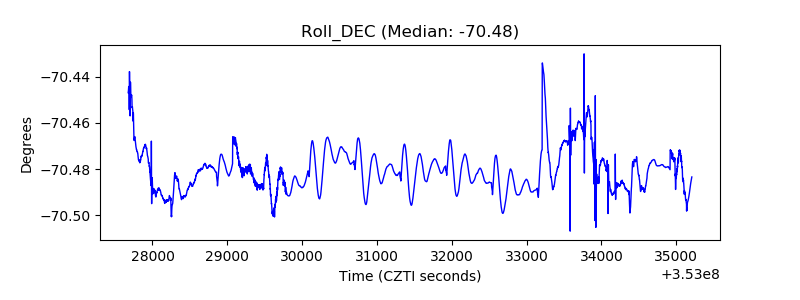 |
| _Roll_RA |  |
| Veto Counter | 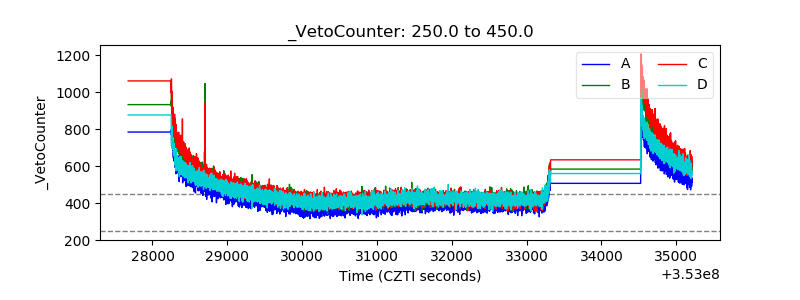 |