| Param | Original file | Final file |
|---|---|---|
| Filename | modeM0/AS1A10_094T02_9000004238_29455cztM0_level2.evt | modeM0/AS1A10_094T02_9000004238_29455cztM0_level2_quad_clean.evt |
| Size (bytes) | 90,889,920 | 17,919,360 |
| Size | 86.7 MB | 17.1 MB |
| Events in quadrant A | 491,338 | 126,419 |
| Events in quadrant B | 432,155 | 133,603 |
| Events in quadrant C | 442,623 | 125,628 |
| Events in quadrant D | 1,337,392 | 101,306 |
| Mode M0 | |||
|---|---|---|---|
| Quadrant | BADHDUFLAG | Total packets | Discarded packets |
| A | 0 | 1986 | 0 |
| B | 0 | 1779 | 0 |
| C | 0 | 1884 | 0 |
| D | 0 | 4450 | 0 |
| Mode SS | |||
|---|---|---|---|
| Quadrant | BADHDUFLAG | Total packets | Discarded packets |
| A | 0 | 12 | 0 |
| B | 0 | 12 | 0 |
| C | 0 | 12 | 0 |
| D | 0 | 12 | 0 |
| Quadrant | Total seconds | Saturated seconds | Saturation percentage |
|---|---|---|---|
| A | 687 | 9 | 1.310044% |
| B | 687 | 2 | 0.291121% |
| C | 687 | 15 | 2.183406% |
| D | 688 | 259 | 37.645349% |
Noise dominated data is calculated using 1-second bins in cleaned event files. If a bin has >2000 counts, and if more than 50% of those come from <1% of pixels, then it is considered to be noise-dominated and hence unusable.
| Quadrant | # 1 sec bins | Bins with >0 counts | Bins with >2000 counts | High rate bins dominated by noise | Noise dominated (total time) | Noise dominated (detector-on time) | Marked lightcurve |
|---|---|---|---|---|---|---|---|
| A | 687 | 687 | 7 | 7 | 1.02% | 1.02% | 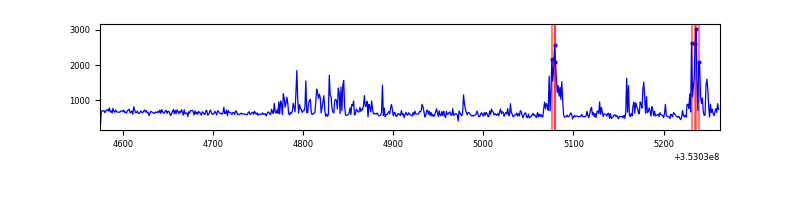 |
| B | 687 | 687 | 0 | 0 | 0.00% | 0.00% | 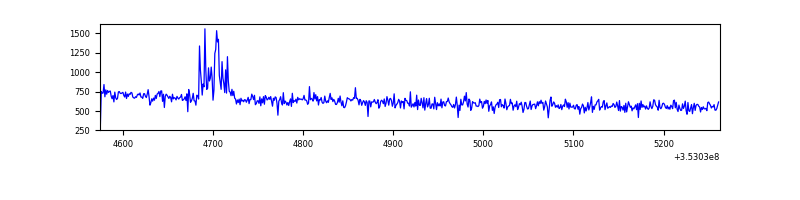 |
| C | 687 | 687 | 0 | 0 | 0.00% | 0.00% | 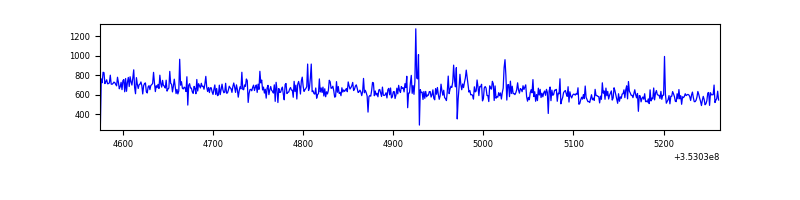 |
| D | 688 | 688 | 264 | 264 | 38.37% | 38.37% | 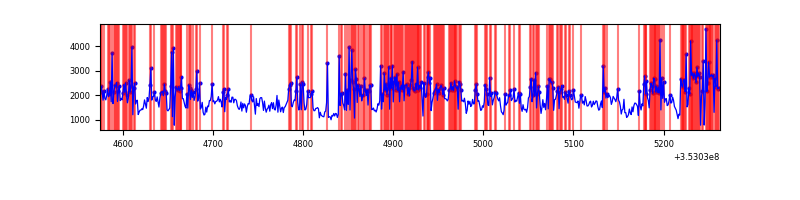 |
Top three noisy pixels from each quadrant. If the there are fewer than three noisy pixels in the level2.evt file, extra rows are filled as -1
| Pixel properties | Quadrant properties | ||||||
|---|---|---|---|---|---|---|---|
| Quadrant | DetID | PixID | Counts | Sigma | Mean | Median | Sigma |
| A | 0 | 13 | 89833 | 4001.56 | 104 | 102 | 22.4 |
| A | 13 | 254 | 1414 | 58.51 | 104 | 102 | 22.4 |
| A | 0 | 226 | 869 | 34.2 | 104 | 102 | 22.4 |
| B | 5 | 255 | 12542 | 575.98 | 107 | 105 | 21.6 |
| B | 12 | 111 | 2210 | 97.49 | 107 | 105 | 21.6 |
| B | 11 | 111 | 1909 | 83.55 | 107 | 105 | 21.6 |
| C | 14 | 238 | 22233 | 864.13 | 103 | 104 | 25.6 |
| C | 3 | 233 | 7870 | 303.26 | 103 | 104 | 25.6 |
| C | 14 | 254 | 6071 | 233.01 | 103 | 104 | 25.6 |
| D | 8 | 195 | 700372 | 29940.21 | 91 | 89 | 23.4 |
| D | 1 | 52 | 190075 | 8122.75 | 91 | 89 | 23.4 |
| D | 13 | 153 | 70902 | 3027.57 | 91 | 89 | 23.4 |
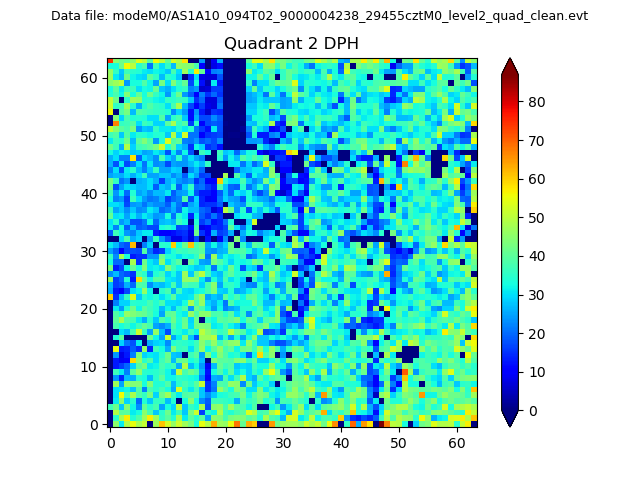
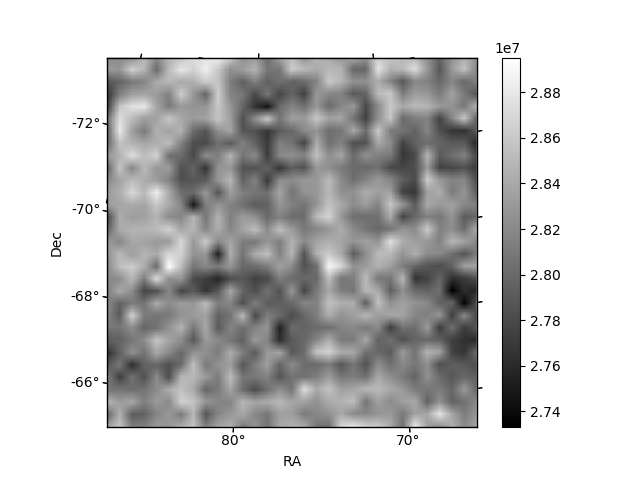
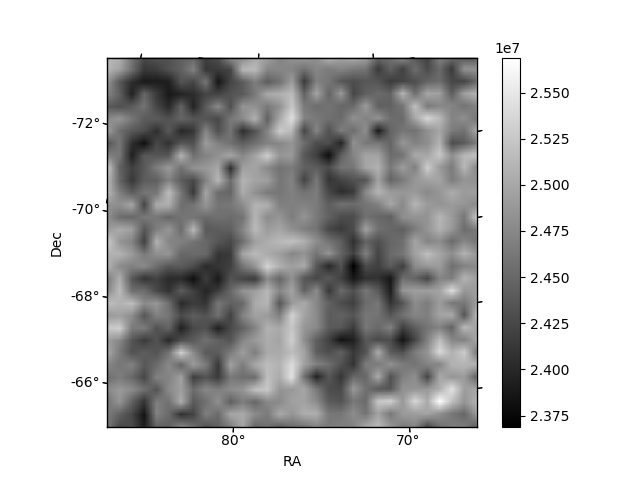
Histogram calculated using DETX and DETY for each event in the final _common_clean file
| Quadrant A | 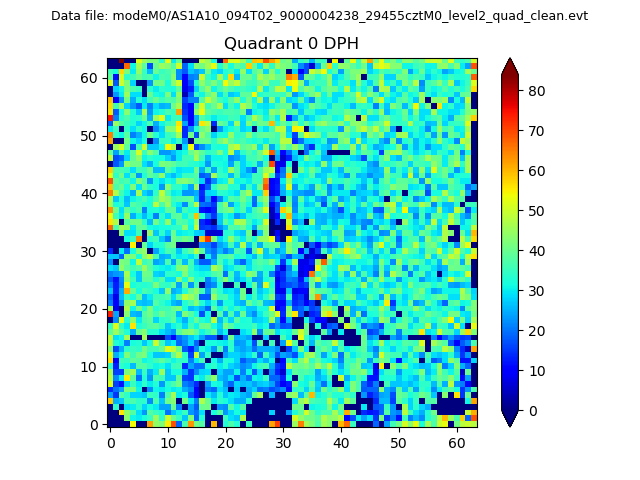 |
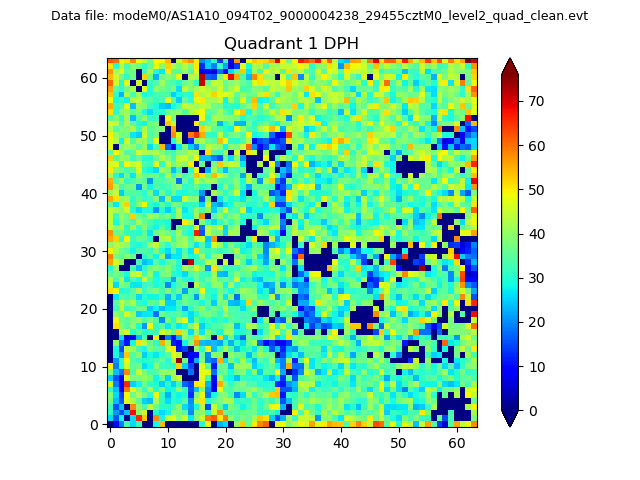 |
Quadrant B |
|---|---|---|---|
| Quadrant D | 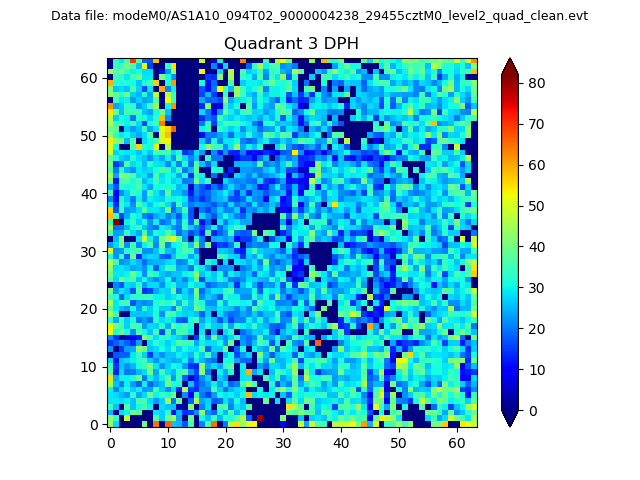 |
 |
Quadrant C |
| Plot type | Count rate plots | Images |
|---|---|---|
| Comparison with Poisson distribution Blue bars denote a histogram of data divided into 1 sec bins. Red curve is a Poisson curve with rate = median count rate of data. |
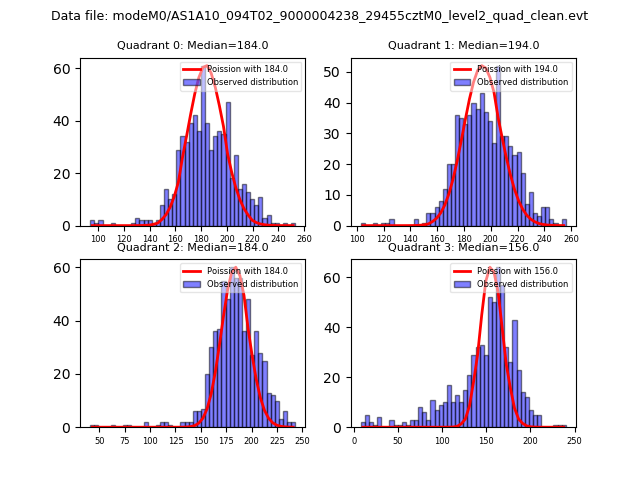 |
 |
| Quadrant-wise count rates Data is divided into 100 sec bins |
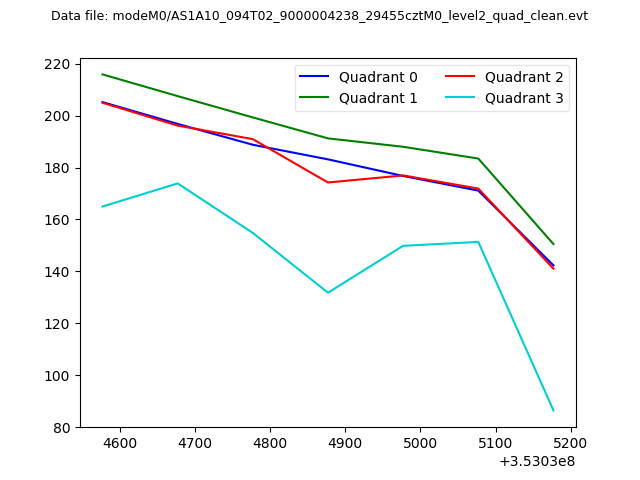 |
|
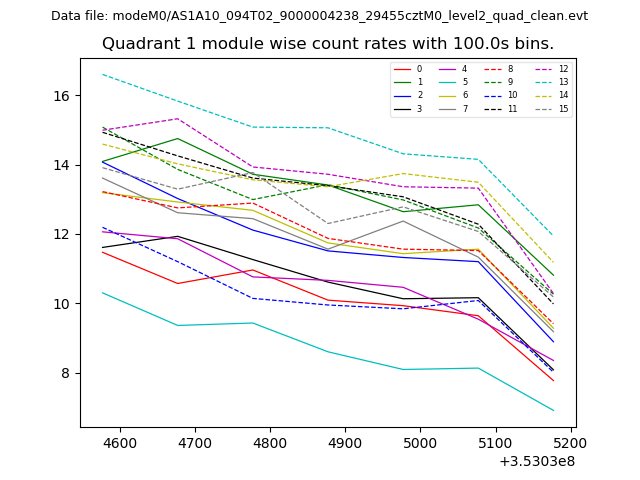
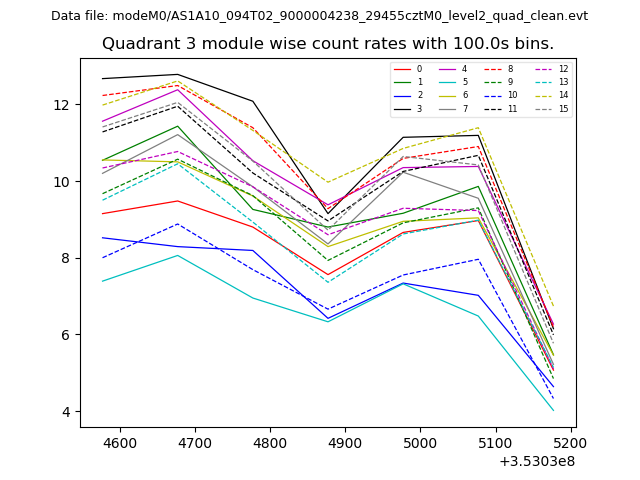
| Module-wise count rates for Quadrant A Data is divided into 100 sec bins |
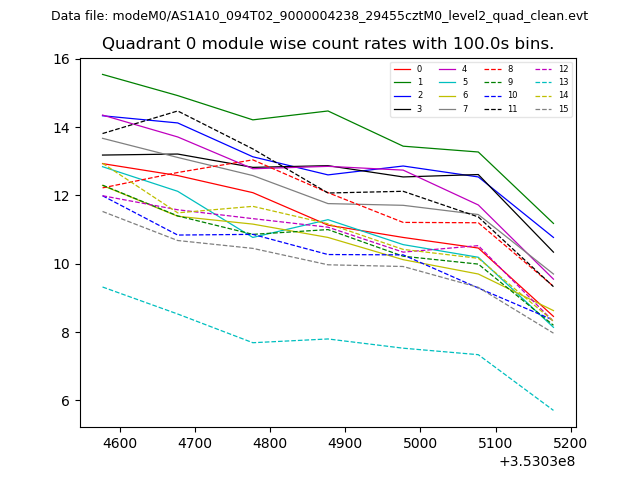 |
 |
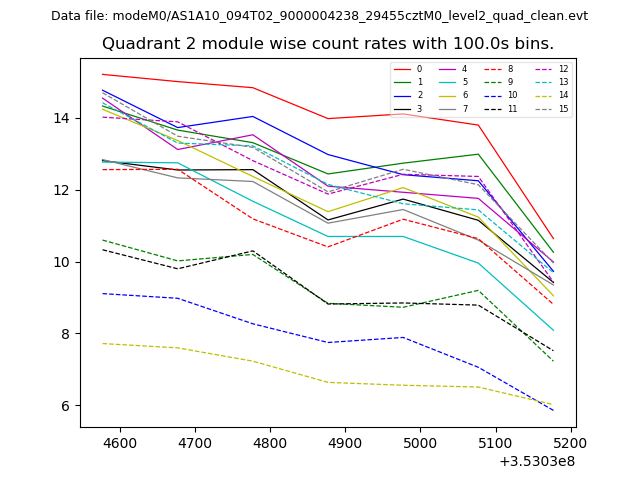
| Module-wise count rates for Quadrant B Data is divided into 100 sec bins |
 |
 |
| Module-wise count rates for Quadrant C Data is divided into 100 sec bins |
 |
 |
| Module-wise count rates for Quadrant D Data is divided into 100 sec bins |
 |
 |
| Parameter | Plot |
|---|---|
| CZT HV Monitor | 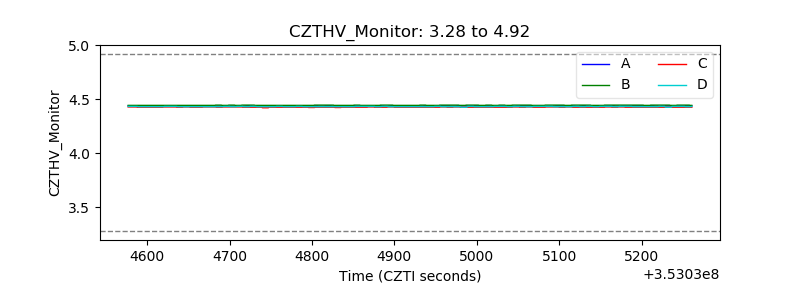 |
| D_VDD | 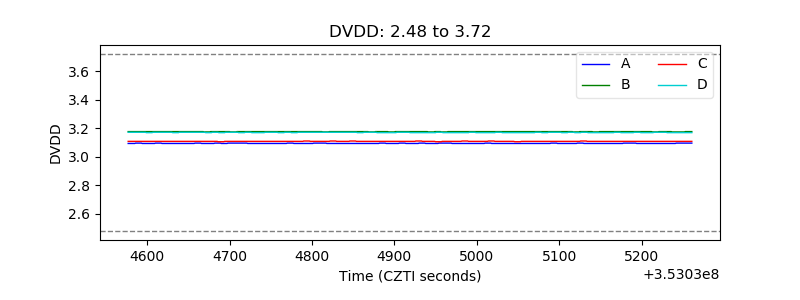 |
| Temperature 1 | 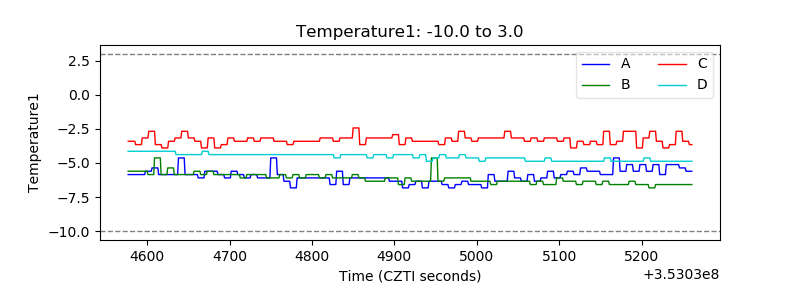 |
| Veto HV Monitor | 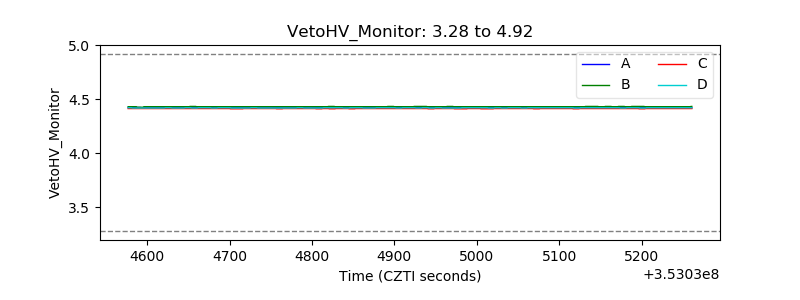 |
| Veto LLD | 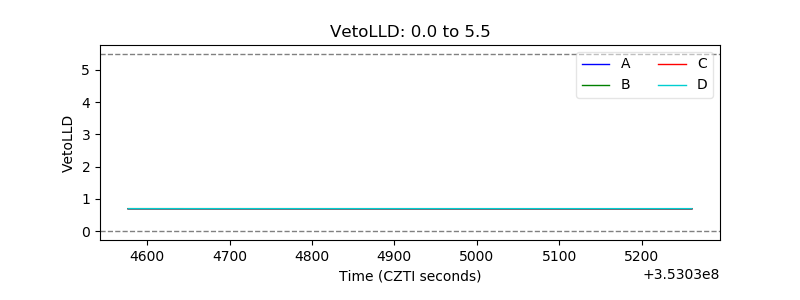 |
| Alpha Counter | 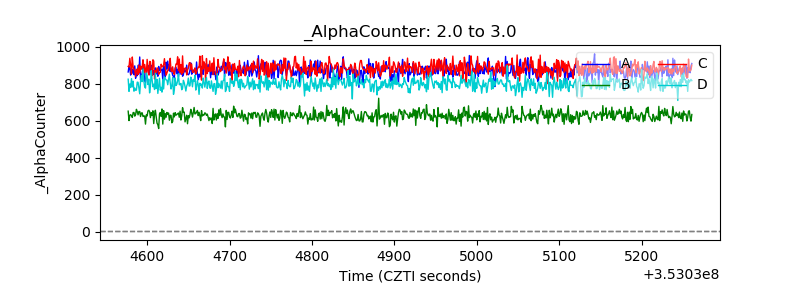 |
| _CPM_Rate | 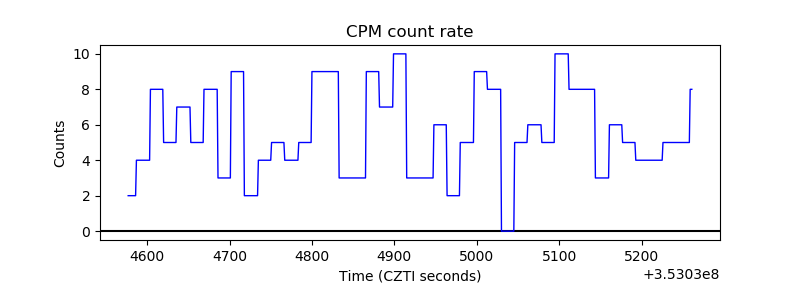 |
| CZT Counter |  |
| +2.5 Volts monitor |  |
| +5 Volts monitor |  |
| _ROLL_ROT | 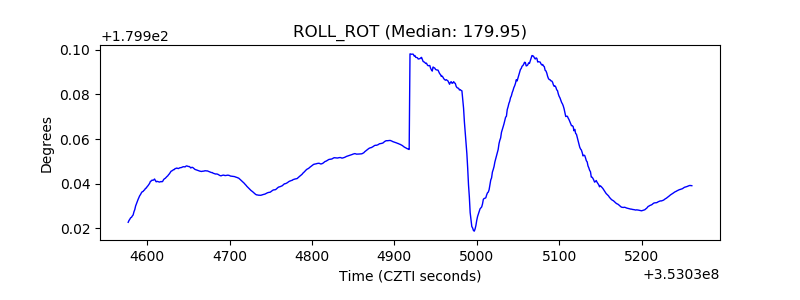 |
| _Roll_DEC | 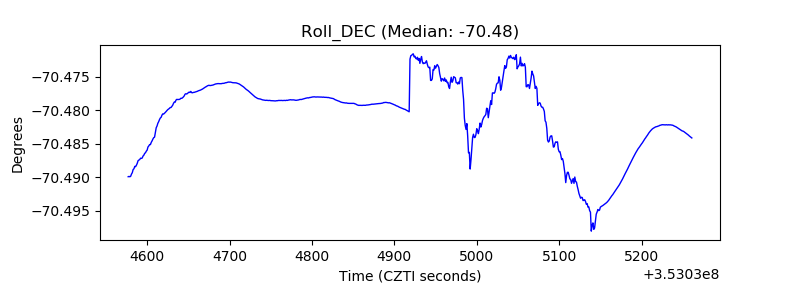 |
| _Roll_RA |  |
| Veto Counter | 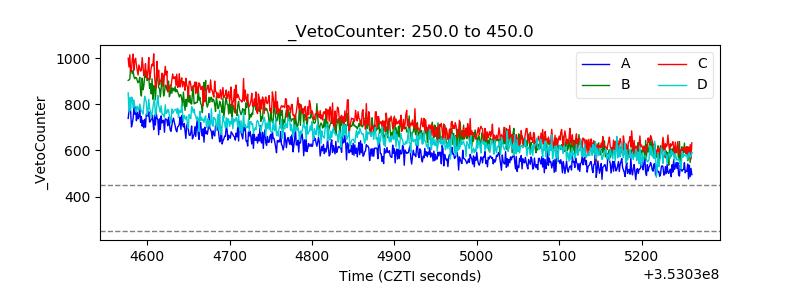 |