| Param | Original file | Final file |
|---|---|---|
| Filename | modeM0/AS1A10_102T08_9000004240cztM0_level2.fits | modeM0/AS1A10_102T08_9000004240cztM0_level2_quad_clean.evt |
| Size (bytes) | 521,009,280 | 362,586,240 |
| Size | 496.9 MB | 345.8 MB |
| Events in quadrant A | 3,491,362 | 2,252,022 |
| Events in quadrant B | 3,343,644 | 2,264,554 |
| Events in quadrant C | 3,278,490 | 1,970,524 |
| Events in quadrant D | 1,943,740 | 786,520 |
| Mode M0 | |||
|---|---|---|---|
| Quadrant | BADHDUFLAG | Total packets | Discarded packets |
| A | 0 | 116570 | 0 |
| B | 0 | 115499 | 0 |
| C | 0 | 122463 | 0 |
| D | 0 | 376159 | 0 |
| Mode M9 | |||
|---|---|---|---|
| Quadrant | BADHDUFLAG | Total packets | Discarded packets |
| A | 0 | 83 | 0 |
| B | 0 | 83 | 0 |
| C | 0 | 83 | 0 |
| D | 0 | 83 | 0 |
| Mode SS | |||
|---|---|---|---|
| Quadrant | BADHDUFLAG | Total packets | Discarded packets |
| A | 0 | 1098 | 0 |
| B | 0 | 1100 | 0 |
| C | 0 | 1098 | 0 |
| D | 0 | 1098 | 0 |
| Quadrant | Total seconds | Saturated seconds | Saturation percentage |
|---|---|---|---|
| A | 54024 | 983 | 1.819562% |
| B | 54009 | 1182 | 2.188524% |
| C | 54021 | 3837 | 7.102793% |
| D | 53850 | 34343 | 63.775302% |
Noise dominated data is calculated using 1-second bins in cleaned event files. If a bin has >2000 counts, and if more than 50% of those come from <1% of pixels, then it is considered to be noise-dominated and hence unusable.
| Quadrant | # 1 sec bins | Bins with >0 counts | Bins with >2000 counts | High rate bins dominated by noise | Noise dominated (total time) | Noise dominated (detector-on time) | Marked lightcurve |
|---|---|---|---|---|---|---|---|
| A | 68363 | 54116 | 0 | 0 | 0.00% | 0.00% | 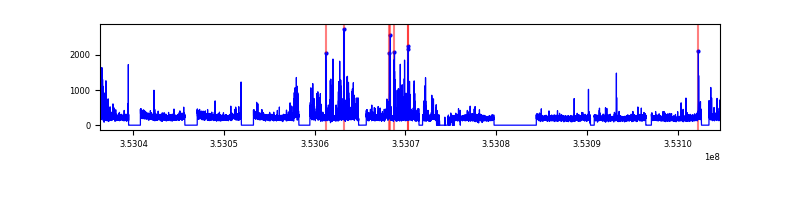 |
| B | 68363 | 54096 | 0 | 0 | 0.00% | 0.00% | 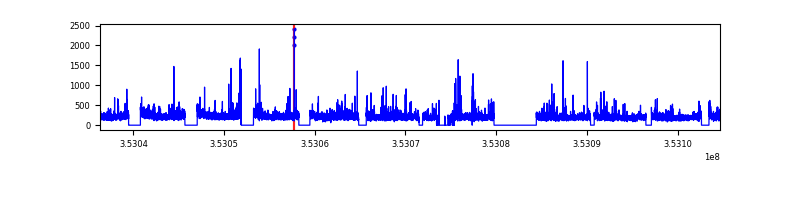 |
| C | 68363 | 54053 | 0 | 0 | 0.00% | 0.00% | 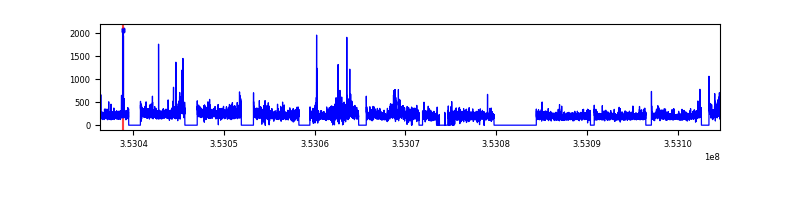 |
| D | 68363 | 51711 | 0 | 0 | 0.00% | 0.00% | 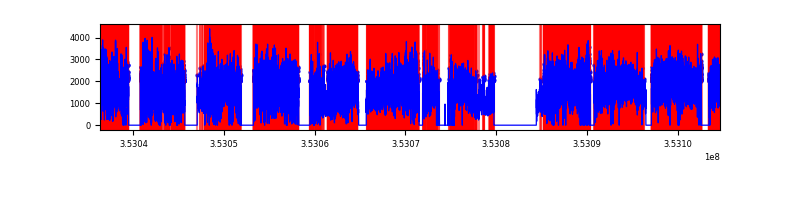 |
Top three noisy pixels from each quadrant. If the there are fewer than three noisy pixels in the level2.evt file, extra rows are filled as -1
| Pixel properties | Quadrant properties | ||||||
|---|---|---|---|---|---|---|---|
| Quadrant | DetID | PixID | Counts | Sigma | Mean | Median | Sigma |
| A | 0 | 29 | 2816 | 8.88 | 911 | 857 | 220.7 |
| A | 7 | 110 | 2677 | 8.25 | 911 | 857 | 220.7 |
| A | 9 | 19 | 2571 | 7.77 | 911 | 857 | 220.7 |
| B | 2 | 9 | 2636 | 10.28 | 885 | 845 | 174.2 |
| B | 3 | 17 | 2242 | 8.02 | 885 | 845 | 174.2 |
| B | 5 | 232 | 2237 | 7.99 | 885 | 845 | 174.2 |
| C | 1 | 80 | 2497 | 7.67 | 865 | 809 | 220.1 |
| C | 1 | 81 | 2448 | 7.45 | 865 | 809 | 220.1 |
| C | 12 | 241 | 2268 | 6.63 | 865 | 809 | 220.1 |
| D | 15 | 46 | 1440 | 6.34 | 555 | 507 | 147.2 |
| D | 3 | 14 | 1378 | 5.92 | 555 | 507 | 147.2 |
| D | 6 | 231 | 1376 | 5.91 | 555 | 507 | 147.2 |
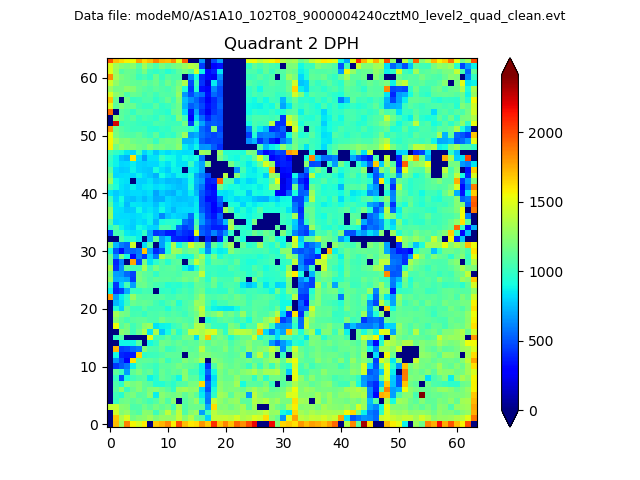
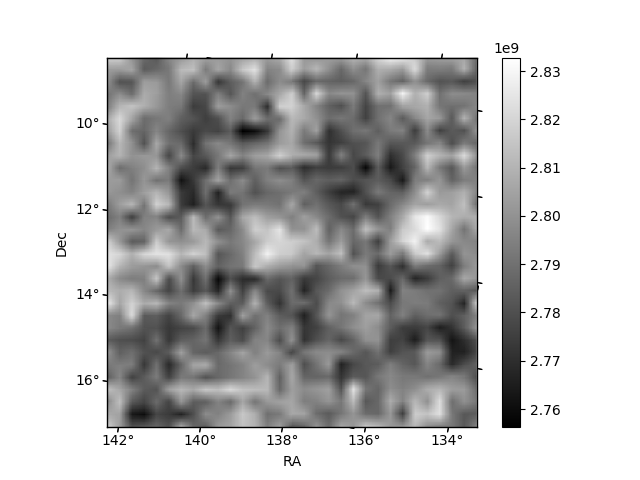
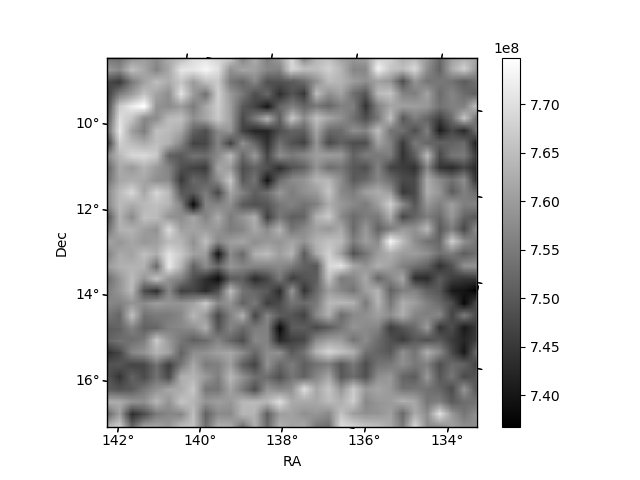
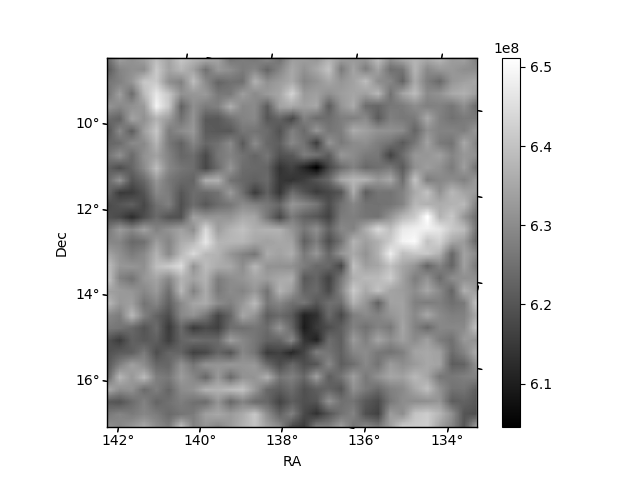
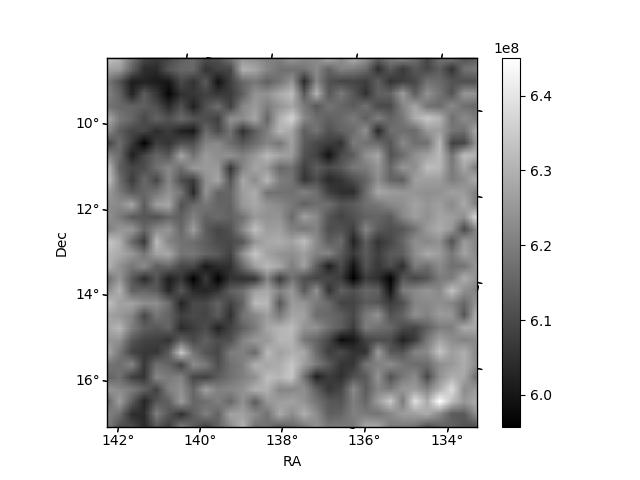
Histogram calculated using DETX and DETY for each event in the final _common_clean file
| Quadrant A | 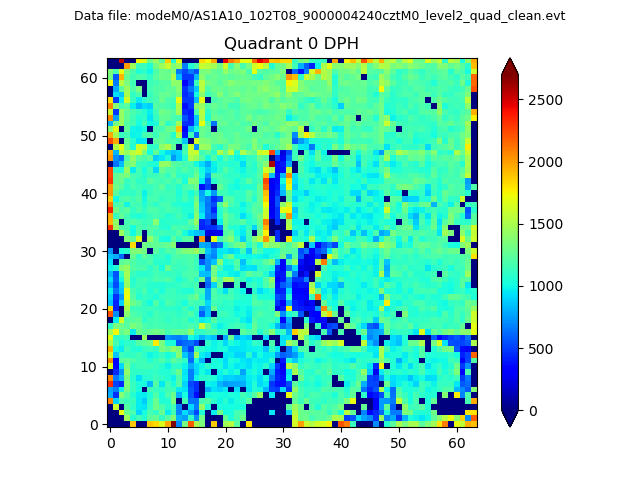 |
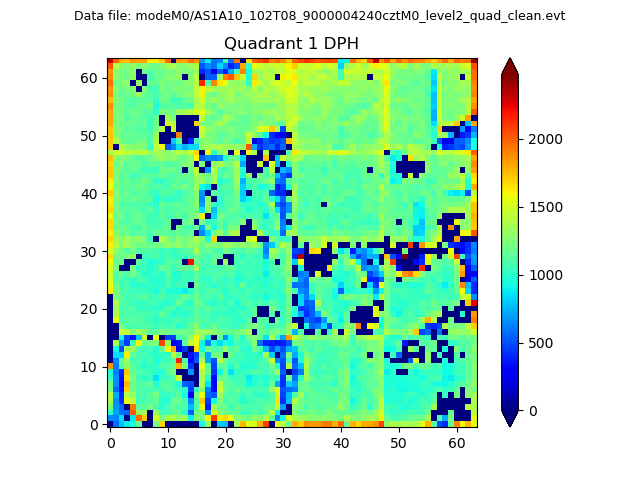 |
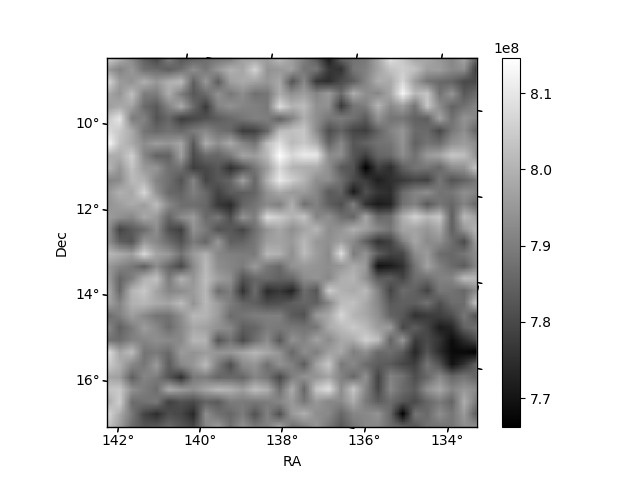
Quadrant B |
|---|---|---|---|
| Quadrant D | 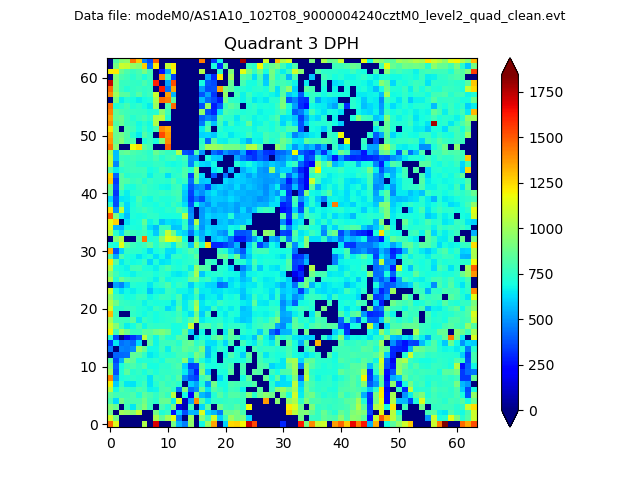 |
 |
Quadrant C |
| Plot type | Count rate plots | Images |
|---|---|---|
| Comparison with Poisson distribution Blue bars denote a histogram of data divided into 1 sec bins. Red curve is a Poisson curve with rate = median count rate of data. |
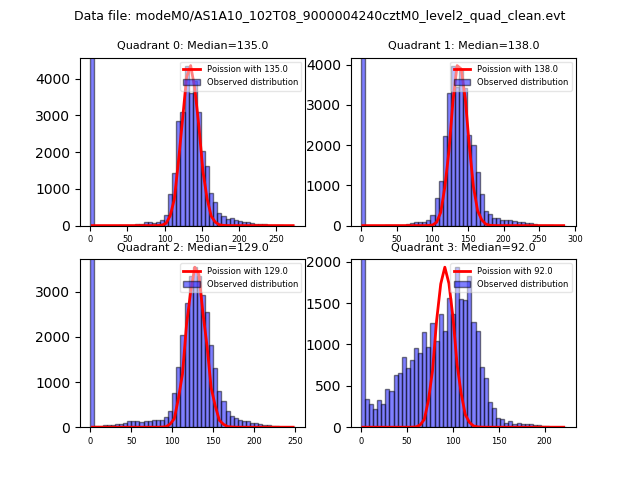 |
 |
| Quadrant-wise count rates Data is divided into 100 sec bins |
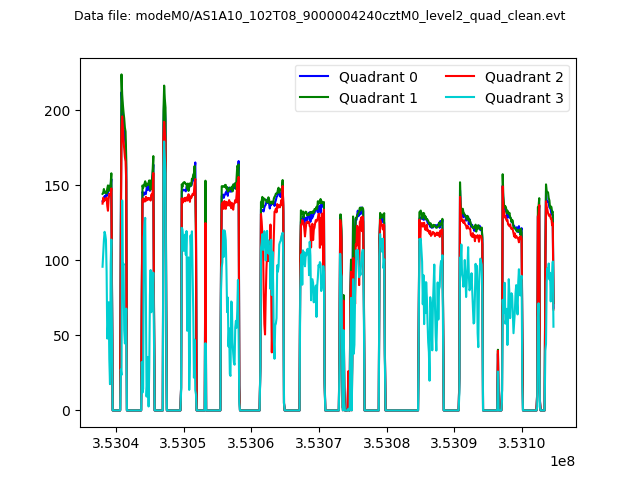 |
|
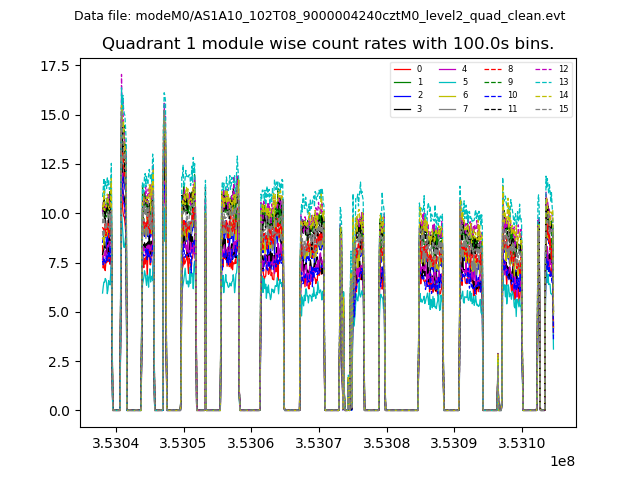
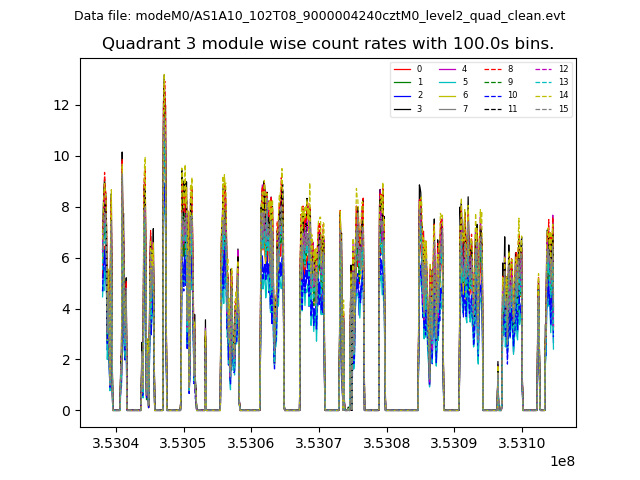
| Module-wise count rates for Quadrant A Data is divided into 100 sec bins |
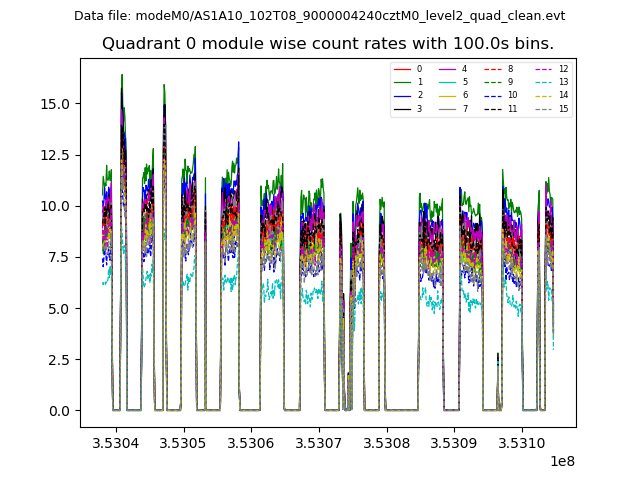 |
 |
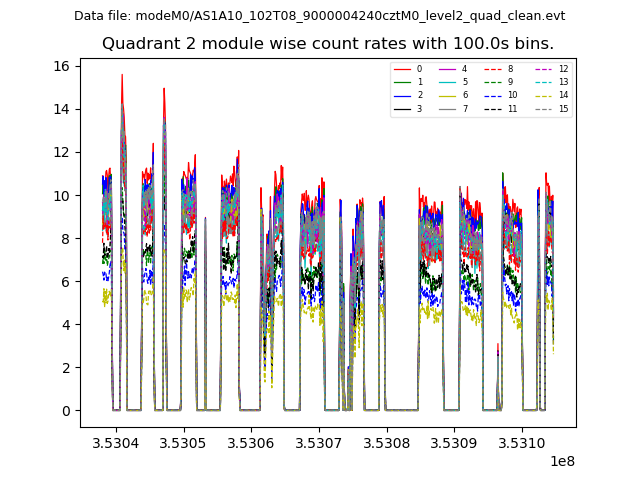
| Module-wise count rates for Quadrant B Data is divided into 100 sec bins |
 |
 |
| Module-wise count rates for Quadrant C Data is divided into 100 sec bins |
 |
 |
| Module-wise count rates for Quadrant D Data is divided into 100 sec bins |
 |
 |
| Parameter | Plot |
|---|---|
| CZT HV Monitor | 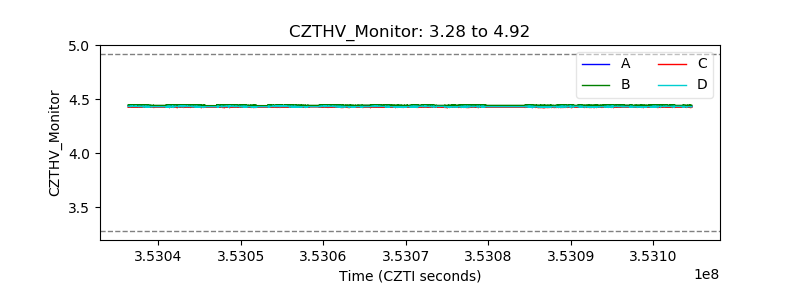 |
| D_VDD | 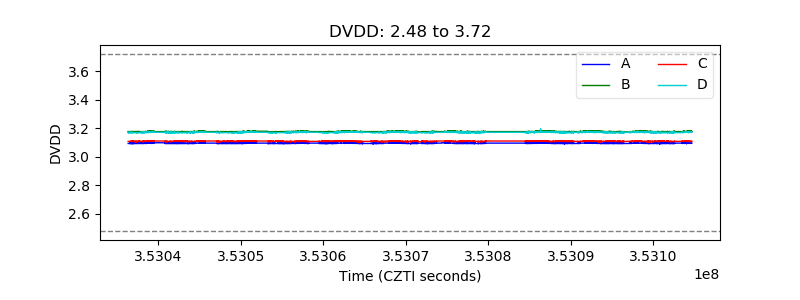 |
| Temperature 1 | 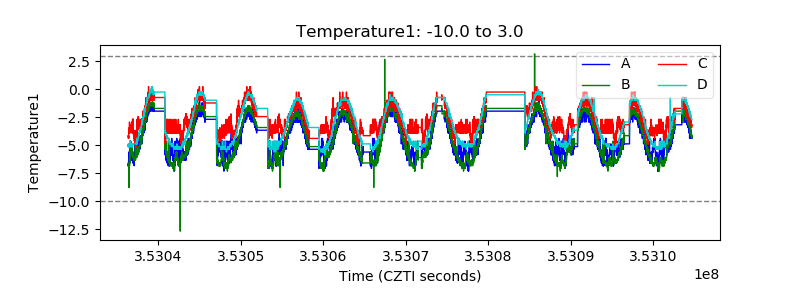 |
| Veto HV Monitor | 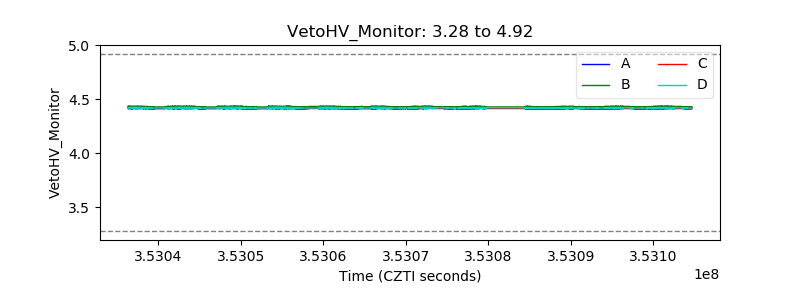 |
| Veto LLD | 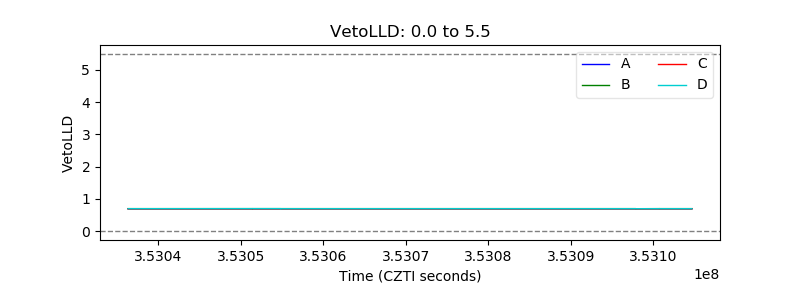 |
| Alpha Counter | 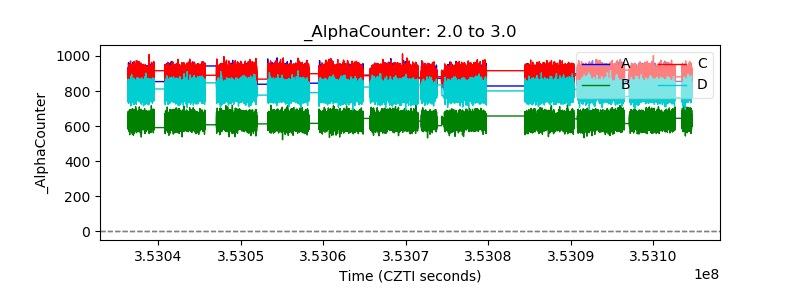 |
| _CPM_Rate | 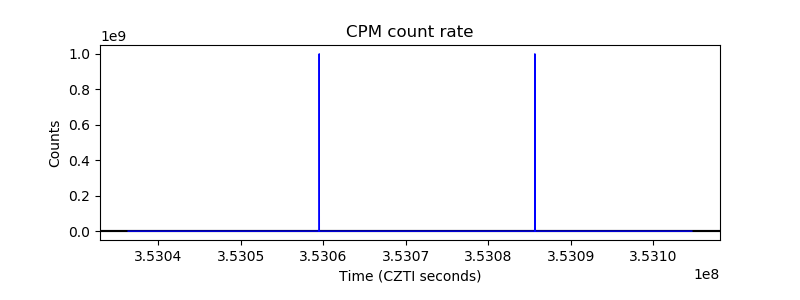 |
| CZT Counter | 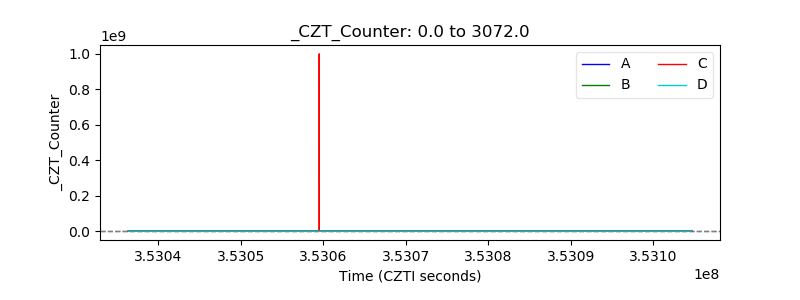 |
| +2.5 Volts monitor | 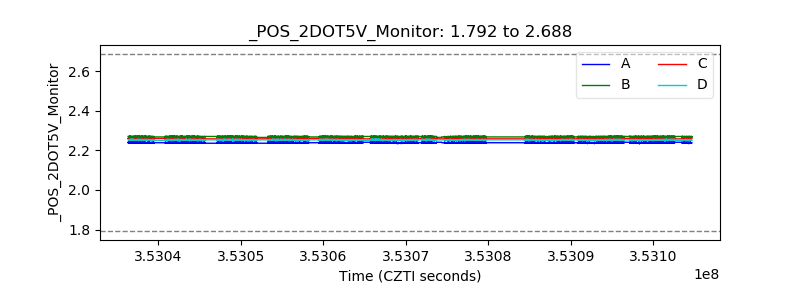 |
| +5 Volts monitor | 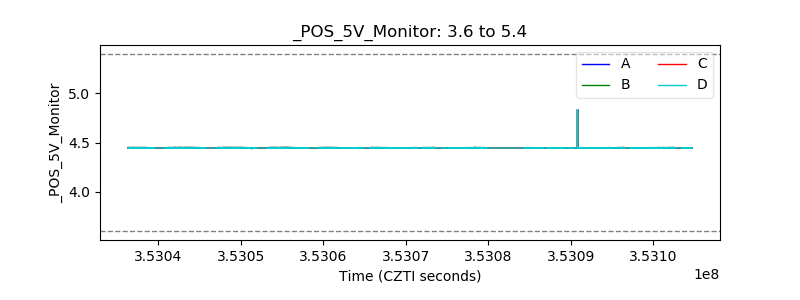 |
| _ROLL_ROT | 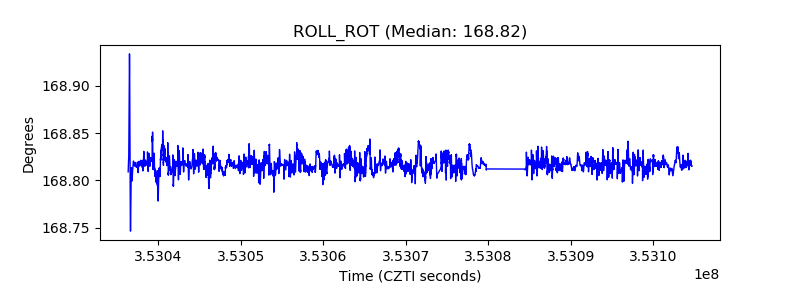 |
| _Roll_DEC | 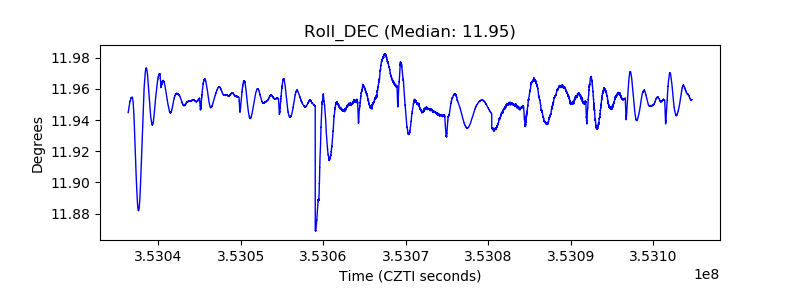 |
| _Roll_RA | 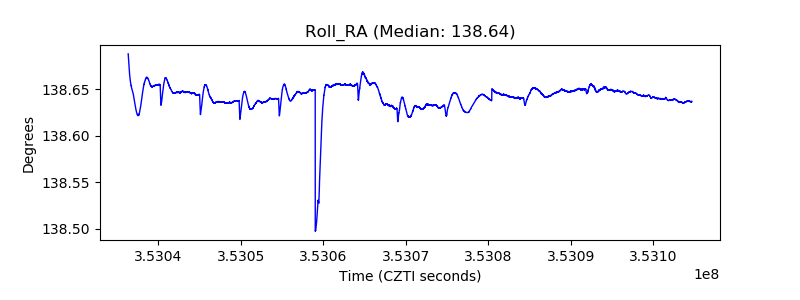 |
| Veto Counter | 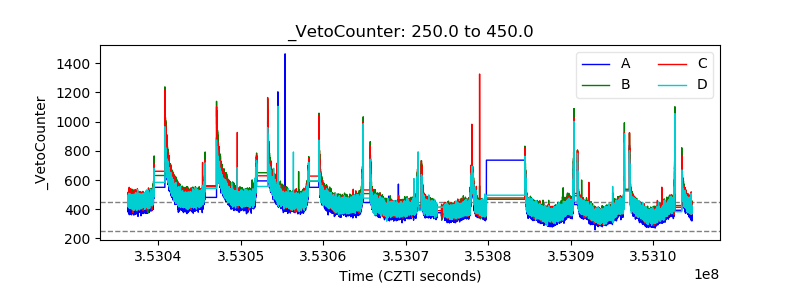 |