| Param | Original file | Final file |
|---|---|---|
| Filename | modeM0/AS1A10_102T08_9000004240_29455cztM0_level2.evt | modeM0/AS1A10_102T08_9000004240_29455cztM0_level2_quad_clean.evt |
| Size (bytes) | 592,300,800 | 53,297,280 |
| Size | 564.9 MB | 50.8 MB |
| Events in quadrant A | 2,442,000 | 373,198 |
| Events in quadrant B | 2,420,574 | 384,899 |
| Events in quadrant C | 2,530,680 | 356,335 |
| Events in quadrant D | 10,242,439 | 184,655 |
| Mode M0 | |||
|---|---|---|---|
| Quadrant | BADHDUFLAG | Total packets | Discarded packets |
| A | 0 | 9844 | 1 |
| B | 0 | 9810 | 1 |
| C | 0 | 10179 | 1 |
| D | 0 | 33425 | 1 |
| Mode M9 | |||
|---|---|---|---|
| Quadrant | BADHDUFLAG | Total packets | Discarded packets |
| A | 0 | 13 | 0 |
| B | 0 | 13 | 0 |
| C | 0 | 13 | 0 |
| D | 0 | 13 | 0 |
| Mode SS | |||
|---|---|---|---|
| Quadrant | BADHDUFLAG | Total packets | Discarded packets |
| A | 0 | 92 | 0 |
| B | 0 | 92 | 0 |
| C | 0 | 92 | 0 |
| D | 0 | 92 | 0 |
| Quadrant | Total seconds | Saturated seconds | Saturation percentage |
|---|---|---|---|
| A | 4454 | 24 | 0.538841% |
| B | 4454 | 37 | 0.830714% |
| C | 4454 | 113 | 2.537045% |
| D | 4454 | 3384 | 75.976650% |
Noise dominated data is calculated using 1-second bins in cleaned event files. If a bin has >2000 counts, and if more than 50% of those come from <1% of pixels, then it is considered to be noise-dominated and hence unusable.
| Quadrant | # 1 sec bins | Bins with >0 counts | Bins with >2000 counts | High rate bins dominated by noise | Noise dominated (total time) | Noise dominated (detector-on time) | Marked lightcurve |
|---|---|---|---|---|---|---|---|
| A | 5754 | 4455 | 2 | 2 | 0.03% | 0.04% | 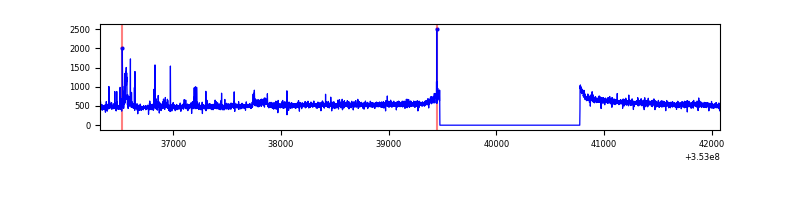 |
| B | 5754 | 4455 | 0 | 0 | 0.00% | 0.00% | 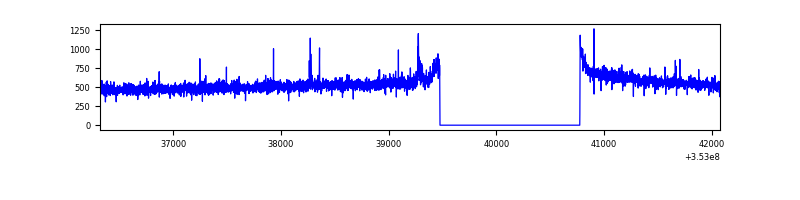 |
| C | 5754 | 4455 | 10 | 10 | 0.17% | 0.22% | 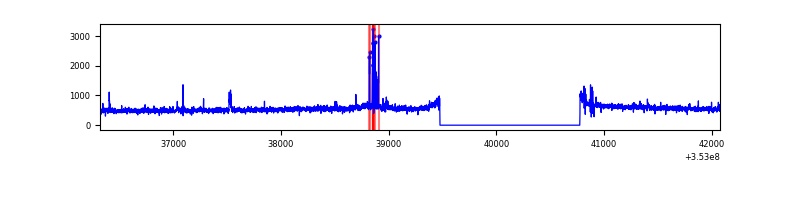 |
| D | 5754 | 4455 | 3185 | 3185 | 55.35% | 71.49% | 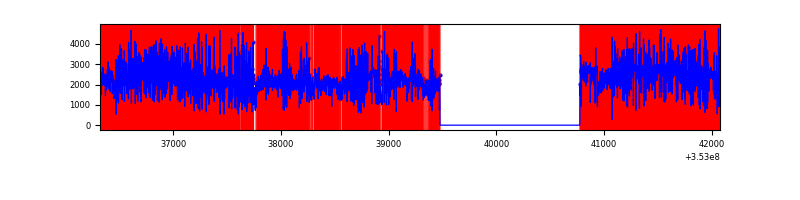 |
Top three noisy pixels from each quadrant. If the there are fewer than three noisy pixels in the level2.evt file, extra rows are filled as -1
| Pixel properties | Quadrant properties | ||||||
|---|---|---|---|---|---|---|---|
| Quadrant | DetID | PixID | Counts | Sigma | Mean | Median | Sigma |
| A | 0 | 13 | 86410 | 706.55 | 609 | 600 | 121.4 |
| A | 13 | 254 | 8582 | 65.72 | 609 | 600 | 121.4 |
| A | 3 | 137 | 5548 | 40.74 | 609 | 600 | 121.4 |
| B | 12 | 111 | 13781 | 114.85 | 609 | 595 | 114.8 |
| B | 5 | 172 | 12535 | 103.99 | 609 | 595 | 114.8 |
| B | 11 | 111 | 12318 | 102.1 | 609 | 595 | 114.8 |
| C | 3 | 233 | 120673 | 884.14 | 582 | 588 | 135.8 |
| C | 14 | 238 | 108810 | 796.8 | 582 | 588 | 135.8 |
| C | 14 | 254 | 21690 | 155.36 | 582 | 588 | 135.8 |
| D | 1 | 52 | 4147230 | 44520.25 | 387 | 376 | 93.1 |
| D | 8 | 195 | 3964707 | 42560.7 | 387 | 376 | 93.1 |
| D | 7 | 80 | 368039 | 3947.2 | 387 | 376 | 93.1 |
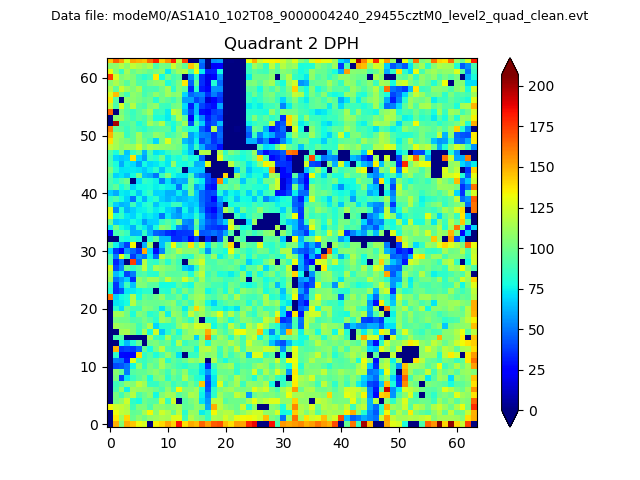
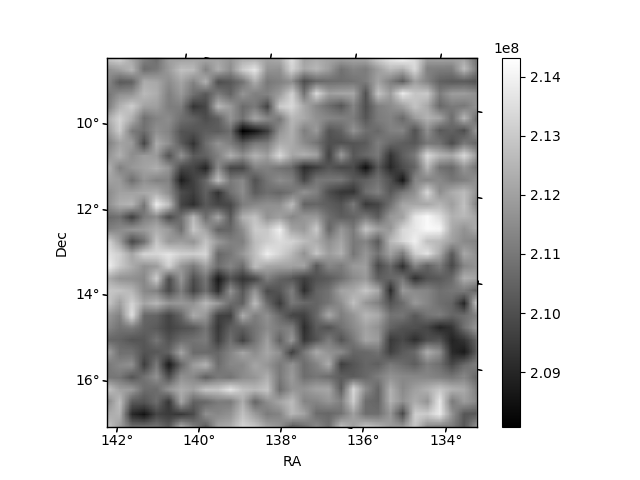
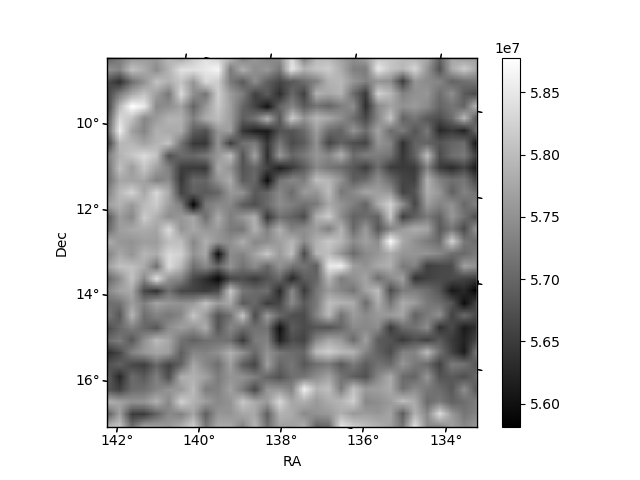
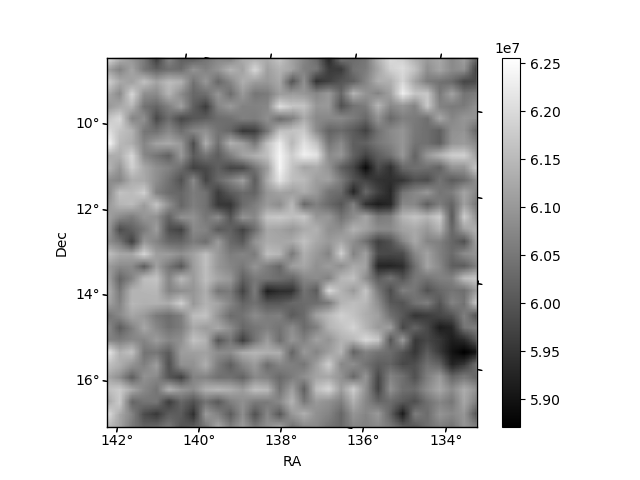
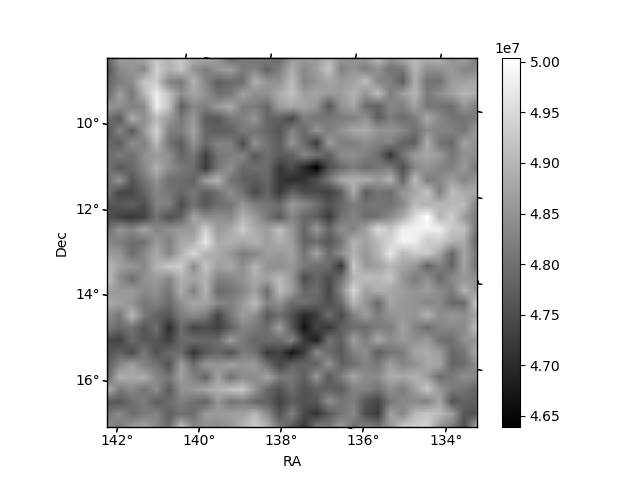
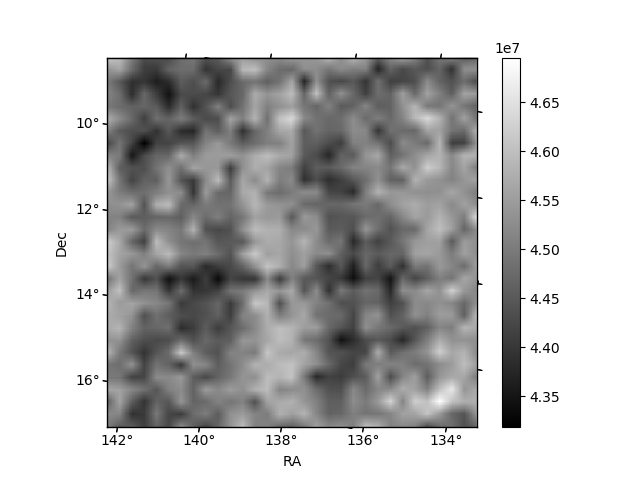
Histogram calculated using DETX and DETY for each event in the final _common_clean file
| Quadrant A | 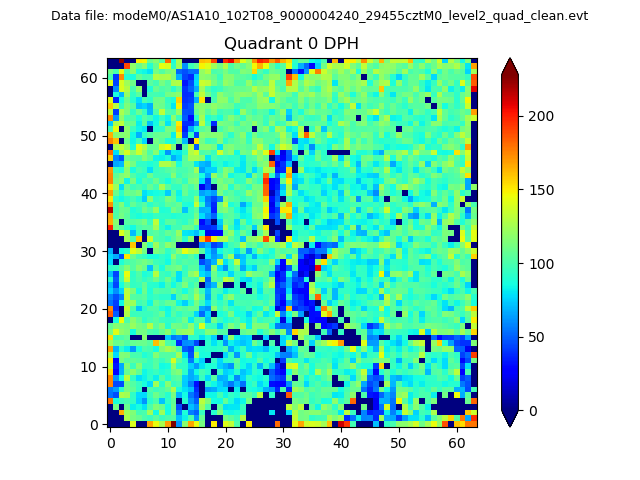 |
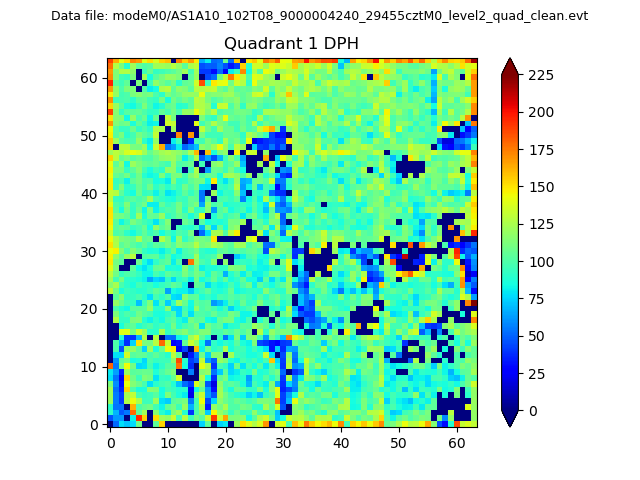 |
Quadrant B |
|---|---|---|---|
| Quadrant D | 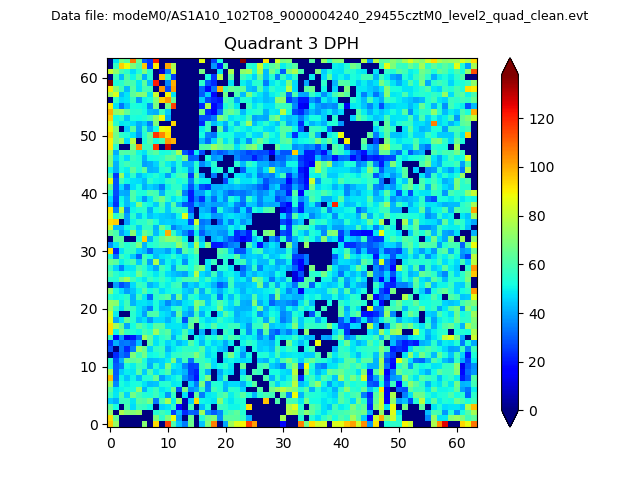 |
 |
Quadrant C |
| Plot type | Count rate plots | Images |
|---|---|---|
| Comparison with Poisson distribution Blue bars denote a histogram of data divided into 1 sec bins. Red curve is a Poisson curve with rate = median count rate of data. |
 |
 |
| Quadrant-wise count rates Data is divided into 100 sec bins |
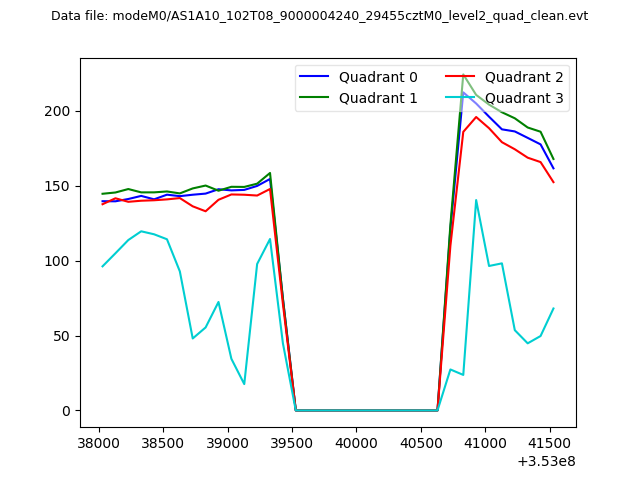 |
|
| Module-wise count rates for Quadrant A Data is divided into 100 sec bins |
 |
 |
| Module-wise count rates for Quadrant B Data is divided into 100 sec bins |
 |
 |
| Module-wise count rates for Quadrant C Data is divided into 100 sec bins |
 |
 |
| Module-wise count rates for Quadrant D Data is divided into 100 sec bins |
 |
 |
| Parameter | Plot |
|---|---|
| CZT HV Monitor |  |
| D_VDD | 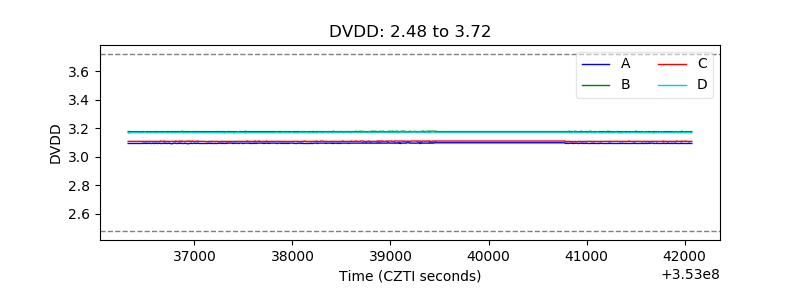 |
| Temperature 1 | 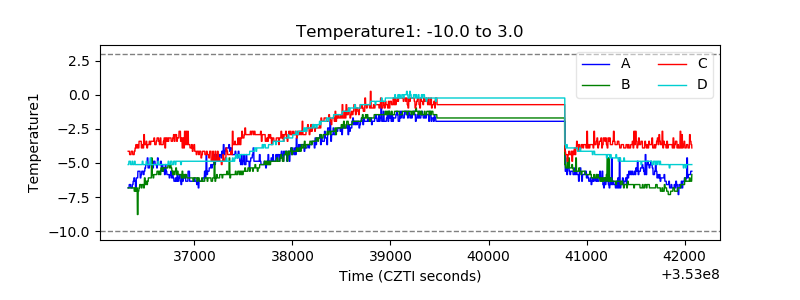 |
| Veto HV Monitor | 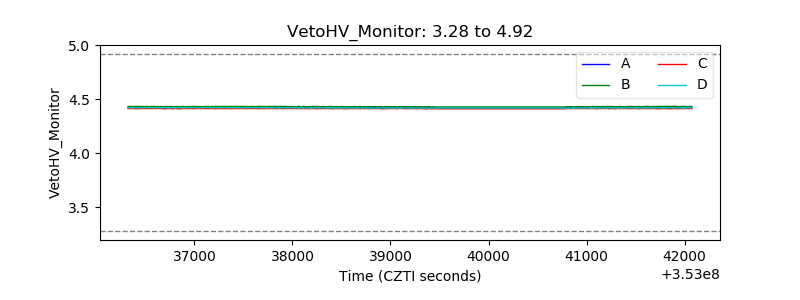 |
| Veto LLD | 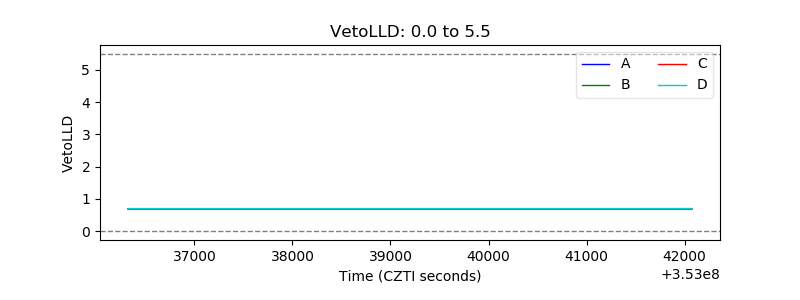 |
| Alpha Counter | 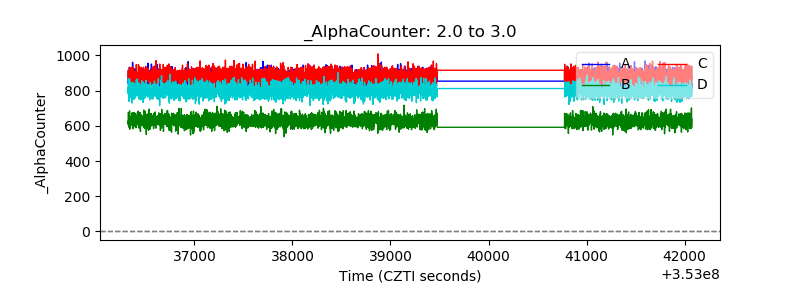 |
| _CPM_Rate | 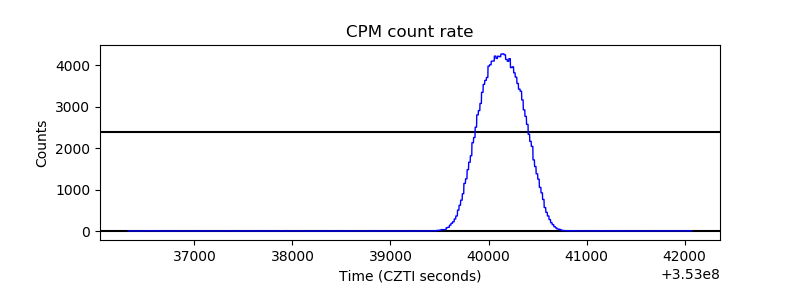 |
| CZT Counter | 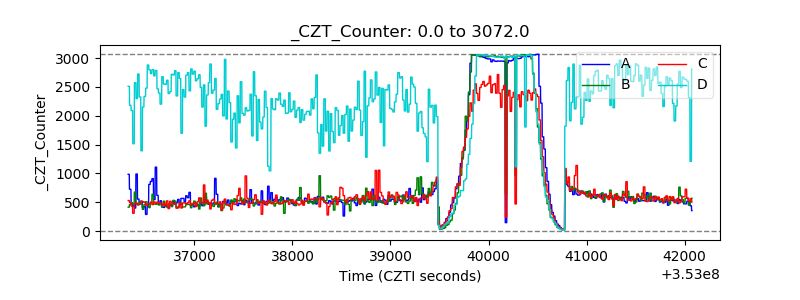 |
| +2.5 Volts monitor |  |
| +5 Volts monitor |  |
| _ROLL_ROT |  |
| _Roll_DEC | 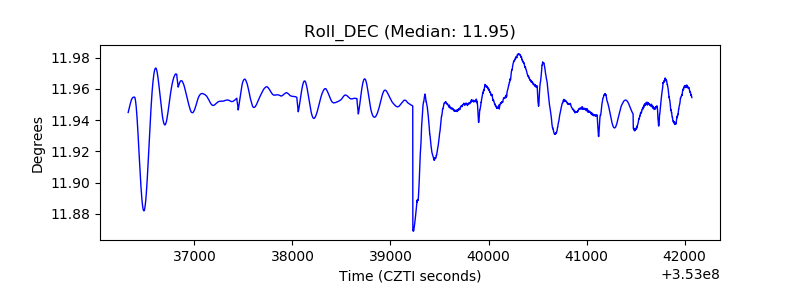 |
| _Roll_RA | 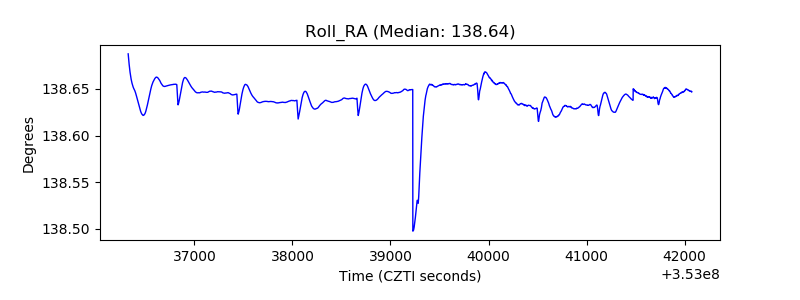 |
| Veto Counter |  |