| Param | Original file | Final file |
|---|---|---|
| Filename | modeM0/AS1A10_102T08_9000004240_29456cztM0_level2.evt | modeM0/AS1A10_102T08_9000004240_29456cztM0_level2_quad_clean.evt |
| Size (bytes) | 754,580,160 | 68,209,920 |
| Size | 719.6 MB | 65.1 MB |
| Events in quadrant A | 3,233,130 | 473,844 |
| Events in quadrant B | 3,316,429 | 488,291 |
| Events in quadrant C | 3,560,162 | 449,032 |
| Events in quadrant D | 12,338,622 | 235,149 |
| Mode M0 | |||
|---|---|---|---|
| Quadrant | BADHDUFLAG | Total packets | Discarded packets |
| A | 0 | 13040 | 1 |
| B | 0 | 13336 | 1 |
| C | 0 | 14374 | 1 |
| D | 0 | 40751 | 2 |
| Mode M9 | |||
|---|---|---|---|
| Quadrant | BADHDUFLAG | Total packets | Discarded packets |
| A | 0 | 14 | 0 |
| B | 0 | 14 | 0 |
| C | 0 | 14 | 0 |
| D | 0 | 14 | 0 |
| Mode SS | |||
|---|---|---|---|
| Quadrant | BADHDUFLAG | Total packets | Discarded packets |
| A | 0 | 120 | 0 |
| B | 0 | 120 | 0 |
| C | 0 | 120 | 0 |
| D | 0 | 120 | 0 |
| Quadrant | Total seconds | Saturated seconds | Saturation percentage |
|---|---|---|---|
| A | 5988 | 36 | 0.601202% |
| B | 5989 | 46 | 0.768075% |
| C | 5989 | 184 | 3.072299% |
| D | 5988 | 3517 | 58.734135% |
Noise dominated data is calculated using 1-second bins in cleaned event files. If a bin has >2000 counts, and if more than 50% of those come from <1% of pixels, then it is considered to be noise-dominated and hence unusable.
| Quadrant | # 1 sec bins | Bins with >0 counts | Bins with >2000 counts | High rate bins dominated by noise | Noise dominated (total time) | Noise dominated (detector-on time) | Marked lightcurve |
|---|---|---|---|---|---|---|---|
| A | 7358 | 5989 | 0 | 0 | 0.00% | 0.00% |  |
| B | 7359 | 5990 | 0 | 0 | 0.00% | 0.00% |  |
| C | 7359 | 5990 | 2 | 2 | 0.03% | 0.03% |  |
| D | 7358 | 5989 | 3261 | 3261 | 44.32% | 54.45% |  |
Top three noisy pixels from each quadrant. If the there are fewer than three noisy pixels in the level2.evt file, extra rows are filled as -1
| Pixel properties | Quadrant properties | ||||||
|---|---|---|---|---|---|---|---|
| Quadrant | DetID | PixID | Counts | Sigma | Mean | Median | Sigma |
| A | 13 | 254 | 11196 | 62.77 | 836 | 823 | 165.2 |
| A | 3 | 137 | 7241 | 38.84 | 836 | 823 | 165.2 |
| A | 0 | 226 | 7224 | 38.74 | 836 | 823 | 165.2 |
| B | 12 | 111 | 18125 | 111.01 | 837 | 819 | 155.9 |
| B | 11 | 111 | 16537 | 100.82 | 837 | 819 | 155.9 |
| B | 14 | 111 | 15366 | 93.31 | 837 | 819 | 155.9 |
| C | 3 | 233 | 271285 | 1491.13 | 786 | 793 | 181.4 |
| C | 14 | 238 | 163296 | 895.82 | 786 | 793 | 181.4 |
| C | 14 | 254 | 47643 | 258.27 | 786 | 793 | 181.4 |
| D | 8 | 195 | 4954555 | 38684.78 | 535 | 522 | 128.1 |
| D | 1 | 52 | 4696307 | 36668.19 | 535 | 522 | 128.1 |
| D | 7 | 80 | 355815 | 2774.39 | 535 | 522 | 128.1 |
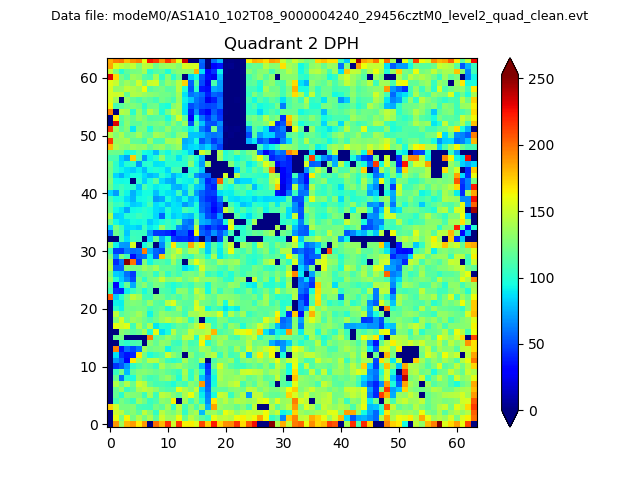
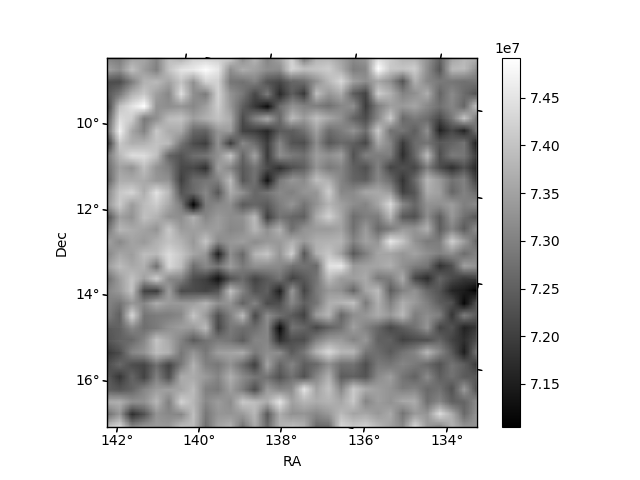
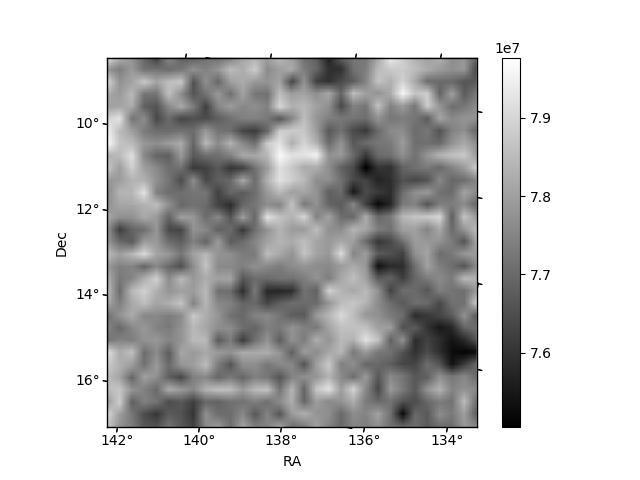
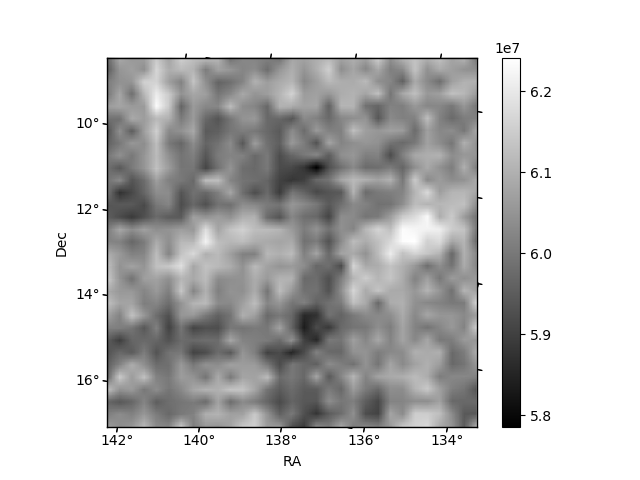
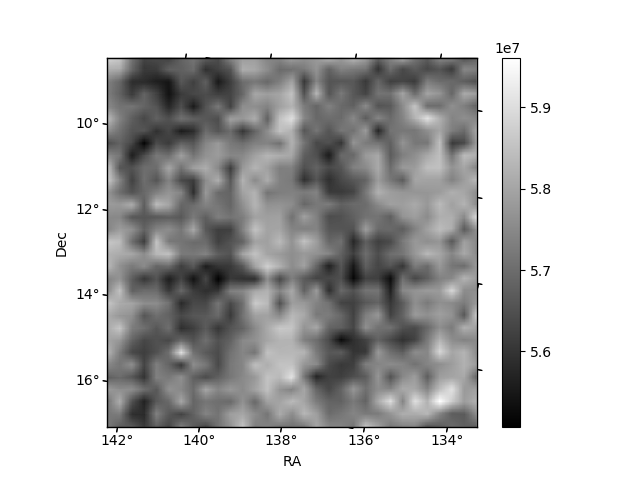
Histogram calculated using DETX and DETY for each event in the final _common_clean file
| Quadrant A | 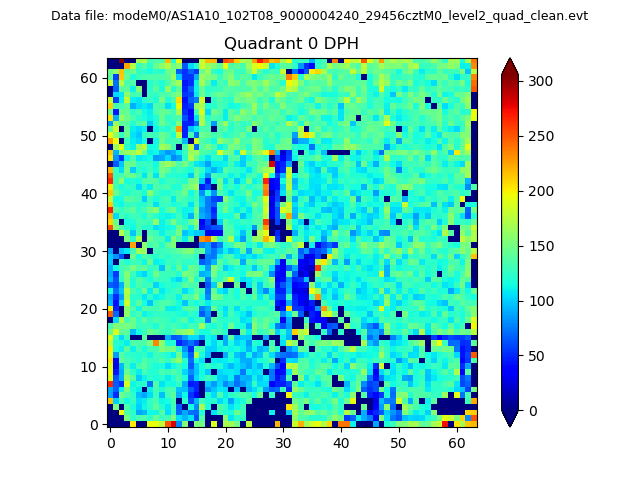 |
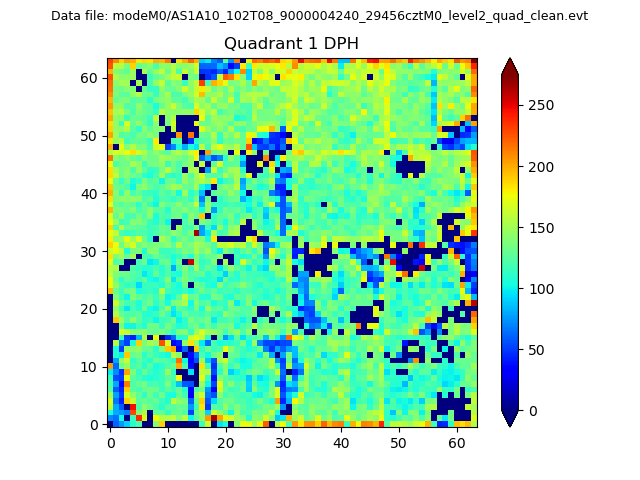 |
Quadrant B |
|---|---|---|---|
| Quadrant D | 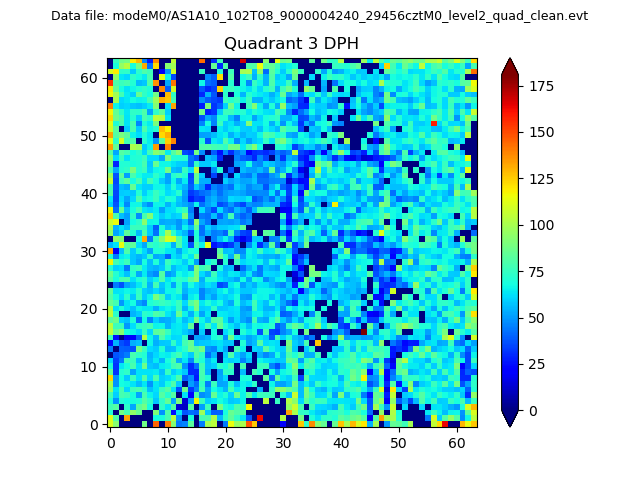 |
 |
Quadrant C |
| Plot type | Count rate plots | Images |
|---|---|---|
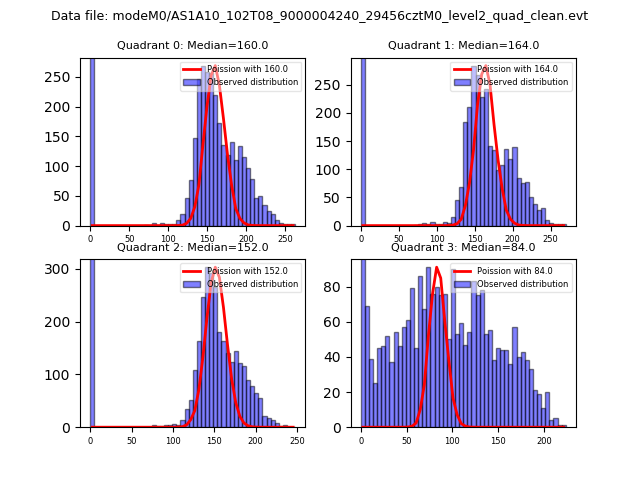
| Comparison with Poisson distribution Blue bars denote a histogram of data divided into 1 sec bins. Red curve is a Poisson curve with rate = median count rate of data. |
 |
 |
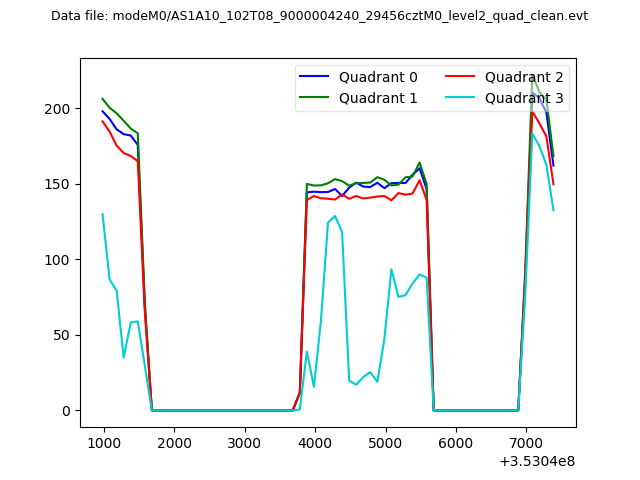
| Quadrant-wise count rates Data is divided into 100 sec bins |
 |
|
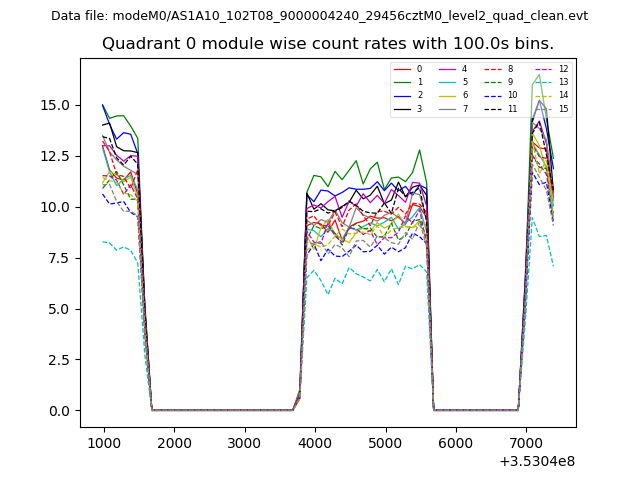
| Module-wise count rates for Quadrant A Data is divided into 100 sec bins |
 |
 |
| Module-wise count rates for Quadrant B Data is divided into 100 sec bins |
 |
 |
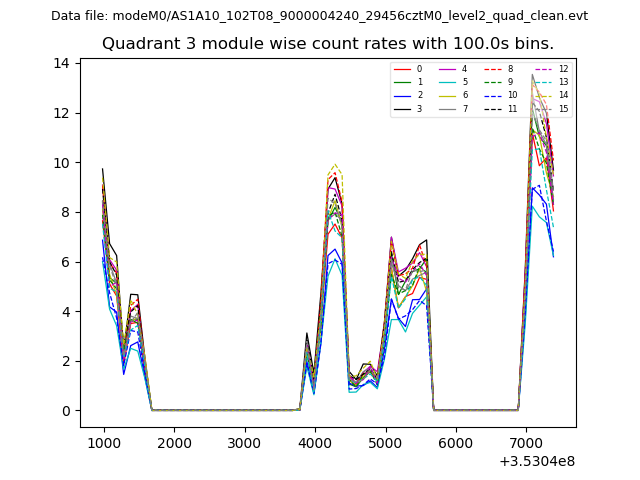
| Module-wise count rates for Quadrant C Data is divided into 100 sec bins |
 |
 |
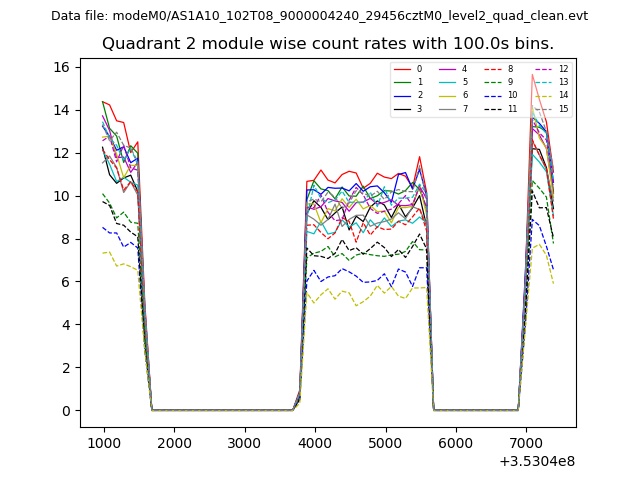
| Module-wise count rates for Quadrant D Data is divided into 100 sec bins |
 |
 |
| Parameter | Plot |
|---|---|
| CZT HV Monitor |  |
| D_VDD | 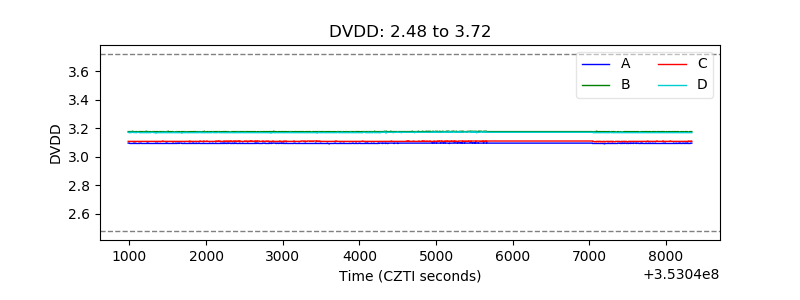 |
| Temperature 1 | 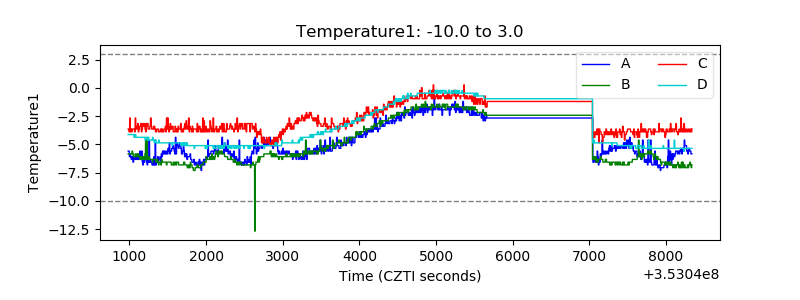 |
| Veto HV Monitor | 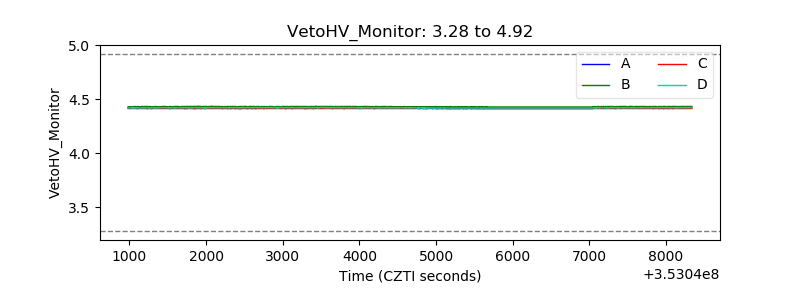 |
| Veto LLD | 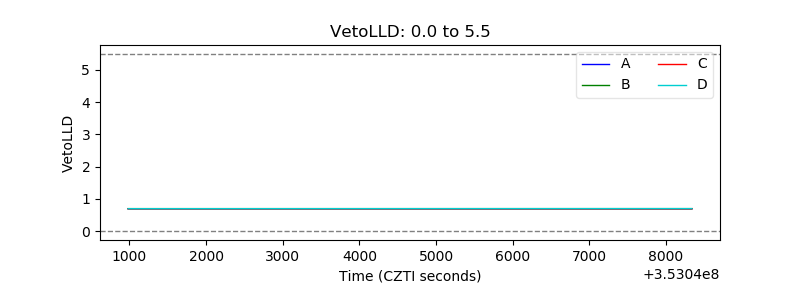 |
| Alpha Counter | 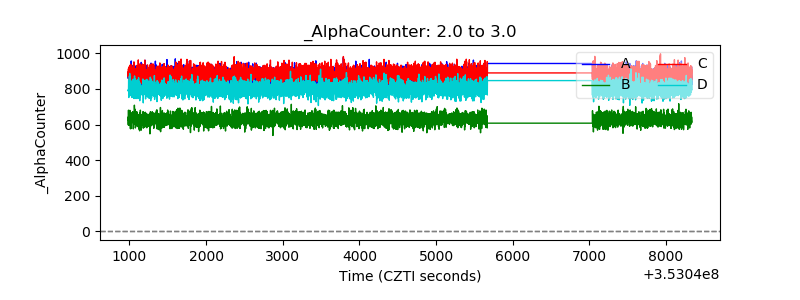 |
| _CPM_Rate | 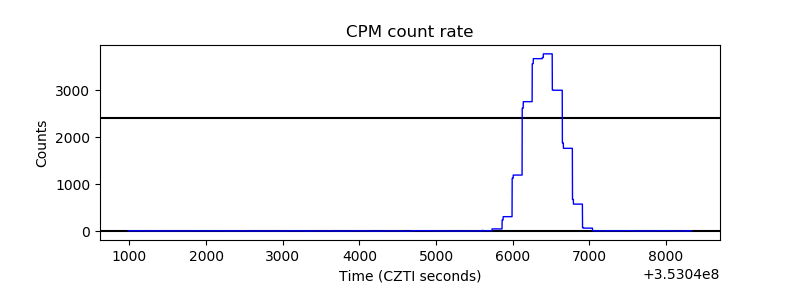 |
| CZT Counter | 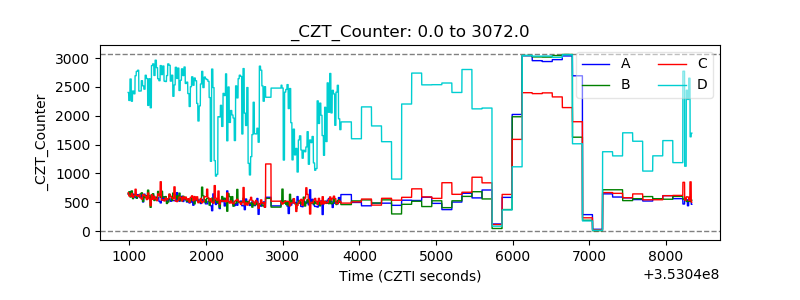 |
| +2.5 Volts monitor |  |
| +5 Volts monitor |  |
| _ROLL_ROT | 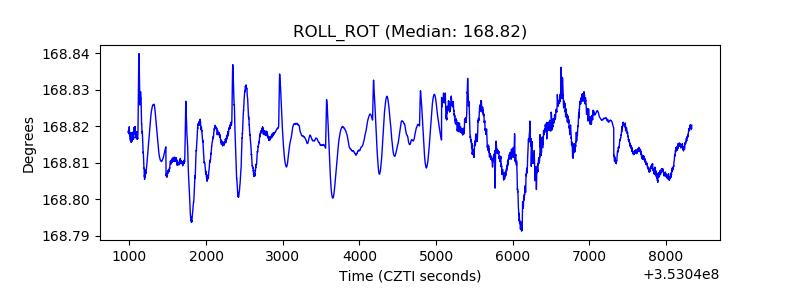 |
| _Roll_DEC | 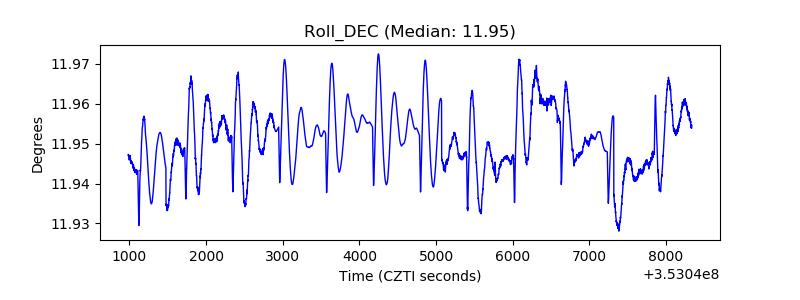 |
| _Roll_RA | 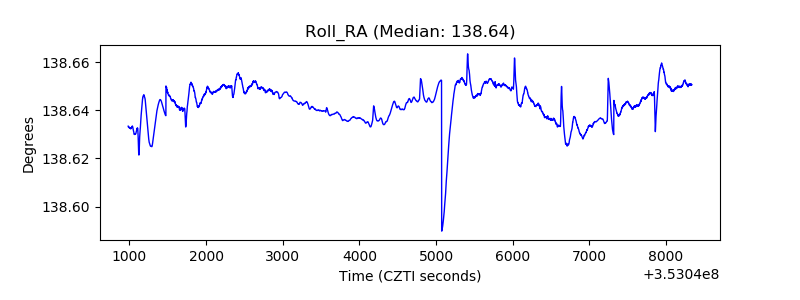 |
| Veto Counter |  |