| Param | Original file | Final file |
|---|---|---|
| Filename | modeM0/AS1A10_102T08_9000004240_29458cztM0_level2.evt | modeM0/AS1A10_102T08_9000004240_29458cztM0_level2_quad_clean.evt |
| Size (bytes) | 1,423,068,480 | 109,751,040 |
| Size | 1.3 GB | 104.7 MB |
| Events in quadrant A | 6,011,883 | 741,495 |
| Events in quadrant B | 6,082,299 | 751,973 |
| Events in quadrant C | 6,386,333 | 697,295 |
| Events in quadrant D | 23,881,585 | 374,471 |
| Mode M0 | |||
|---|---|---|---|
| Quadrant | BADHDUFLAG | Total packets | Discarded packets |
| A | 0 | 23885 | 2 |
| B | 0 | 24144 | 2 |
| C | 0 | 25542 | 2 |
| D | 0 | 78451 | 3 |
| Mode M9 | |||
|---|---|---|---|
| Quadrant | BADHDUFLAG | Total packets | Discarded packets |
| A | 0 | 25 | 0 |
| B | 0 | 25 | 0 |
| C | 0 | 25 | 0 |
| D | 0 | 25 | 0 |
| Mode SS | |||
|---|---|---|---|
| Quadrant | BADHDUFLAG | Total packets | Discarded packets |
| A | 0 | 224 | 0 |
| B | 0 | 224 | 0 |
| C | 0 | 224 | 0 |
| D | 0 | 224 | 0 |
| Quadrant | Total seconds | Saturated seconds | Saturation percentage |
|---|---|---|---|
| A | 10921 | 121 | 1.107957% |
| B | 10922 | 228 | 2.087530% |
| C | 10922 | 780 | 7.141549% |
| D | 10921 | 7461 | 68.317920% |
Noise dominated data is calculated using 1-second bins in cleaned event files. If a bin has >2000 counts, and if more than 50% of those come from <1% of pixels, then it is considered to be noise-dominated and hence unusable.
| Quadrant | # 1 sec bins | Bins with >0 counts | Bins with >2000 counts | High rate bins dominated by noise | Noise dominated (total time) | Noise dominated (detector-on time) | Marked lightcurve |
|---|---|---|---|---|---|---|---|
| A | 13476 | 10923 | 1 | 1 | 0.01% | 0.01% |  |
| B | 13477 | 10924 | 24 | 24 | 0.18% | 0.22% |  |
| C | 13477 | 10924 | 5 | 5 | 0.04% | 0.05% |  |
| D | 13476 | 10922 | 6651 | 6651 | 49.35% | 60.90% |  |
Top three noisy pixels from each quadrant. If the there are fewer than three noisy pixels in the level2.evt file, extra rows are filled as -1
| Pixel properties | Quadrant properties | ||||||
|---|---|---|---|---|---|---|---|
| Quadrant | DetID | PixID | Counts | Sigma | Mean | Median | Sigma |
| A | 0 | 13 | 174092 | 577.94 | 1509 | 1487 | 298.7 |
| A | 13 | 254 | 19744 | 61.13 | 1509 | 1487 | 298.7 |
| A | 1 | 113 | 17953 | 55.13 | 1509 | 1487 | 298.7 |
| B | 5 | 255 | 104904 | 370.16 | 1497 | 1463 | 279.4 |
| B | 0 | 156 | 53301 | 185.5 | 1497 | 1463 | 279.4 |
| B | 12 | 111 | 33746 | 115.52 | 1497 | 1463 | 279.4 |
| C | 14 | 238 | 405792 | 1266.83 | 1385 | 1398 | 319.2 |
| C | 3 | 233 | 300384 | 936.62 | 1385 | 1398 | 319.2 |
| C | 14 | 254 | 254688 | 793.47 | 1385 | 1398 | 319.2 |
| D | 1 | 52 | 8180280 | 39497.43 | 881 | 861 | 207.1 |
| D | 8 | 195 | 7292761 | 35211.71 | 881 | 861 | 207.1 |
| D | 7 | 80 | 4650366 | 22451.9 | 881 | 861 | 207.1 |
Histogram calculated using DETX and DETY for each event in the final _common_clean file
| Quadrant A |  |
 |
Quadrant B |
|---|---|---|---|
| Quadrant D |  |
 |
Quadrant C |
| Plot type | Count rate plots | Images |
|---|---|---|
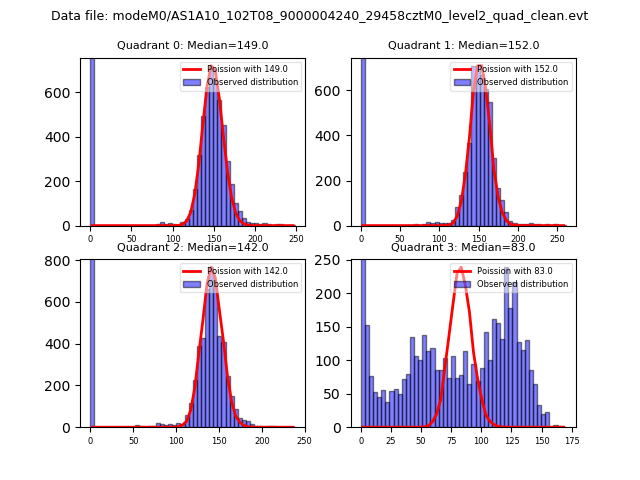
| Comparison with Poisson distribution Blue bars denote a histogram of data divided into 1 sec bins. Red curve is a Poisson curve with rate = median count rate of data. |
 |
 |
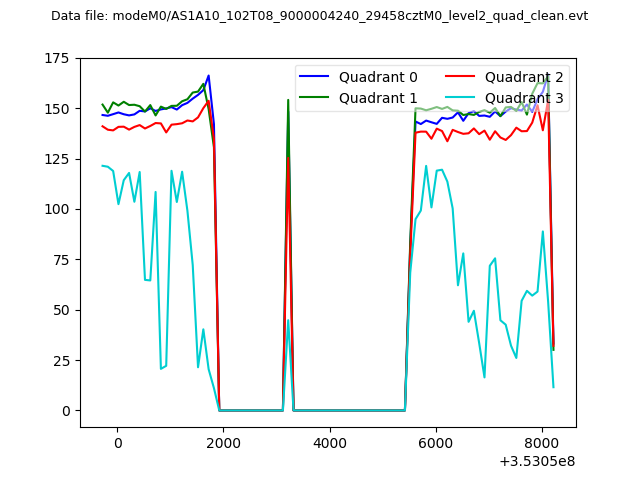
| Quadrant-wise count rates Data is divided into 100 sec bins |
 |
|
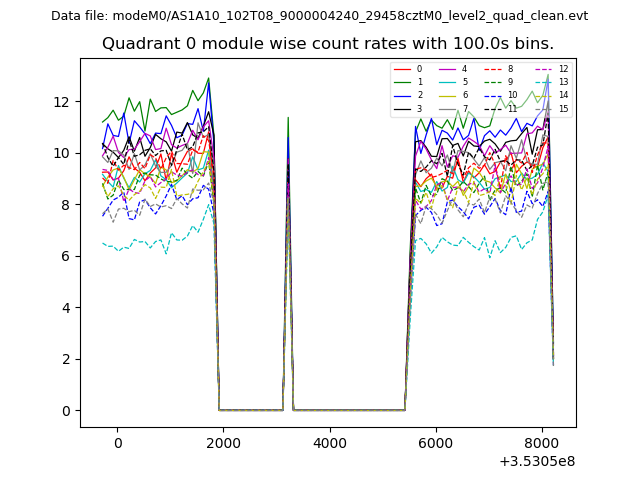
| Module-wise count rates for Quadrant A Data is divided into 100 sec bins |
 |
 |
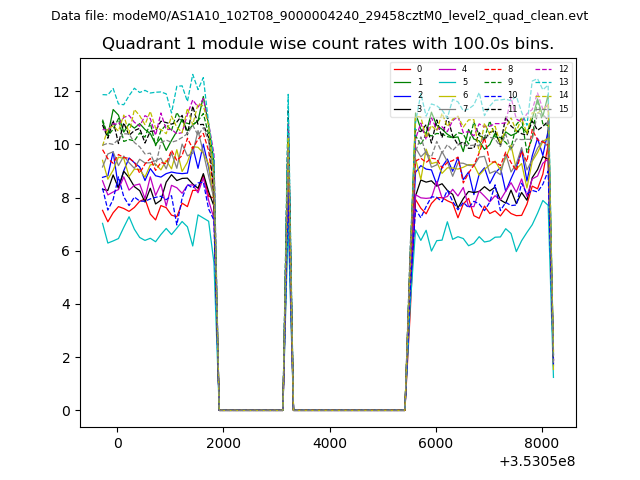
| Module-wise count rates for Quadrant B Data is divided into 100 sec bins |
 |
 |
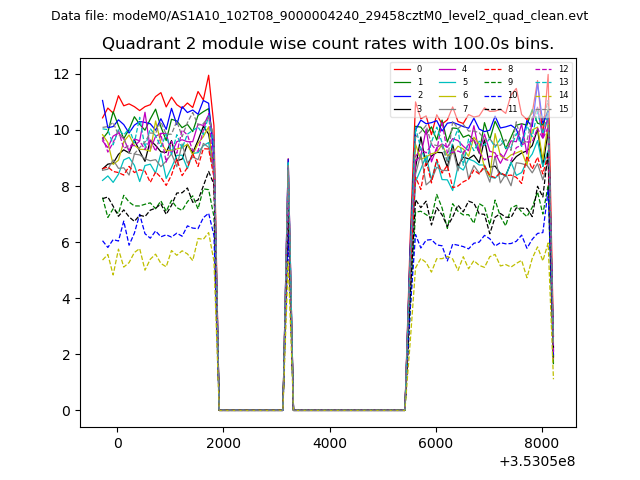
| Module-wise count rates for Quadrant C Data is divided into 100 sec bins |
 |
 |
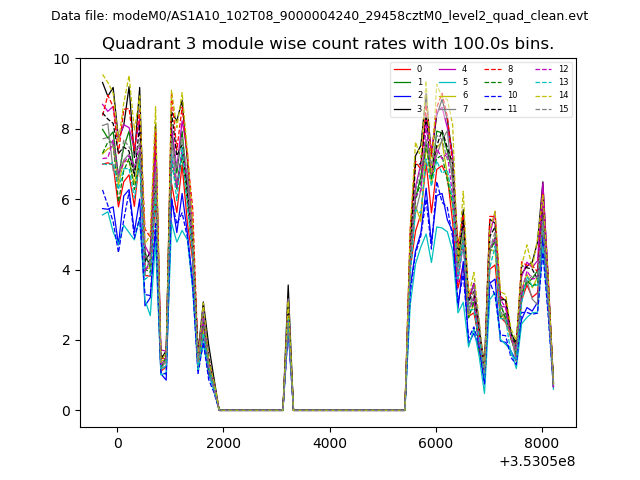
| Module-wise count rates for Quadrant D Data is divided into 100 sec bins |
 |
 |
| Parameter | Plot |
|---|---|
| CZT HV Monitor | 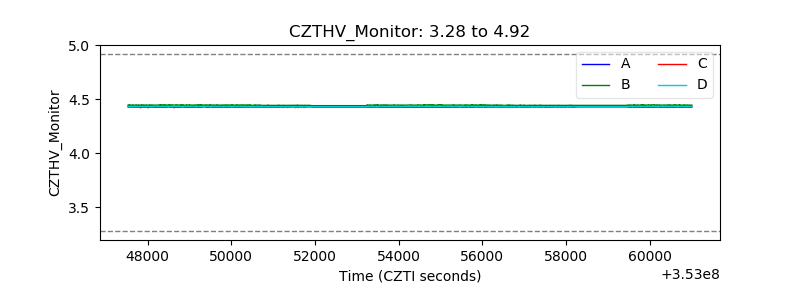 |
| D_VDD |  |
| Temperature 1 |  |
| Veto HV Monitor |  |
| Veto LLD |  |
| Alpha Counter | 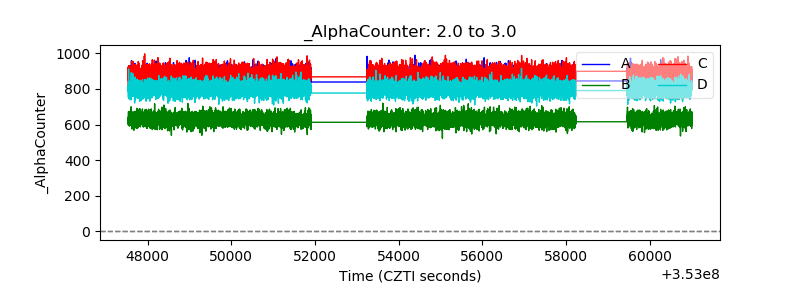 |
| _CPM_Rate | 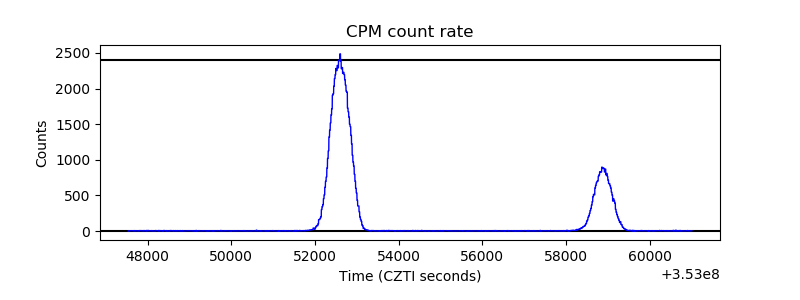 |
| CZT Counter |  |
| +2.5 Volts monitor |  |
| +5 Volts monitor |  |
| _ROLL_ROT | 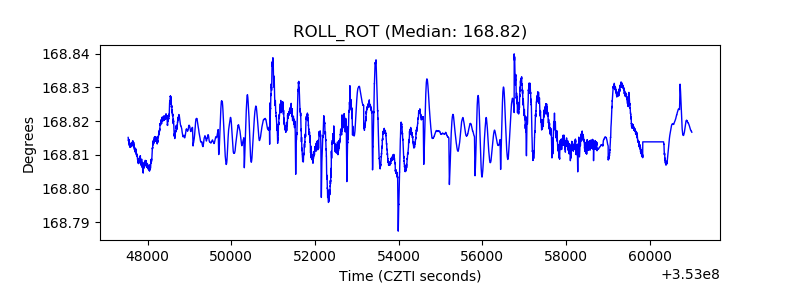 |
| _Roll_DEC | 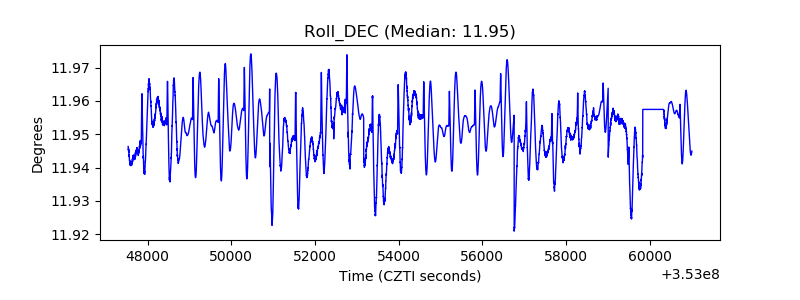 |
| _Roll_RA |  |
| Veto Counter | 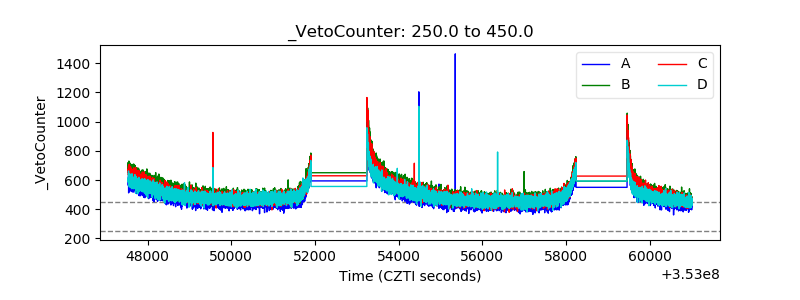 |