| Param | Original file | Final file |
|---|---|---|
| Filename | modeM0/AS1A10_102T08_9000004240_29459cztM0_level2.evt | modeM0/AS1A10_102T08_9000004240_29459cztM0_level2_quad_clean.evt |
| Size (bytes) | 714,882,240 | 69,661,440 |
| Size | 681.8 MB | 66.4 MB |
| Events in quadrant A | 3,417,887 | 476,581 |
| Events in quadrant B | 3,162,574 | 487,809 |
| Events in quadrant C | 3,819,017 | 383,813 |
| Events in quadrant D | 10,843,714 | 339,703 |
| Mode M0 | |||
|---|---|---|---|
| Quadrant | BADHDUFLAG | Total packets | Discarded packets |
| A | 0 | 14739 | 1063 |
| B | 0 | 13843 | 1023 |
| C | 0 | 16324 | 1377 |
| D | 0 | 41828 | 5573 |
| Mode M9 | |||
|---|---|---|---|
| Quadrant | BADHDUFLAG | Total packets | Discarded packets |
| A | 0 | 9 | 0 |
| B | 0 | 9 | 0 |
| C | 0 | 9 | 0 |
| D | 0 | 9 | 0 |
| Mode SS | |||
|---|---|---|---|
| Quadrant | BADHDUFLAG | Total packets | Discarded packets |
| A | 0 | 131 | 9 |
| B | 0 | 132 | 14 |
| C | 0 | 132 | 8 |
| D | 0 | 132 | 8 |
| Quadrant | Total seconds | Saturated seconds | Saturation percentage |
|---|---|---|---|
| A | 6098 | 145 | 2.377829% |
| B | 6074 | 151 | 2.486006% |
| C | 6037 | 1342 | 22.229584% |
| D | 5851 | 2468 | 42.180824% |
Noise dominated data is calculated using 1-second bins in cleaned event files. If a bin has >2000 counts, and if more than 50% of those come from <1% of pixels, then it is considered to be noise-dominated and hence unusable.
| Quadrant | # 1 sec bins | Bins with >0 counts | Bins with >2000 counts | High rate bins dominated by noise | Noise dominated (total time) | Noise dominated (detector-on time) | Marked lightcurve |
|---|---|---|---|---|---|---|---|
| A | 7319 | 6226 | 12 | 12 | 0.16% | 0.19% | 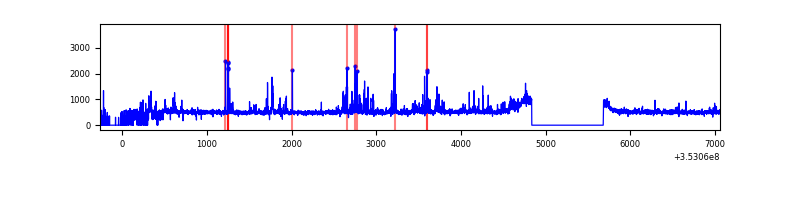 |
| B | 7314 | 6219 | 1 | 1 | 0.01% | 0.02% | 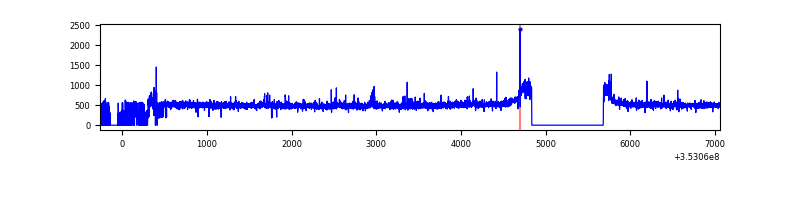 |
| C | 7316 | 6158 | 1 | 1 | 0.01% | 0.02% | 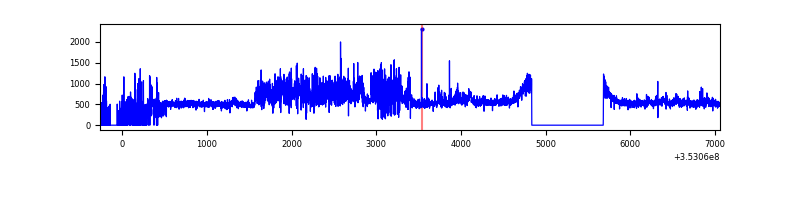 |
| D | 7279 | 5894 | 2275 | 2275 | 31.25% | 38.60% | 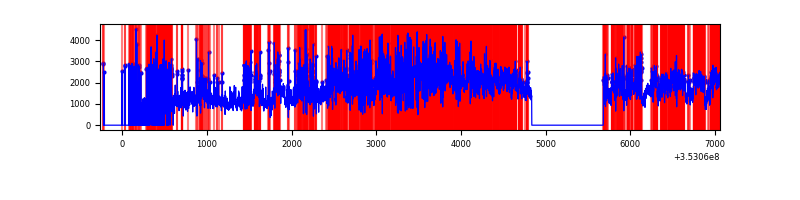 |
Top three noisy pixels from each quadrant. If the there are fewer than three noisy pixels in the level2.evt file, extra rows are filled as -1
| Pixel properties | Quadrant properties | ||||||
|---|---|---|---|---|---|---|---|
| Quadrant | DetID | PixID | Counts | Sigma | Mean | Median | Sigma |
| A | 0 | 13 | 299784 | 1865.44 | 799 | 783 | 160.3 |
| A | 1 | 113 | 18169 | 108.47 | 799 | 783 | 160.3 |
| A | 5 | 98 | 17468 | 104.1 | 799 | 783 | 160.3 |
| B | 0 | 230 | 19009 | 119.68 | 790 | 771 | 152.4 |
| B | 12 | 111 | 18424 | 115.84 | 790 | 771 | 152.4 |
| B | 11 | 111 | 16879 | 105.7 | 790 | 771 | 152.4 |
| C | 14 | 254 | 460502 | 2849.95 | 688 | 694 | 161.3 |
| C | 14 | 238 | 440541 | 2726.23 | 688 | 694 | 161.3 |
| C | 3 | 233 | 210984 | 1303.41 | 688 | 694 | 161.3 |
| D | 8 | 195 | 5001305 | 33992.5 | 620 | 606 | 147.1 |
| D | 1 | 52 | 1807874 | 12284.99 | 620 | 606 | 147.1 |
| D | 7 | 80 | 1350743 | 9177.62 | 620 | 606 | 147.1 |
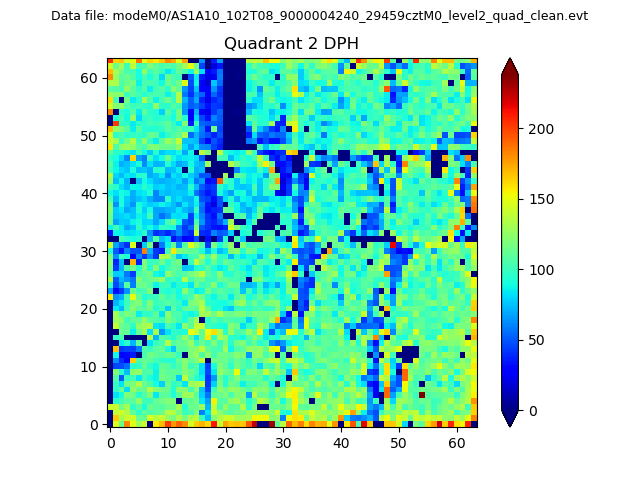
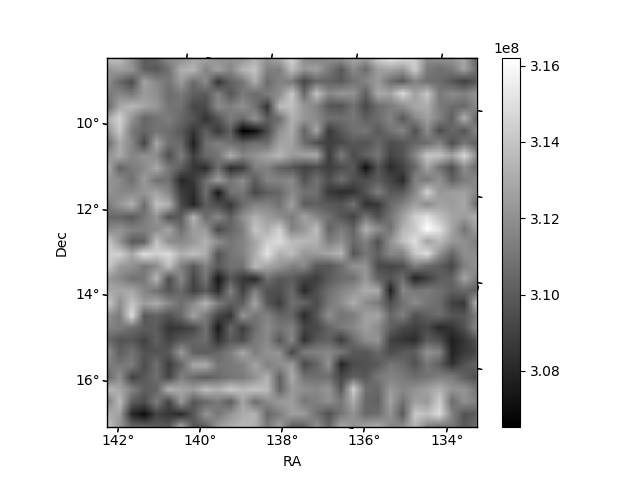
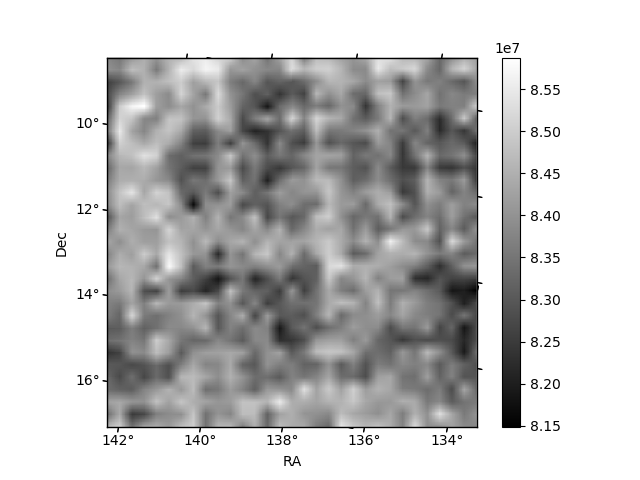
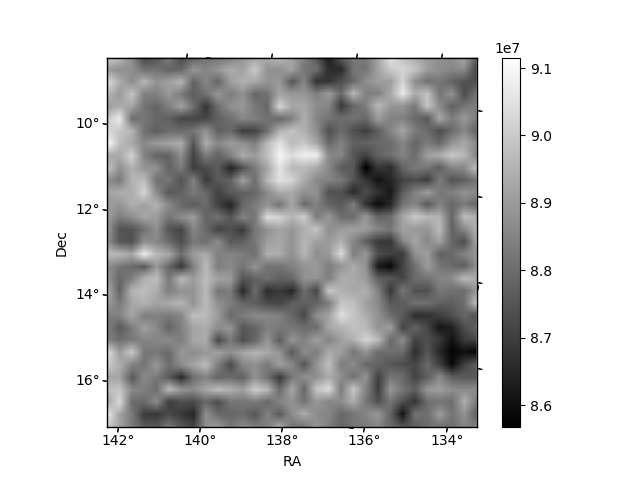
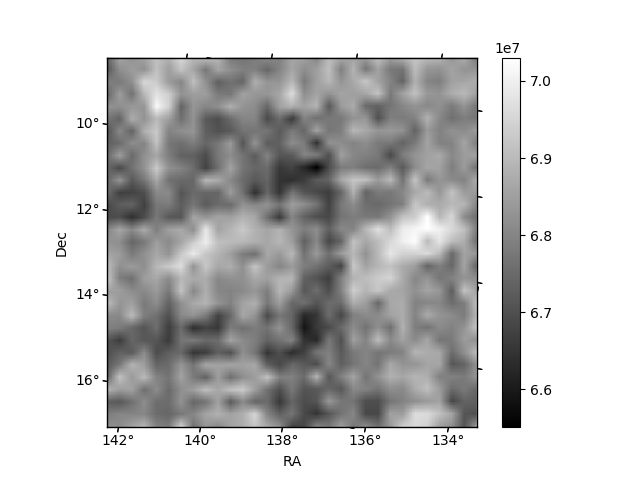
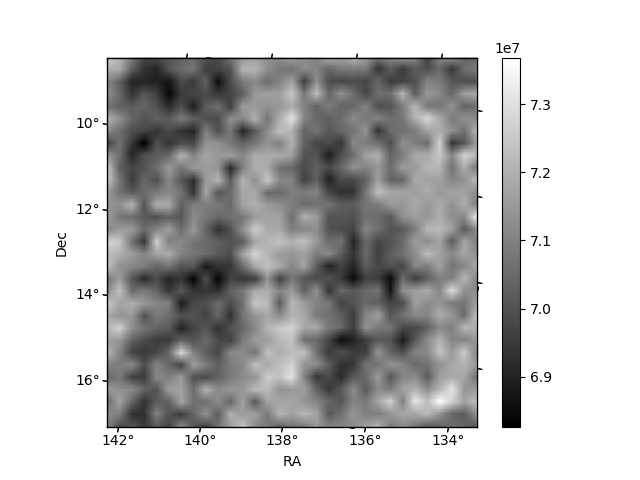
Histogram calculated using DETX and DETY for each event in the final _common_clean file
| Quadrant A | 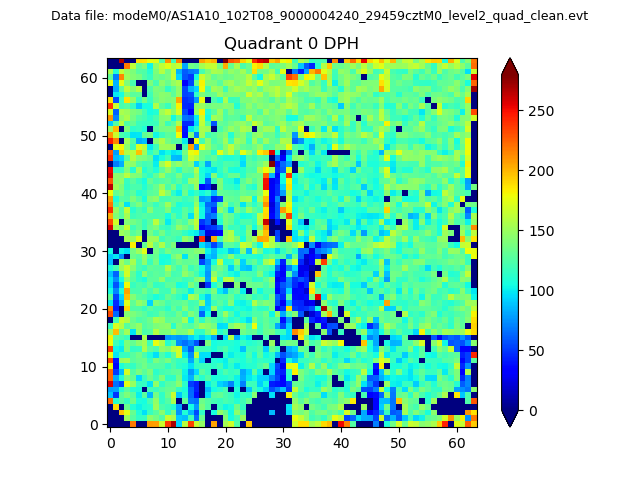 |
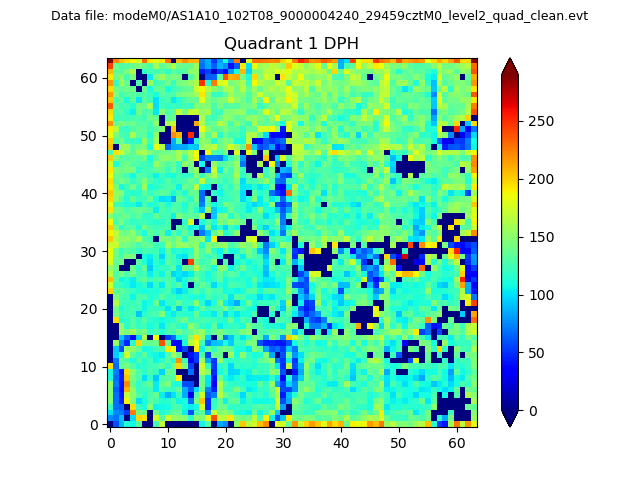 |
Quadrant B |
|---|---|---|---|
| Quadrant D | 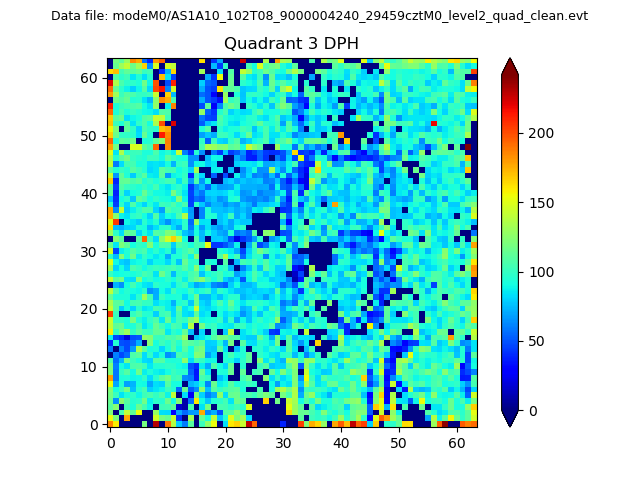 |
 |
Quadrant C |
| Plot type | Count rate plots | Images |
|---|---|---|
| Comparison with Poisson distribution Blue bars denote a histogram of data divided into 1 sec bins. Red curve is a Poisson curve with rate = median count rate of data. |
 |
 |
| Quadrant-wise count rates Data is divided into 100 sec bins |
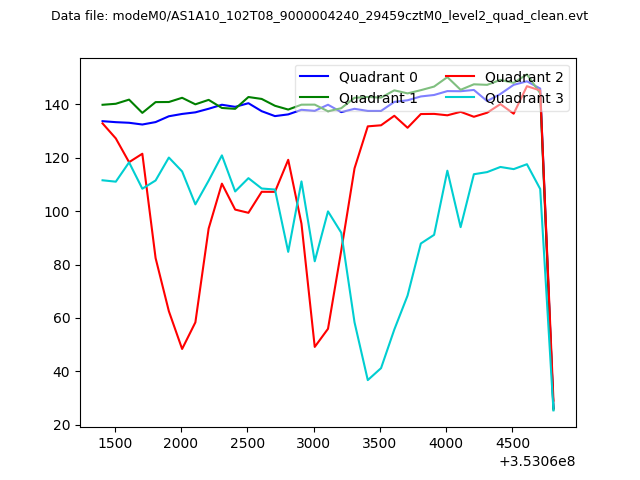 |
|
| Module-wise count rates for Quadrant A Data is divided into 100 sec bins |
 |
 |
| Module-wise count rates for Quadrant B Data is divided into 100 sec bins |
 |
 |
| Module-wise count rates for Quadrant C Data is divided into 100 sec bins |
 |
 |
| Module-wise count rates for Quadrant D Data is divided into 100 sec bins |
 |
 |
| Parameter | Plot |
|---|---|
| CZT HV Monitor |  |
| D_VDD | 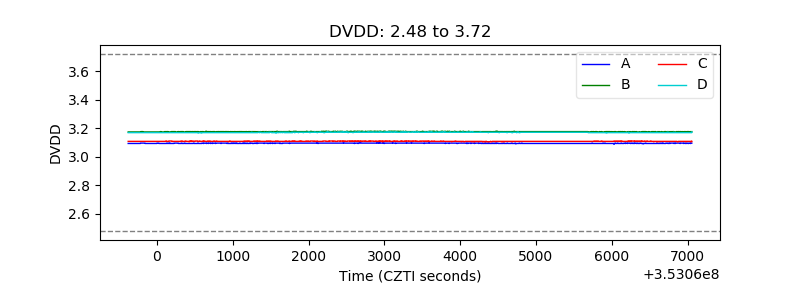 |
| Temperature 1 | 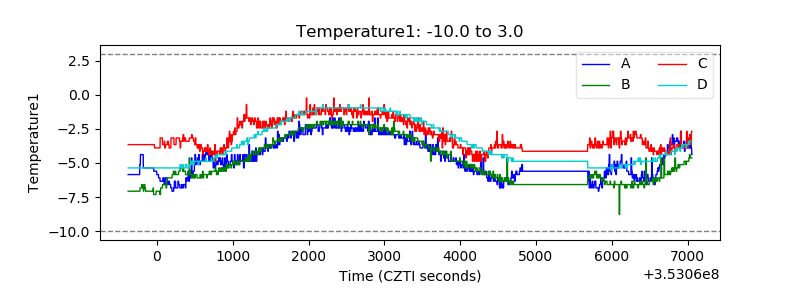 |
| Veto HV Monitor | 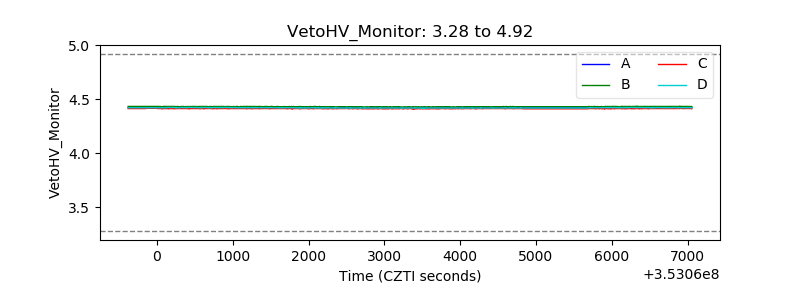 |
| Veto LLD | 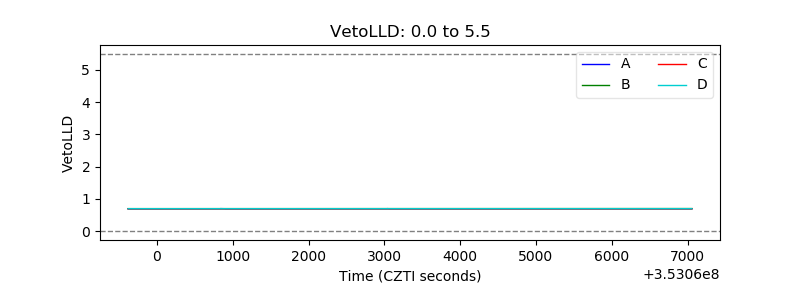 |
| Alpha Counter | 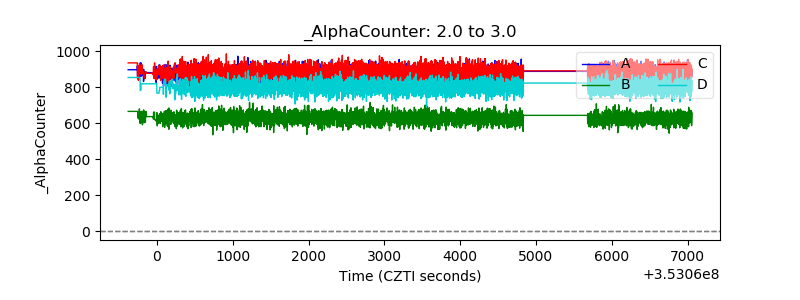 |
| _CPM_Rate | 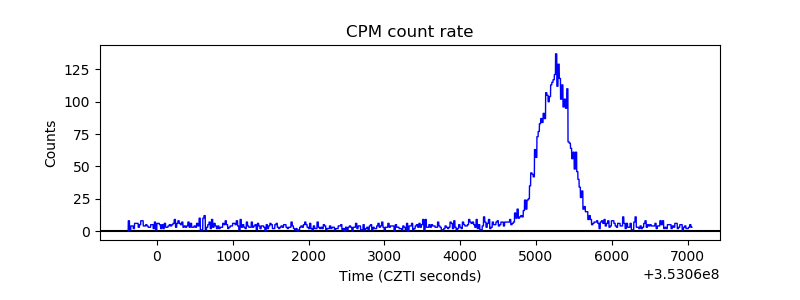 |
| CZT Counter | 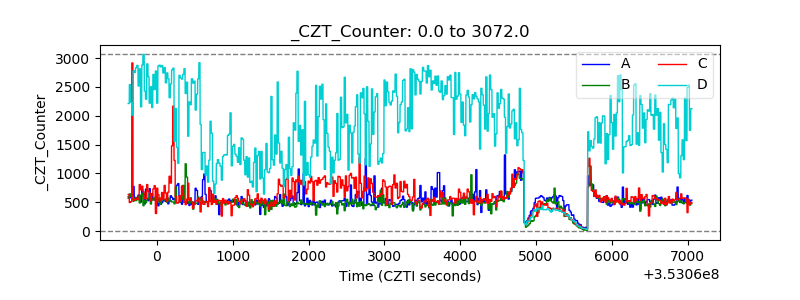 |
| +2.5 Volts monitor |  |
| +5 Volts monitor | 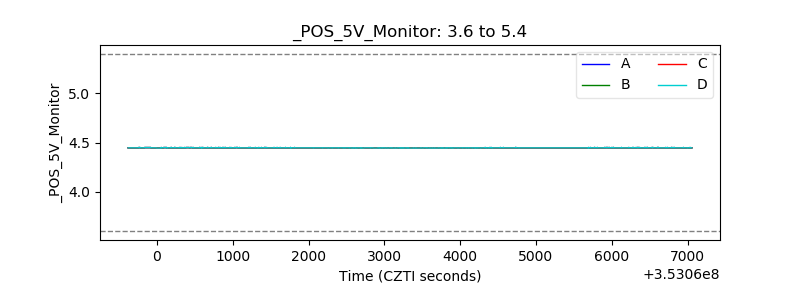 |
| _ROLL_ROT |  |
| _Roll_DEC | 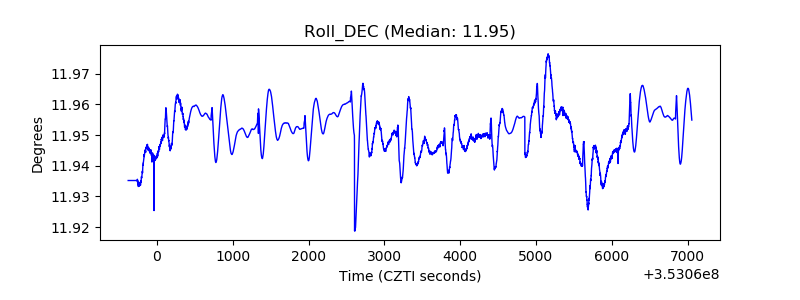 |
| _Roll_RA | 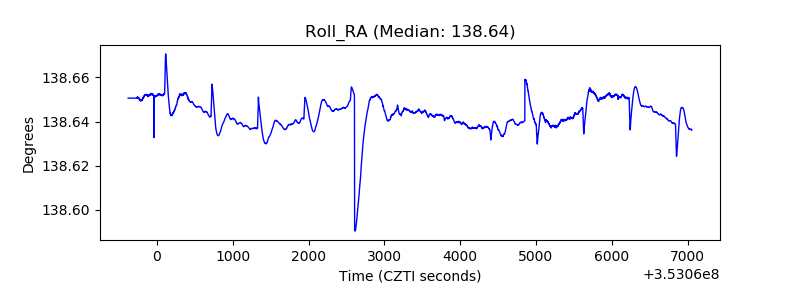 |
| Veto Counter |  |