| Param | Original file | Final file |
|---|---|---|
| Filename | modeM0/AS1A10_102T08_9000004240_29461cztM0_level2.evt | modeM0/AS1A10_102T08_9000004240_29461cztM0_level2_quad_clean.evt |
| Size (bytes) | 572,031,360 | 55,667,520 |
| Size | 545.5 MB | 53.1 MB |
| Events in quadrant A | 2,624,315 | 361,585 |
| Events in quadrant B | 2,700,632 | 364,290 |
| Events in quadrant C | 2,886,239 | 329,715 |
| Events in quadrant D | 8,762,119 | 266,813 |
| Mode M0 | |||
|---|---|---|---|
| Quadrant | BADHDUFLAG | Total packets | Discarded packets |
| A | 0 | 13369 | 2329 |
| B | 0 | 13593 | 2359 |
| C | 0 | 14074 | 2369 |
| D | 0 | 38416 | 8898 |
| Mode M9 | |||
|---|---|---|---|
| Quadrant | BADHDUFLAG | Total packets | Discarded packets |
| A | 1 | 140077426789160 | 46 |
| B | 1 | -1 | -1 |
| C | 1 | -1 | -1 |
| D | 1 | -1 | -1 |
| Mode SS | |||
|---|---|---|---|
| Quadrant | BADHDUFLAG | Total packets | Discarded packets |
| A | 0 | 130 | 26 |
| B | 0 | 125 | 17 |
| C | 0 | 130 | 26 |
| D | 0 | 127 | 23 |
| Quadrant | Total seconds | Saturated seconds | Saturation percentage |
|---|---|---|---|
| A | 5229 | 228 | 4.360298% |
| B | 5216 | 246 | 4.716258% |
| C | 5224 | 612 | 11.715161% |
| D | 4983 | 1861 | 37.346980% |
Noise dominated data is calculated using 1-second bins in cleaned event files. If a bin has >2000 counts, and if more than 50% of those come from <1% of pixels, then it is considered to be noise-dominated and hence unusable.
| Quadrant | # 1 sec bins | Bins with >0 counts | Bins with >2000 counts | High rate bins dominated by noise | Noise dominated (total time) | Noise dominated (detector-on time) | Marked lightcurve |
|---|---|---|---|---|---|---|---|
| A | 7684 | 5357 | 1 | 1 | 0.01% | 0.02% |  |
| B | 7688 | 5341 | 1 | 1 | 0.01% | 0.02% |  |
| C | 7676 | 5331 | 0 | 0 | 0.00% | 0.00% | 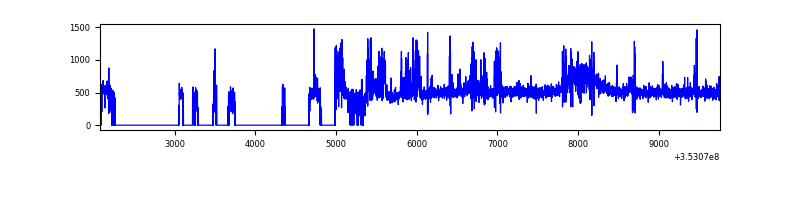 |
| D | 7670 | 5113 | 1819 | 1819 | 23.72% | 35.58% | 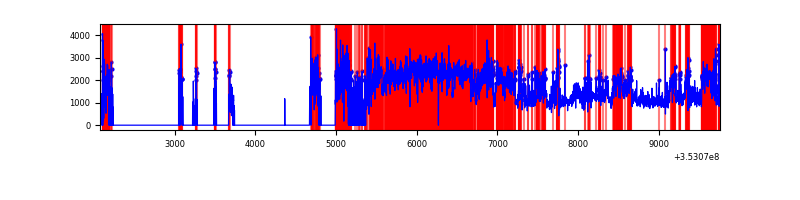 |
Top three noisy pixels from each quadrant. If the there are fewer than three noisy pixels in the level2.evt file, extra rows are filled as -1
| Pixel properties | Quadrant properties | ||||||
|---|---|---|---|---|---|---|---|
| Quadrant | DetID | PixID | Counts | Sigma | Mean | Median | Sigma |
| A | 0 | 13 | 16484 | 113.78 | 672 | 655 | 139.1 |
| A | 13 | 254 | 9774 | 65.55 | 672 | 655 | 139.1 |
| A | 1 | 113 | 7497 | 49.18 | 672 | 655 | 139.1 |
| B | 0 | 230 | 24346 | 183.12 | 665 | 646 | 129.4 |
| B | 5 | 255 | 20422 | 152.8 | 665 | 646 | 129.4 |
| B | 0 | 190 | 17319 | 128.83 | 665 | 646 | 129.4 |
| C | 14 | 238 | 241061 | 1651.26 | 617 | 619 | 145.6 |
| C | 14 | 254 | 202375 | 1385.58 | 617 | 619 | 145.6 |
| C | 3 | 233 | 20602 | 137.24 | 617 | 619 | 145.6 |
| D | 8 | 195 | 5564555 | 40035.94 | 572 | 555 | 139.0 |
| D | 1 | 52 | 461251 | 3314.95 | 572 | 555 | 139.0 |
| D | 7 | 223 | 305939 | 2197.4 | 572 | 555 | 139.0 |
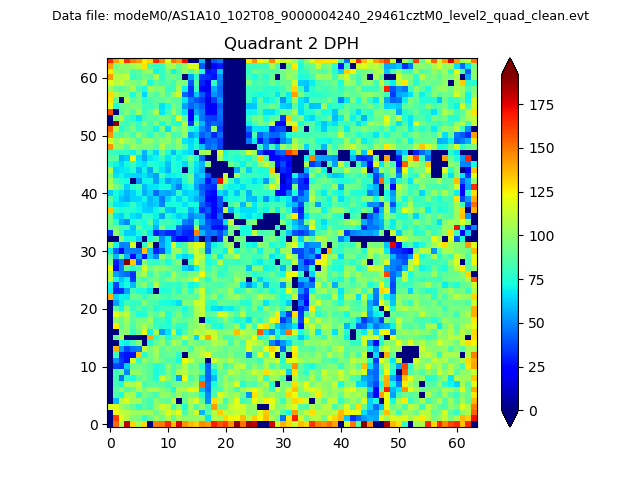
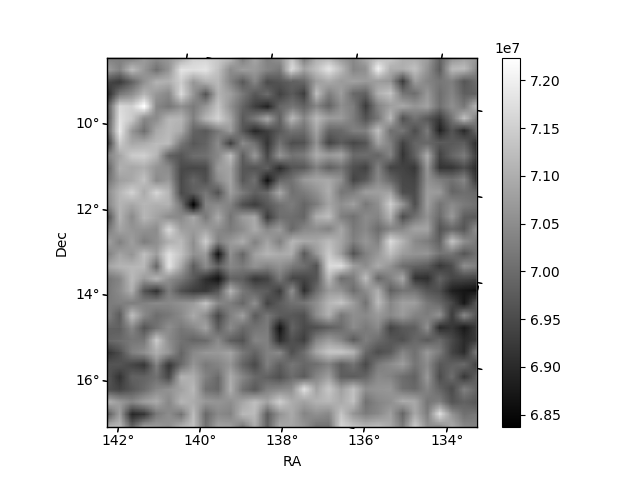
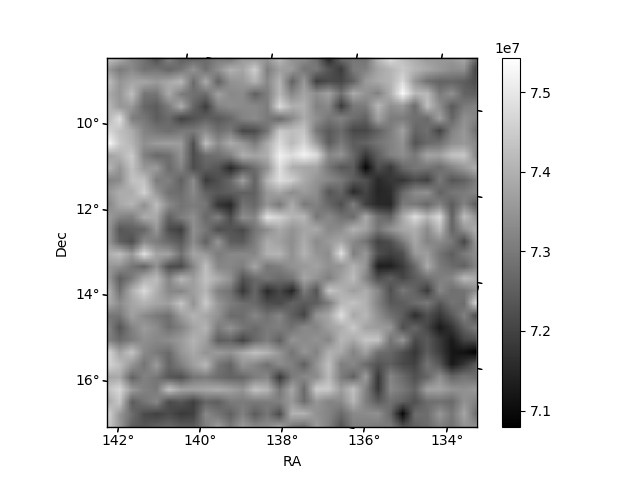
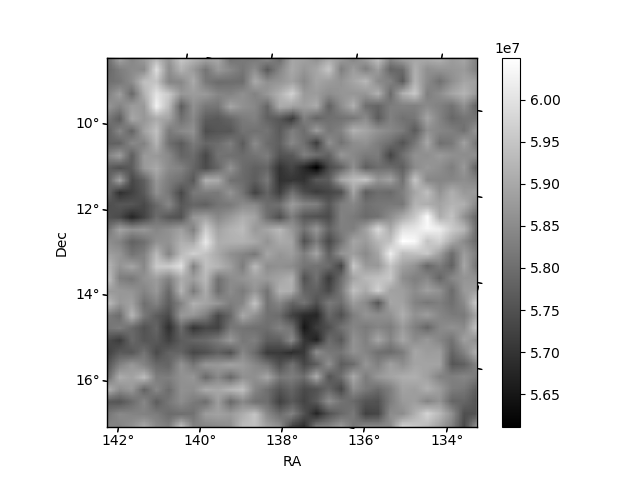
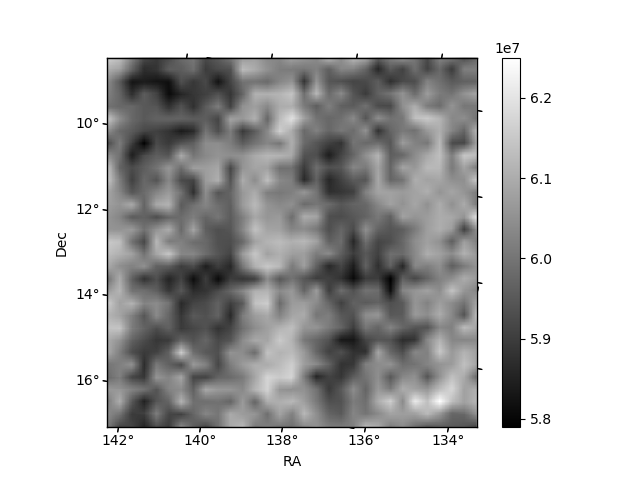
Histogram calculated using DETX and DETY for each event in the final _common_clean file
| Quadrant A | 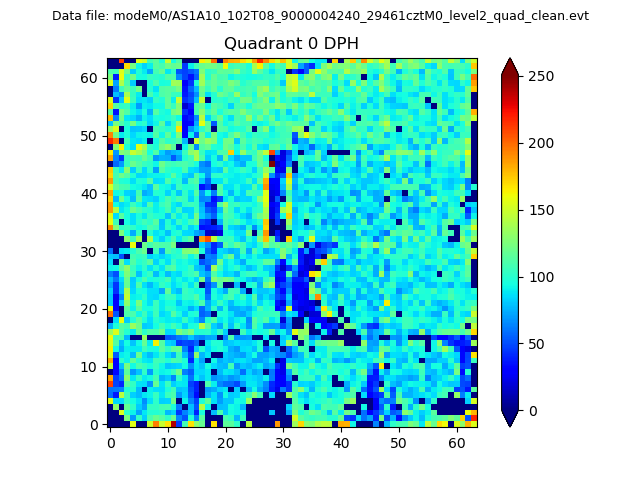 |
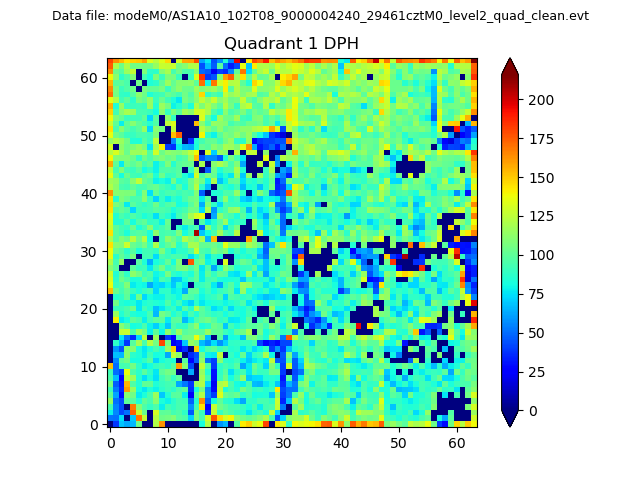 |
Quadrant B |
|---|---|---|---|
| Quadrant D | 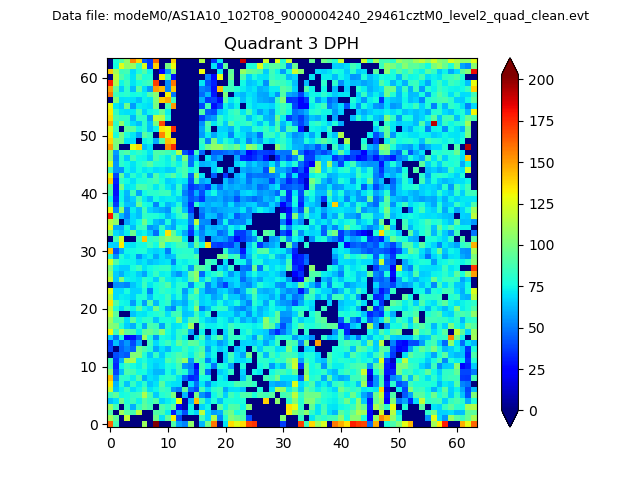 |
 |
Quadrant C |
| Plot type | Count rate plots | Images |
|---|---|---|
| Comparison with Poisson distribution Blue bars denote a histogram of data divided into 1 sec bins. Red curve is a Poisson curve with rate = median count rate of data. |
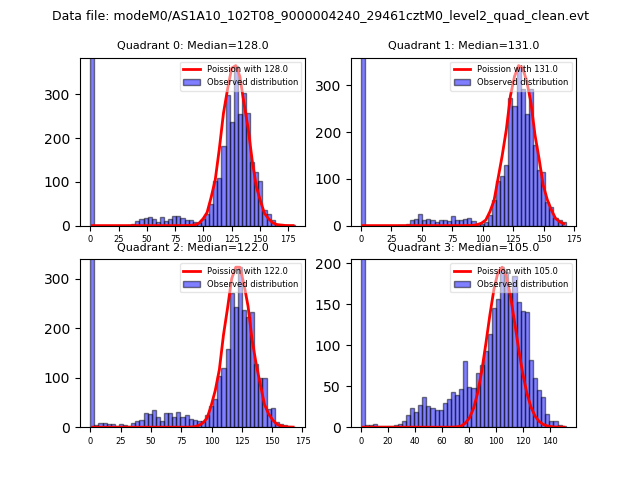 |
 |
| Quadrant-wise count rates Data is divided into 100 sec bins |
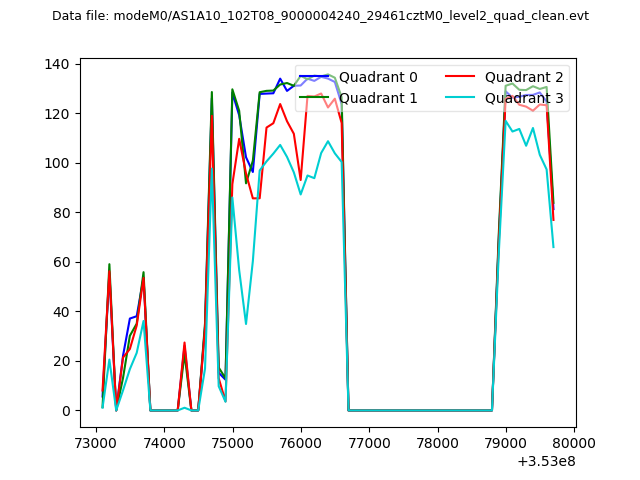 |
|
| Module-wise count rates for Quadrant A Data is divided into 100 sec bins |
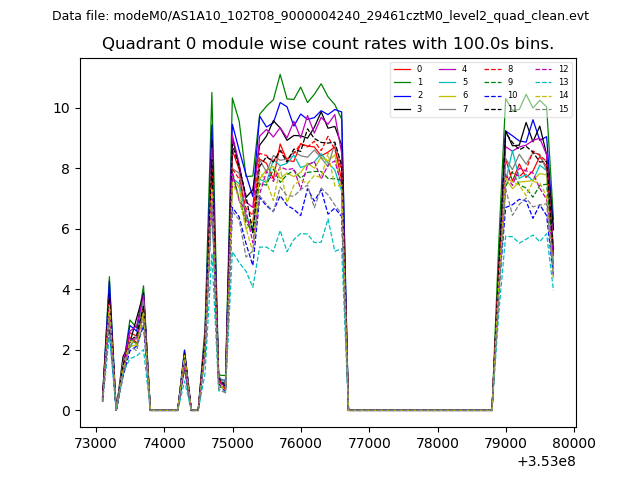 |
 |
| Module-wise count rates for Quadrant B Data is divided into 100 sec bins |
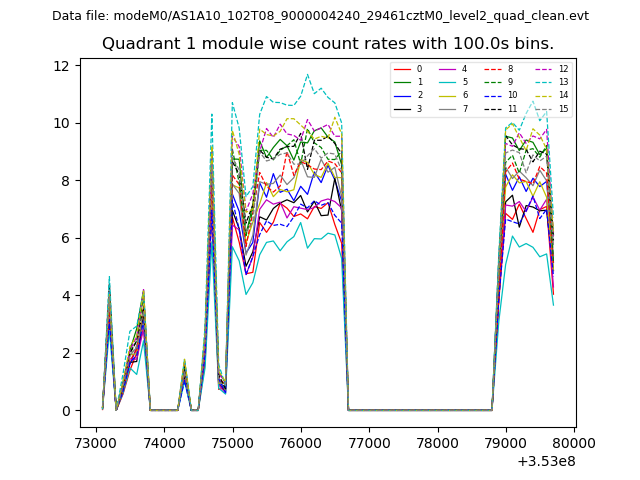 |
 |
| Module-wise count rates for Quadrant C Data is divided into 100 sec bins |
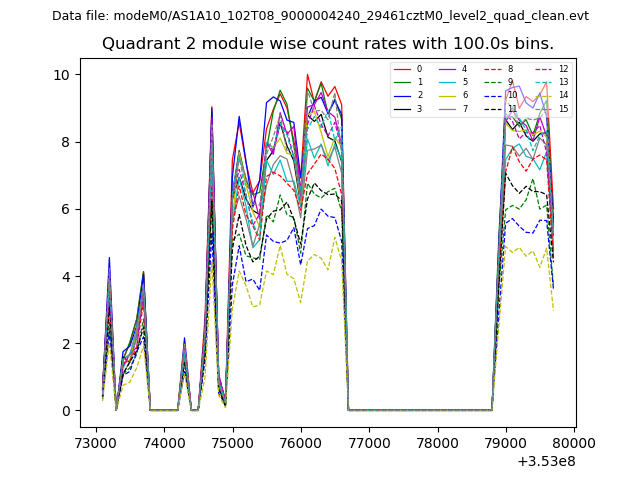 |
 |
| Module-wise count rates for Quadrant D Data is divided into 100 sec bins |
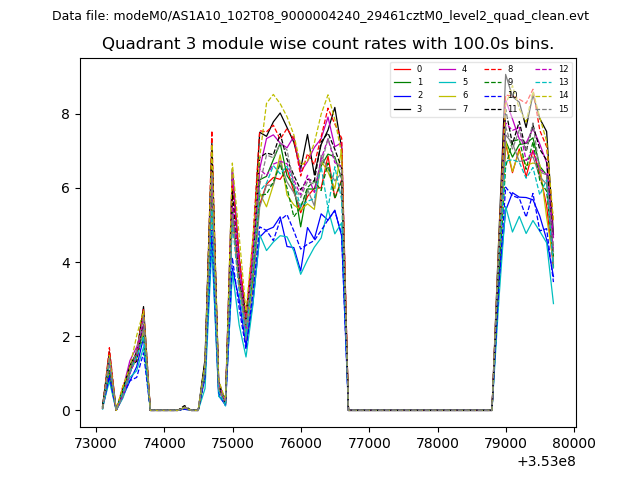 |
 |
| Parameter | Plot |
|---|---|
| CZT HV Monitor | 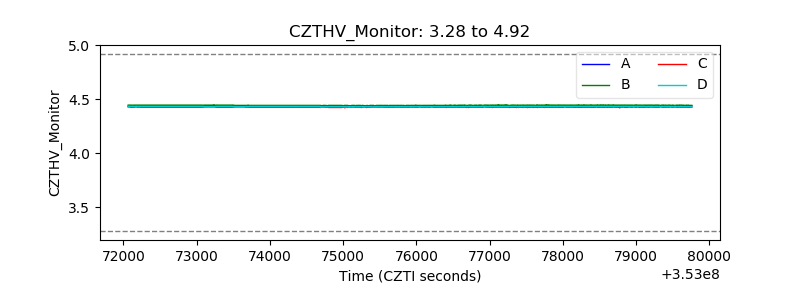 |
| D_VDD | 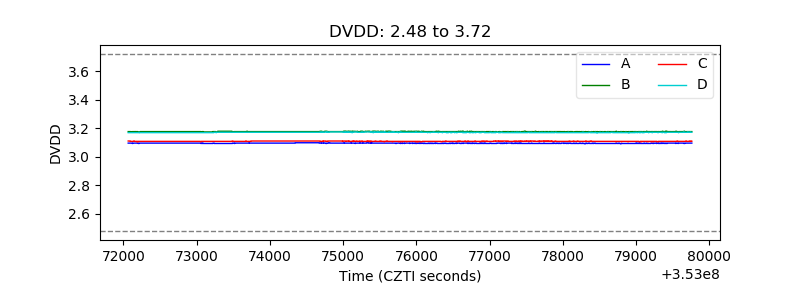 |
| Temperature 1 | 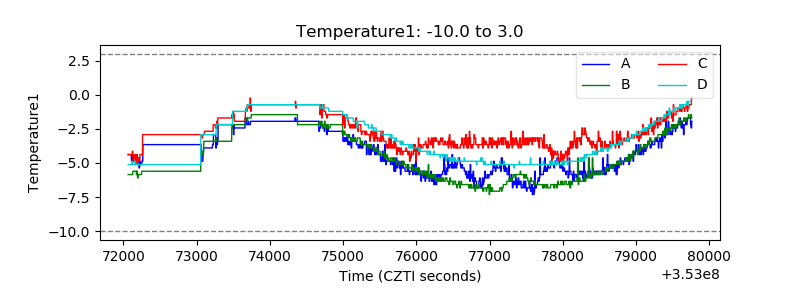 |
| Veto HV Monitor | 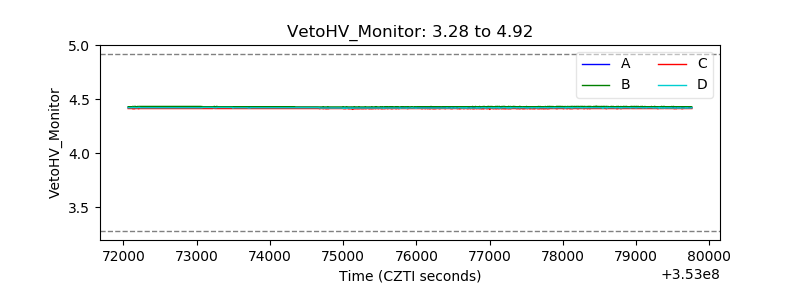 |
| Veto LLD | 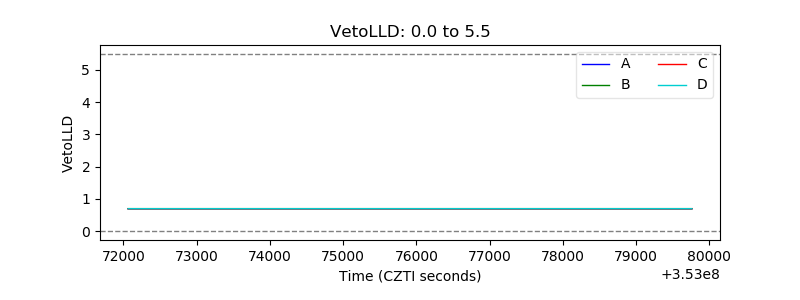 |
| Alpha Counter | 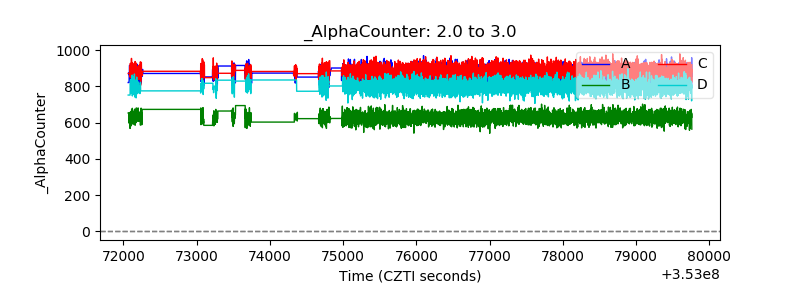 |
| _CPM_Rate | 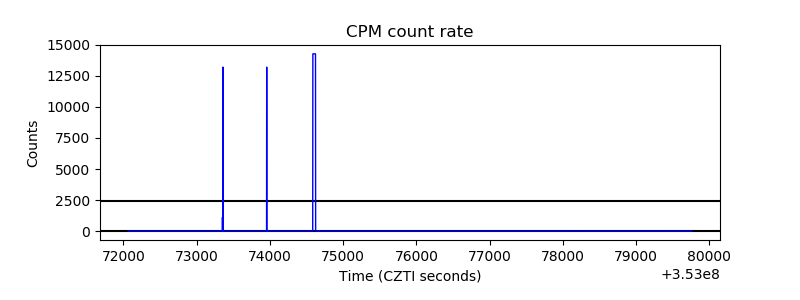 |
| CZT Counter | 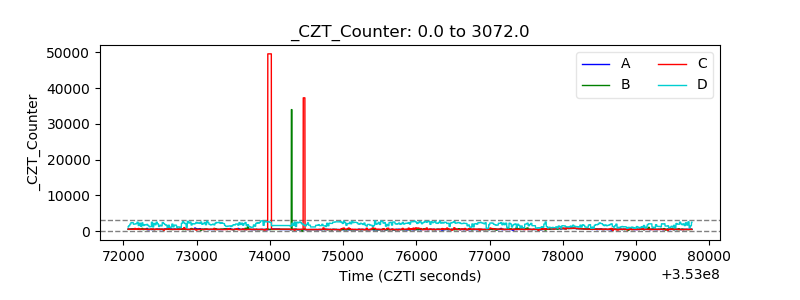 |
| +2.5 Volts monitor |  |
| +5 Volts monitor |  |
| _ROLL_ROT | 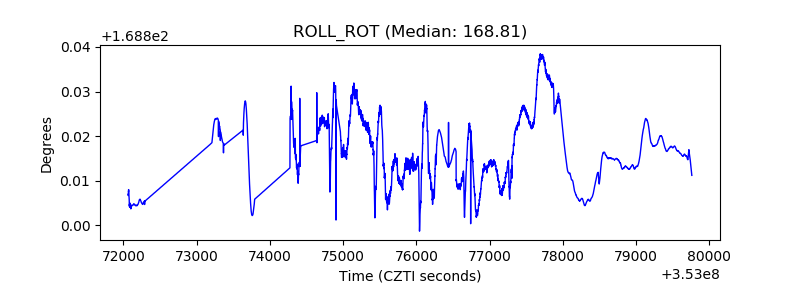 |
| _Roll_DEC | 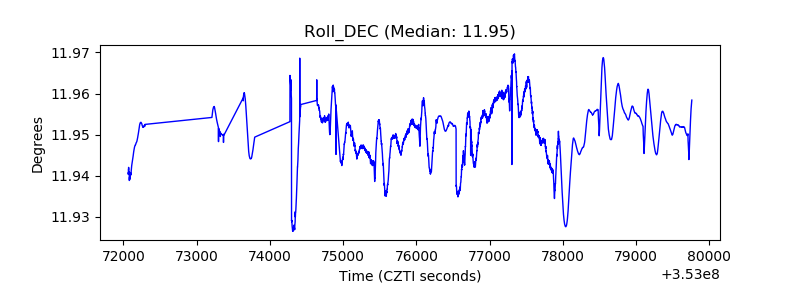 |
| _Roll_RA | 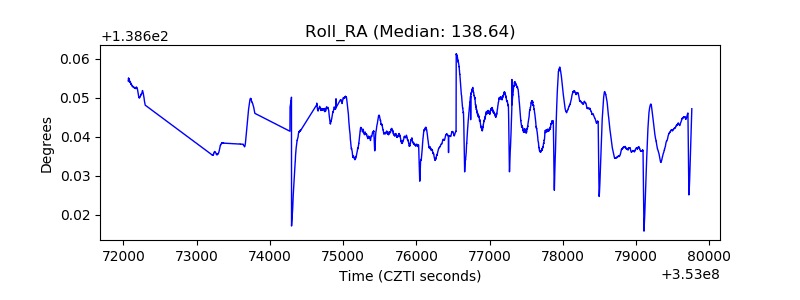 |
| Veto Counter | 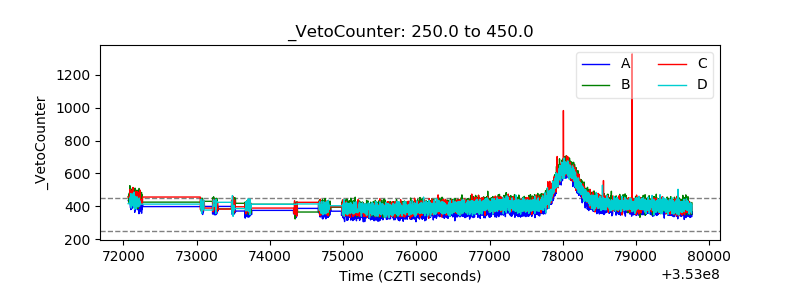 |