| Param | Original file | Final file |
|---|---|---|
| Filename | modeM0/AS1A10_102T08_9000004240_29466cztM0_level2.evt | modeM0/AS1A10_102T08_9000004240_29466cztM0_level2_quad_clean.evt |
| Size (bytes) | 866,583,360 | 83,885,760 |
| Size | 826.4 MB | 80.0 MB |
| Events in quadrant A | 3,266,981 | 583,090 |
| Events in quadrant B | 3,283,735 | 590,724 |
| Events in quadrant C | 3,477,315 | 559,834 |
| Events in quadrant D | 15,760,423 | 335,047 |
| Mode M0 | |||
|---|---|---|---|
| Quadrant | BADHDUFLAG | Total packets | Discarded packets |
| A | 0 | 14107 | 2 |
| B | 0 | 14055 | 2 |
| C | 0 | 14660 | 2 |
| D | 0 | 51375 | 2 |
| Mode M9 | |||
|---|---|---|---|
| Quadrant | BADHDUFLAG | Total packets | Discarded packets |
| A | 0 | 13 | 0 |
| B | 0 | 14 | 0 |
| C | 0 | 14 | 0 |
| D | 0 | 14 | 0 |
| Mode SS | |||
|---|---|---|---|
| Quadrant | BADHDUFLAG | Total packets | Discarded packets |
| A | 0 | 140 | 0 |
| B | 0 | 140 | 0 |
| C | 0 | 140 | 0 |
| D | 0 | 140 | 0 |
| Quadrant | Total seconds | Saturated seconds | Saturation percentage |
|---|---|---|---|
| A | 6734 | 63 | 0.935551% |
| B | 6734 | 81 | 1.202851% |
| C | 6734 | 124 | 1.841402% |
| D | 6734 | 5724 | 85.001485% |
Noise dominated data is calculated using 1-second bins in cleaned event files. If a bin has >2000 counts, and if more than 50% of those come from <1% of pixels, then it is considered to be noise-dominated and hence unusable.
| Quadrant | # 1 sec bins | Bins with >0 counts | Bins with >2000 counts | High rate bins dominated by noise | Noise dominated (total time) | Noise dominated (detector-on time) | Marked lightcurve |
|---|---|---|---|---|---|---|---|
| A | 7564 | 6735 | 1 | 1 | 0.01% | 0.01% | 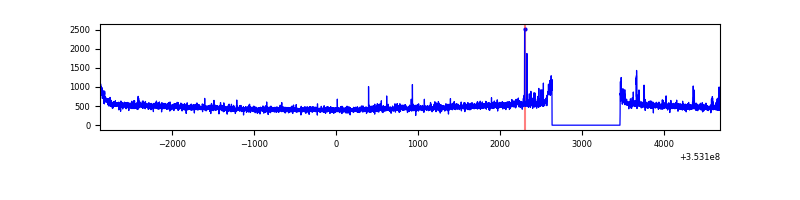 |
| B | 7564 | 6735 | 0 | 0 | 0.00% | 0.00% | 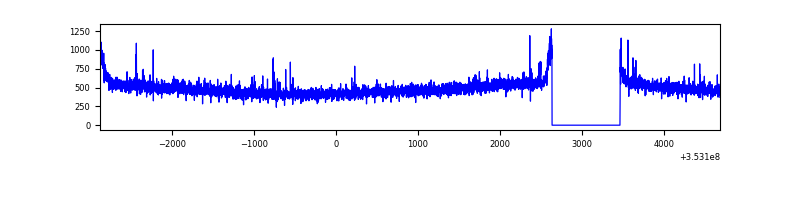 |
| C | 7564 | 6735 | 0 | 0 | 0.00% | 0.00% | 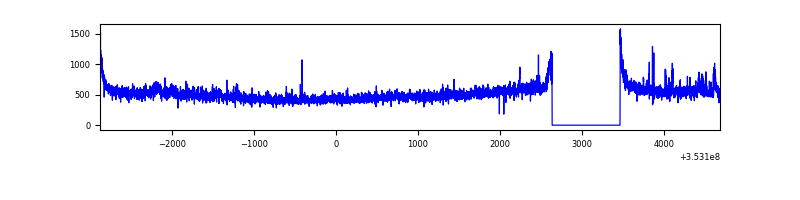 |
| D | 7564 | 6734 | 5210 | 5210 | 68.88% | 77.37% | 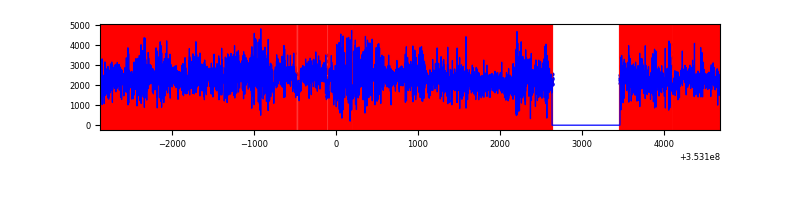 |
Top three noisy pixels from each quadrant. If the there are fewer than three noisy pixels in the level2.evt file, extra rows are filled as -1
| Pixel properties | Quadrant properties | ||||||
|---|---|---|---|---|---|---|---|
| Quadrant | DetID | PixID | Counts | Sigma | Mean | Median | Sigma |
| A | 0 | 13 | 50751 | 296.75 | 831 | 814 | 168.3 |
| A | 13 | 254 | 12629 | 70.21 | 831 | 814 | 168.3 |
| A | 3 | 137 | 8252 | 44.2 | 831 | 814 | 168.3 |
| B | 12 | 111 | 19662 | 116.43 | 824 | 802 | 162.0 |
| B | 11 | 111 | 17969 | 105.97 | 824 | 802 | 162.0 |
| B | 14 | 111 | 16198 | 95.04 | 824 | 802 | 162.0 |
| C | 3 | 233 | 213914 | 1134.74 | 794 | 799 | 187.8 |
| C | 14 | 238 | 137664 | 728.74 | 794 | 799 | 187.8 |
| C | 2 | 114 | 16158 | 81.78 | 794 | 799 | 187.8 |
| D | 8 | 195 | 9121221 | 66577.82 | 565 | 549 | 137.0 |
| D | 7 | 80 | 3086773 | 22528.39 | 565 | 549 | 137.0 |
| D | 1 | 52 | 824406 | 6013.88 | 565 | 549 | 137.0 |
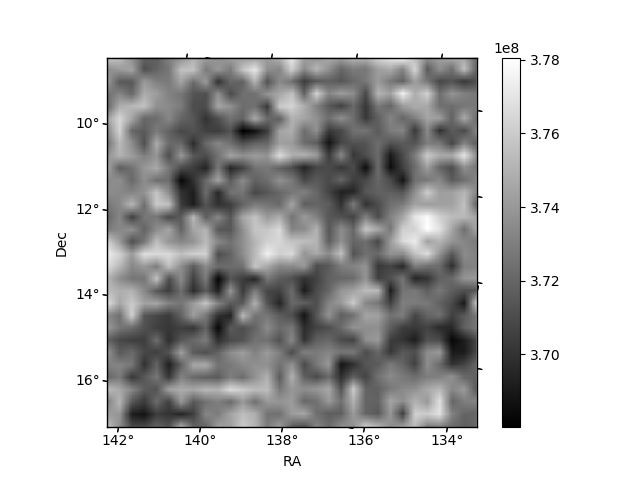
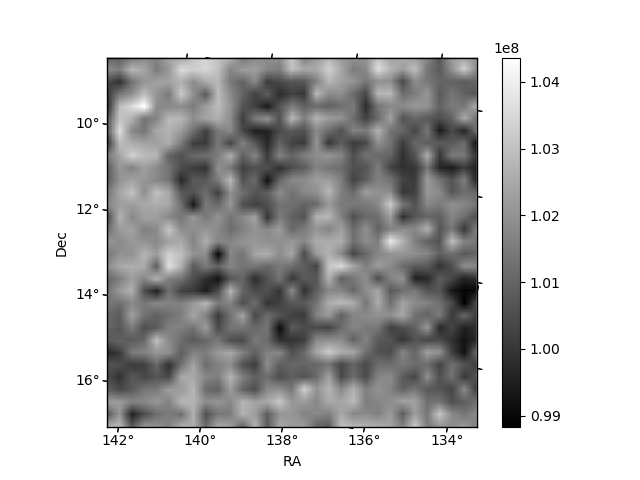
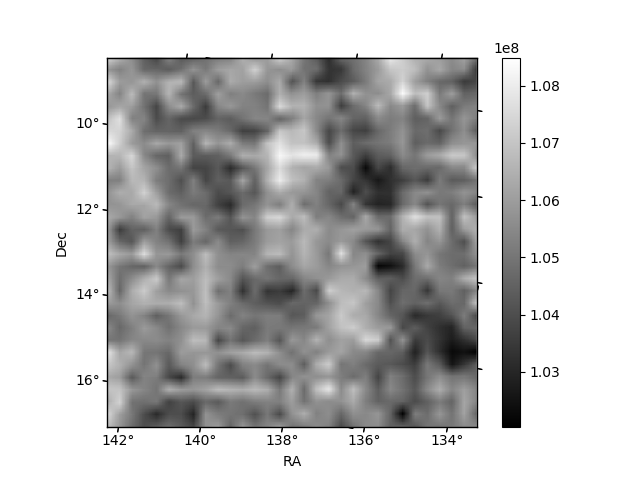
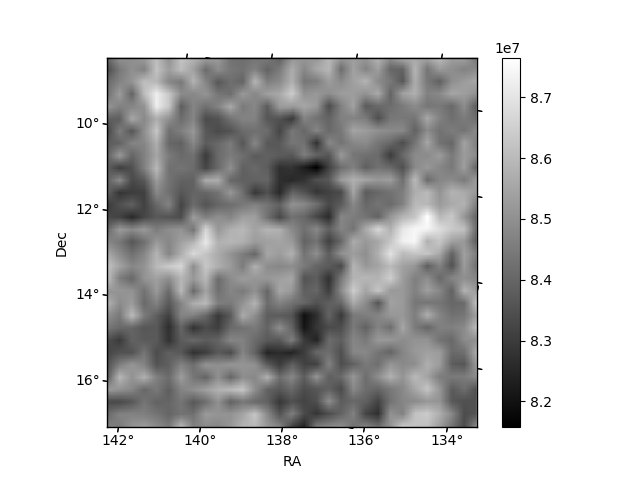
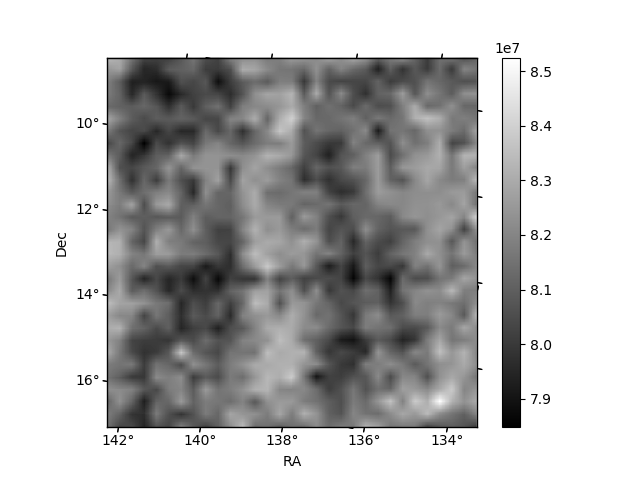
Histogram calculated using DETX and DETY for each event in the final _common_clean file
| Quadrant A | 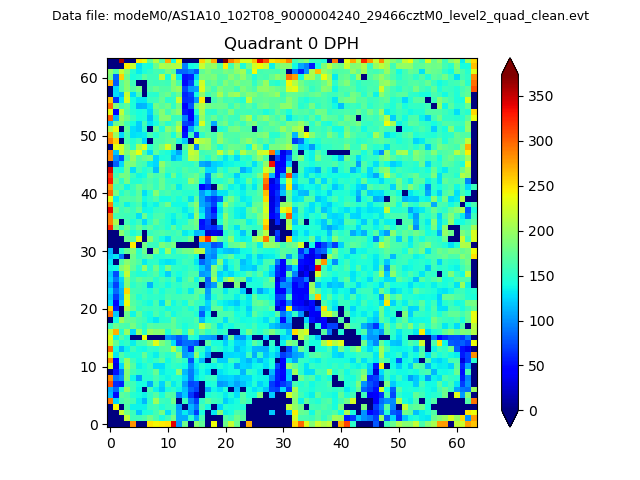 |
 |
Quadrant B |
|---|---|---|---|
| Quadrant D | 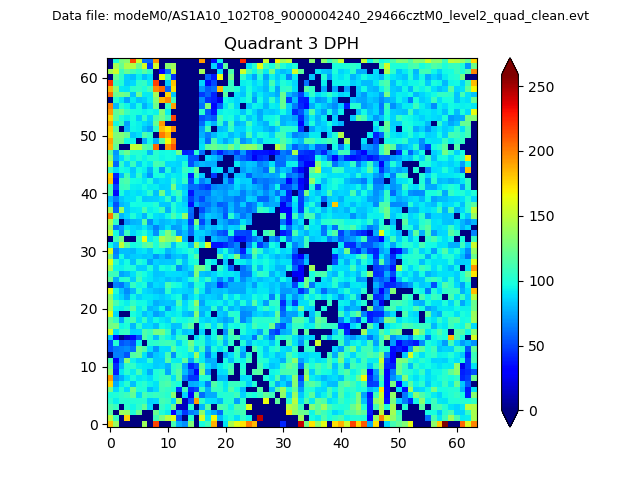 |
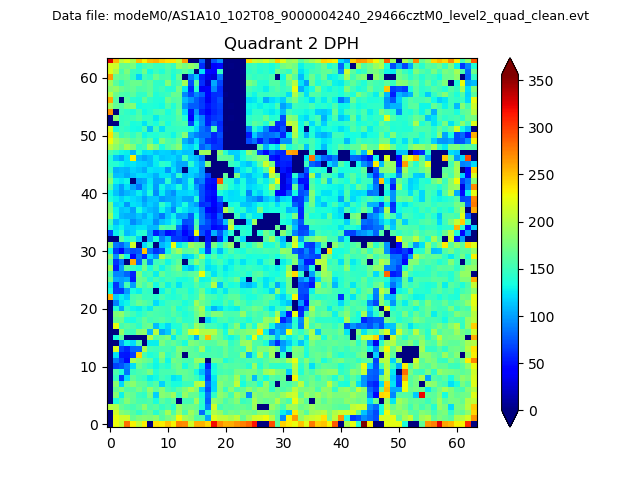 |
Quadrant C |
| Plot type | Count rate plots | Images |
|---|---|---|
| Comparison with Poisson distribution Blue bars denote a histogram of data divided into 1 sec bins. Red curve is a Poisson curve with rate = median count rate of data. |
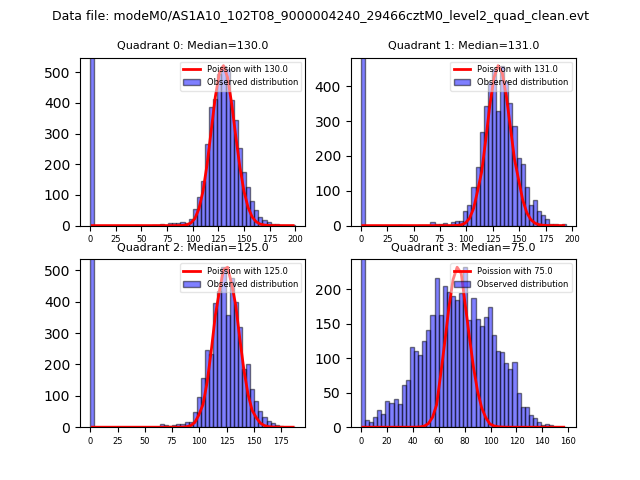 |
 |
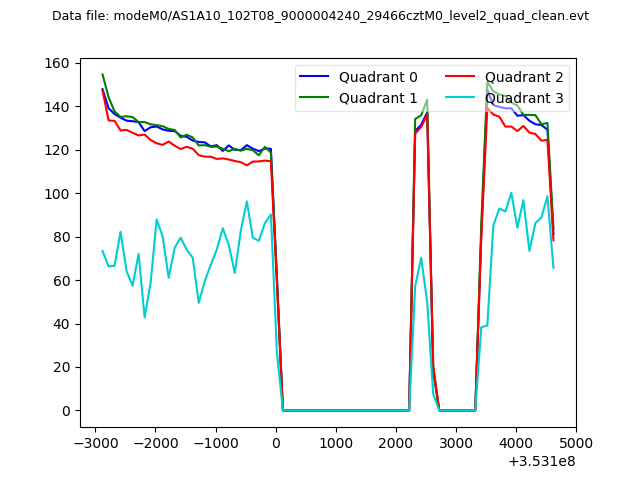
| Quadrant-wise count rates Data is divided into 100 sec bins |
 |
|
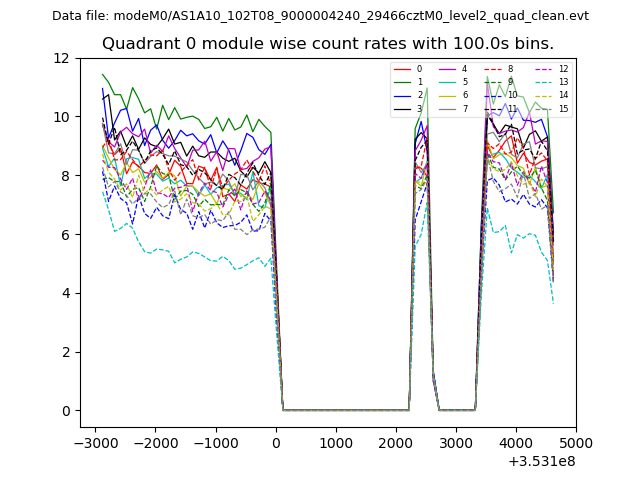
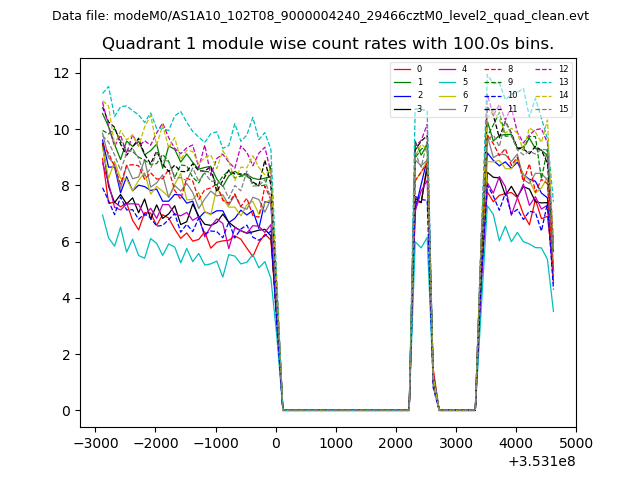
| Module-wise count rates for Quadrant A Data is divided into 100 sec bins |
 |
 |
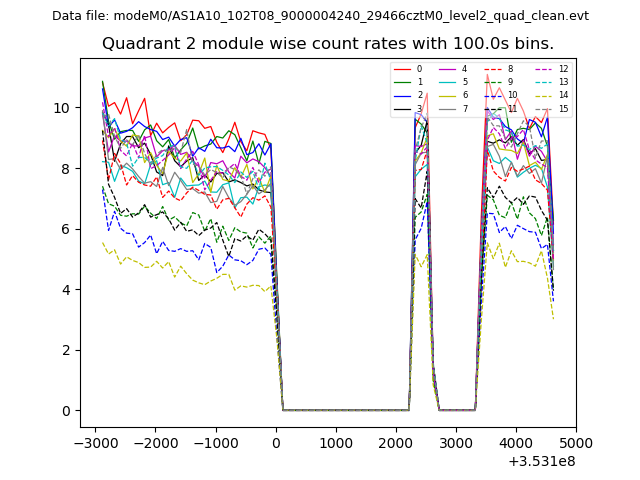
| Module-wise count rates for Quadrant B Data is divided into 100 sec bins |
 |
 |
| Module-wise count rates for Quadrant C Data is divided into 100 sec bins |
 |
 |
| Module-wise count rates for Quadrant D Data is divided into 100 sec bins |
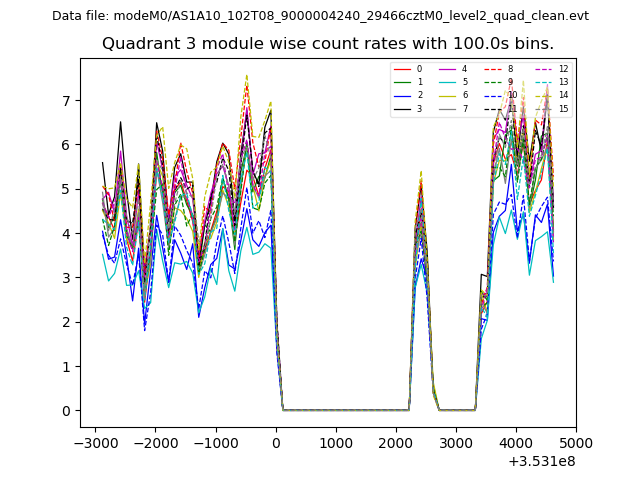 |
 |
| Parameter | Plot |
|---|---|
| CZT HV Monitor | 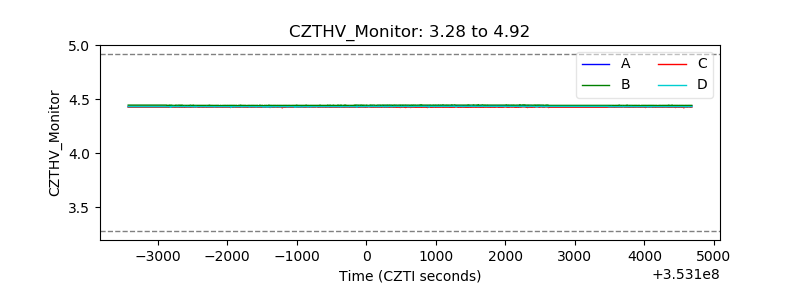 |
| D_VDD | 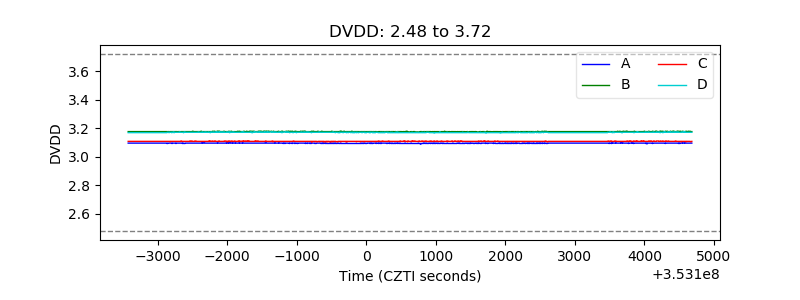 |
| Temperature 1 | 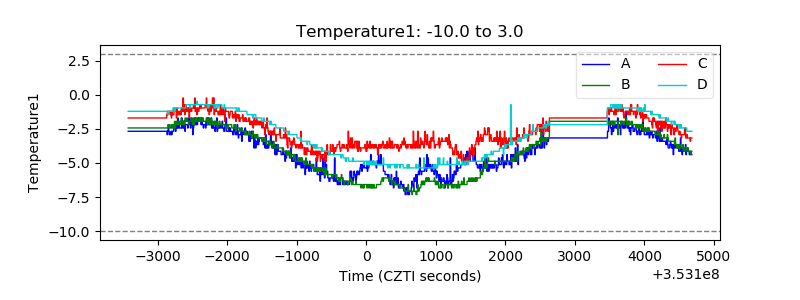 |
| Veto HV Monitor | 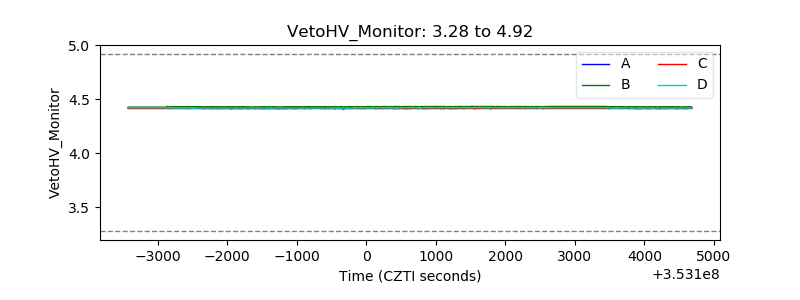 |
| Veto LLD |  |
| Alpha Counter | 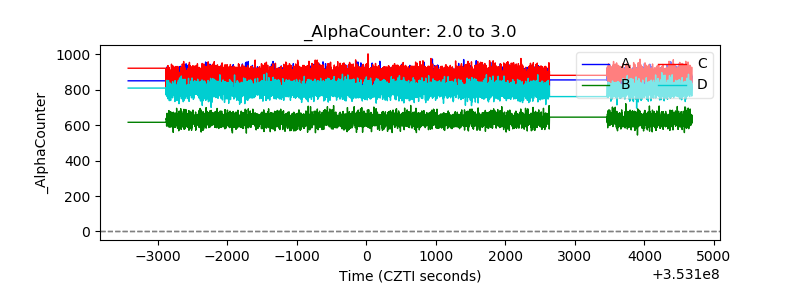 |
| _CPM_Rate | 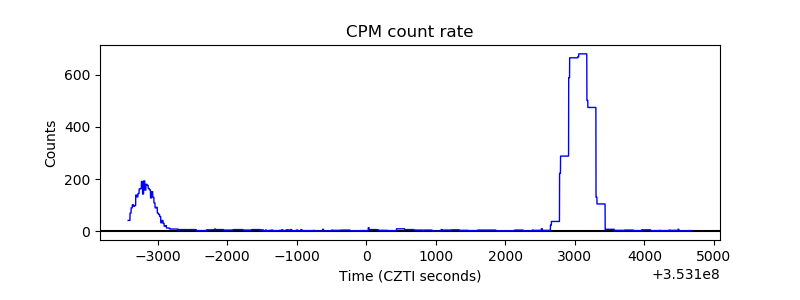 |
| CZT Counter | 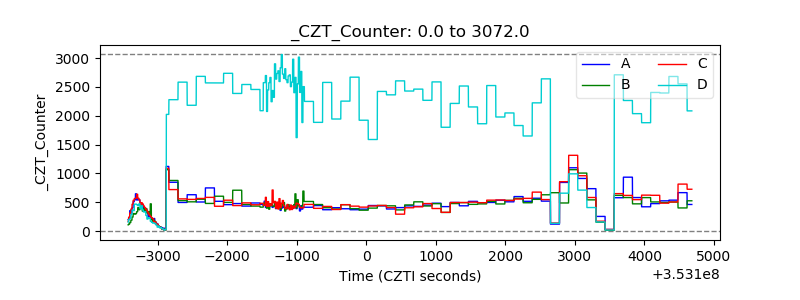 |
| +2.5 Volts monitor | 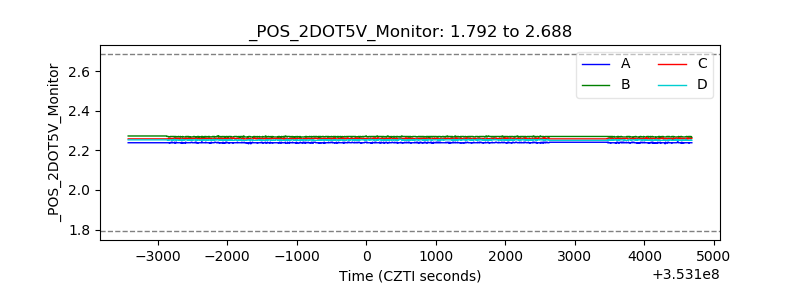 |
| +5 Volts monitor |  |
| _ROLL_ROT | 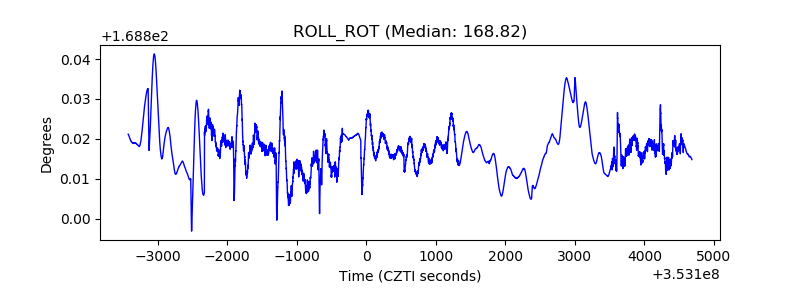 |
| _Roll_DEC | 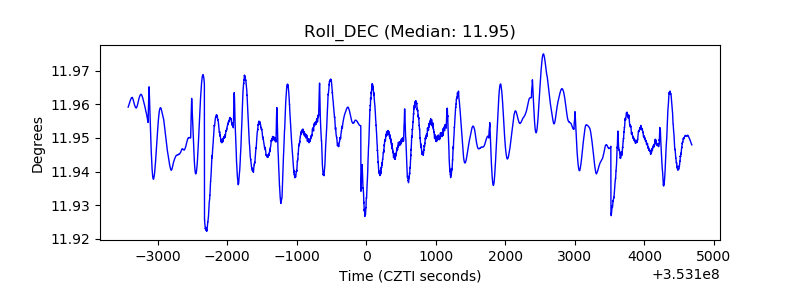 |
| _Roll_RA | 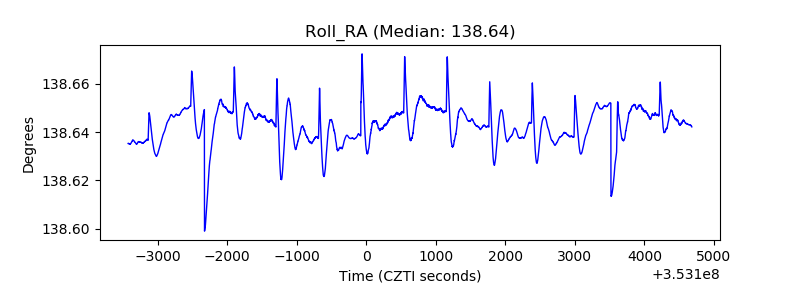 |
| Veto Counter |  |