| Param | Original file | Final file |
|---|---|---|
| Filename | modeM0/AS1A10_102T09_9000004242cztM0_level2.fits | modeM0/AS1A10_102T09_9000004242cztM0_level2_quad_clean.evt |
| Size (bytes) | 616,011,840 | 471,502,080 |
| Size | 587.5 MB | 449.7 MB |
| Events in quadrant A | 3,966,474 | 2,831,508 |
| Events in quadrant B | 3,810,238 | 2,845,126 |
| Events in quadrant C | 3,786,382 | 2,677,224 |
| Events in quadrant D | 2,767,542 | 1,607,690 |
| Mode SS | |||
|---|---|---|---|
| Quadrant | BADHDUFLAG | Total packets | Discarded packets |
| A | 0 | 1270 | 0 |
| B | 0 | 1274 | 0 |
| C | 0 | 1274 | 0 |
| D | 0 | 1270 | 0 |
| Mode M9 | |||
|---|---|---|---|
| Quadrant | BADHDUFLAG | Total packets | Discarded packets |
| A | 0 | 89 | 0 |
| B | 0 | 89 | 0 |
| C | 0 | 89 | 0 |
| D | 0 | 90 | 0 |
| Mode M0 | |||
|---|---|---|---|
| Quadrant | BADHDUFLAG | Total packets | Discarded packets |
| A | 0 | 131900 | 0 |
| B | 0 | 133456 | 0 |
| C | 0 | 146552 | 0 |
| D | 0 | 360465 | 0 |
| Quadrant | Total seconds | Saturated seconds | Saturation percentage |
|---|---|---|---|
| A | 62965 | 1296 | 2.058286% |
| B | 62968 | 1506 | 2.391691% |
| C | 62952 | 2337 | 3.712352% |
| D | 62798 | 20935 | 33.337049% |
Noise dominated data is calculated using 1-second bins in cleaned event files. If a bin has >2000 counts, and if more than 50% of those come from <1% of pixels, then it is considered to be noise-dominated and hence unusable.
| Quadrant | # 1 sec bins | Bins with >0 counts | Bins with >2000 counts | High rate bins dominated by noise | Noise dominated (total time) | Noise dominated (detector-on time) | Marked lightcurve |
|---|---|---|---|---|---|---|---|
| A | 82073 | 63065 | 0 | 0 | 0.00% | 0.00% |  |
| B | 82073 | 63054 | 0 | 0 | 0.00% | 0.00% |  |
| C | 82073 | 63042 | 0 | 0 | 0.00% | 0.00% |  |
| D | 82073 | 62559 | 0 | 0 | 0.00% | 0.00% |  |
Top three noisy pixels from each quadrant. If the there are fewer than three noisy pixels in the level2.evt file, extra rows are filled as -1
| Pixel properties | Quadrant properties | ||||||
|---|---|---|---|---|---|---|---|
| Quadrant | DetID | PixID | Counts | Sigma | Mean | Median | Sigma |
| A | 0 | 29 | 3336 | 9.38 | 1034 | 970 | 252.2 |
| A | 7 | 110 | 3093 | 8.42 | 1034 | 970 | 252.2 |
| A | 0 | 30 | 2947 | 7.84 | 1034 | 970 | 252.2 |
| B | 2 | 9 | 3200 | 11.42 | 1007 | 963 | 195.9 |
| B | 2 | 8 | 2631 | 8.51 | 1007 | 963 | 195.9 |
| B | 3 | 17 | 2594 | 8.32 | 1007 | 963 | 195.9 |
| C | 1 | 81 | 2922 | 7.81 | 1000 | 937 | 254.2 |
| C | 1 | 80 | 2918 | 7.79 | 1000 | 937 | 254.2 |
| C | 3 | 187 | 2562 | 6.39 | 1000 | 937 | 254.2 |
| D | 10 | 189 | 2004 | 6.11 | 791 | 720 | 210.3 |
| D | 15 | 46 | 1986 | 6.02 | 791 | 720 | 210.3 |
| D | 3 | 14 | 1980 | 5.99 | 791 | 720 | 210.3 |
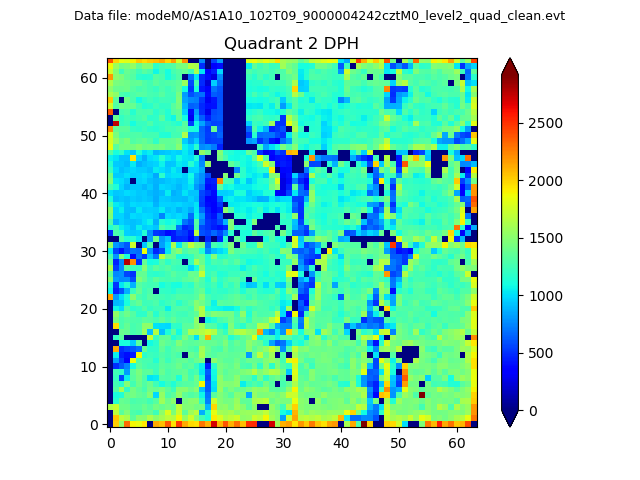
Histogram calculated using DETX and DETY for each event in the final _common_clean file
| Quadrant A | 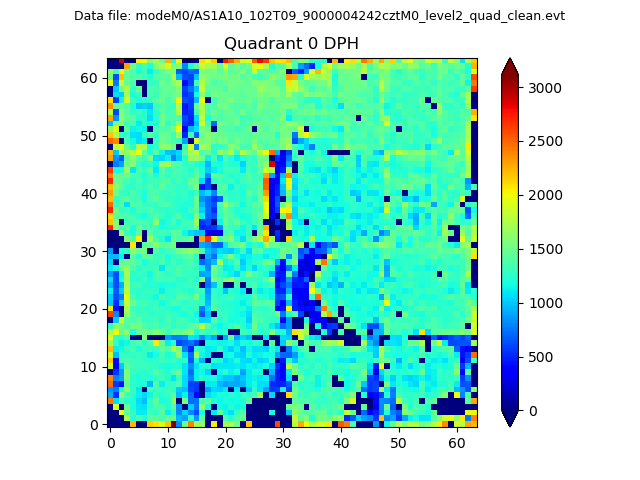 |
 |
Quadrant B |
|---|---|---|---|
| Quadrant D |  |
 |
Quadrant C |
| Plot type | Count rate plots | Images |
|---|---|---|
| Comparison with Poisson distribution Blue bars denote a histogram of data divided into 1 sec bins. Red curve is a Poisson curve with rate = median count rate of data. |
 |
 |
| Quadrant-wise count rates Data is divided into 100 sec bins |
 |
|
| Module-wise count rates for Quadrant A Data is divided into 100 sec bins |
 |
 |
| Module-wise count rates for Quadrant B Data is divided into 100 sec bins |
 |
 |
| Module-wise count rates for Quadrant C Data is divided into 100 sec bins |
 |
 |
| Module-wise count rates for Quadrant D Data is divided into 100 sec bins |
 |
 |
| Parameter | Plot |
|---|---|
| CZT HV Monitor | 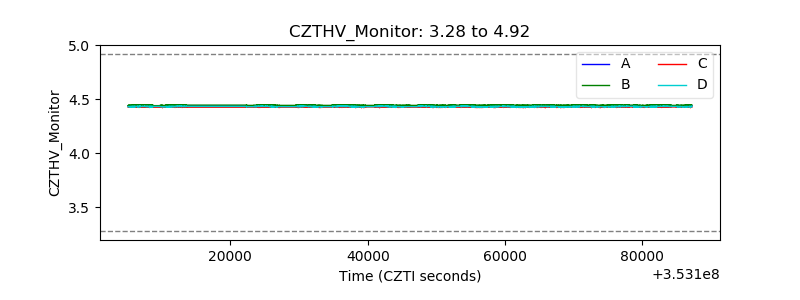 |
| D_VDD | 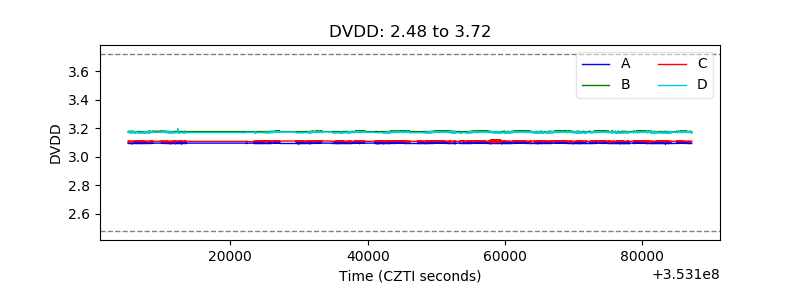 |
| Temperature 1 |  |
| Veto HV Monitor |  |
| Veto LLD |  |
| Alpha Counter |  |
| _CPM_Rate |  |
| CZT Counter |  |
| +2.5 Volts monitor |  |
| +5 Volts monitor |  |
| _ROLL_ROT |  |
| _Roll_DEC |  |
| _Roll_RA |  |
| Veto Counter |  |